Annual Sales Growth Chart & Graph
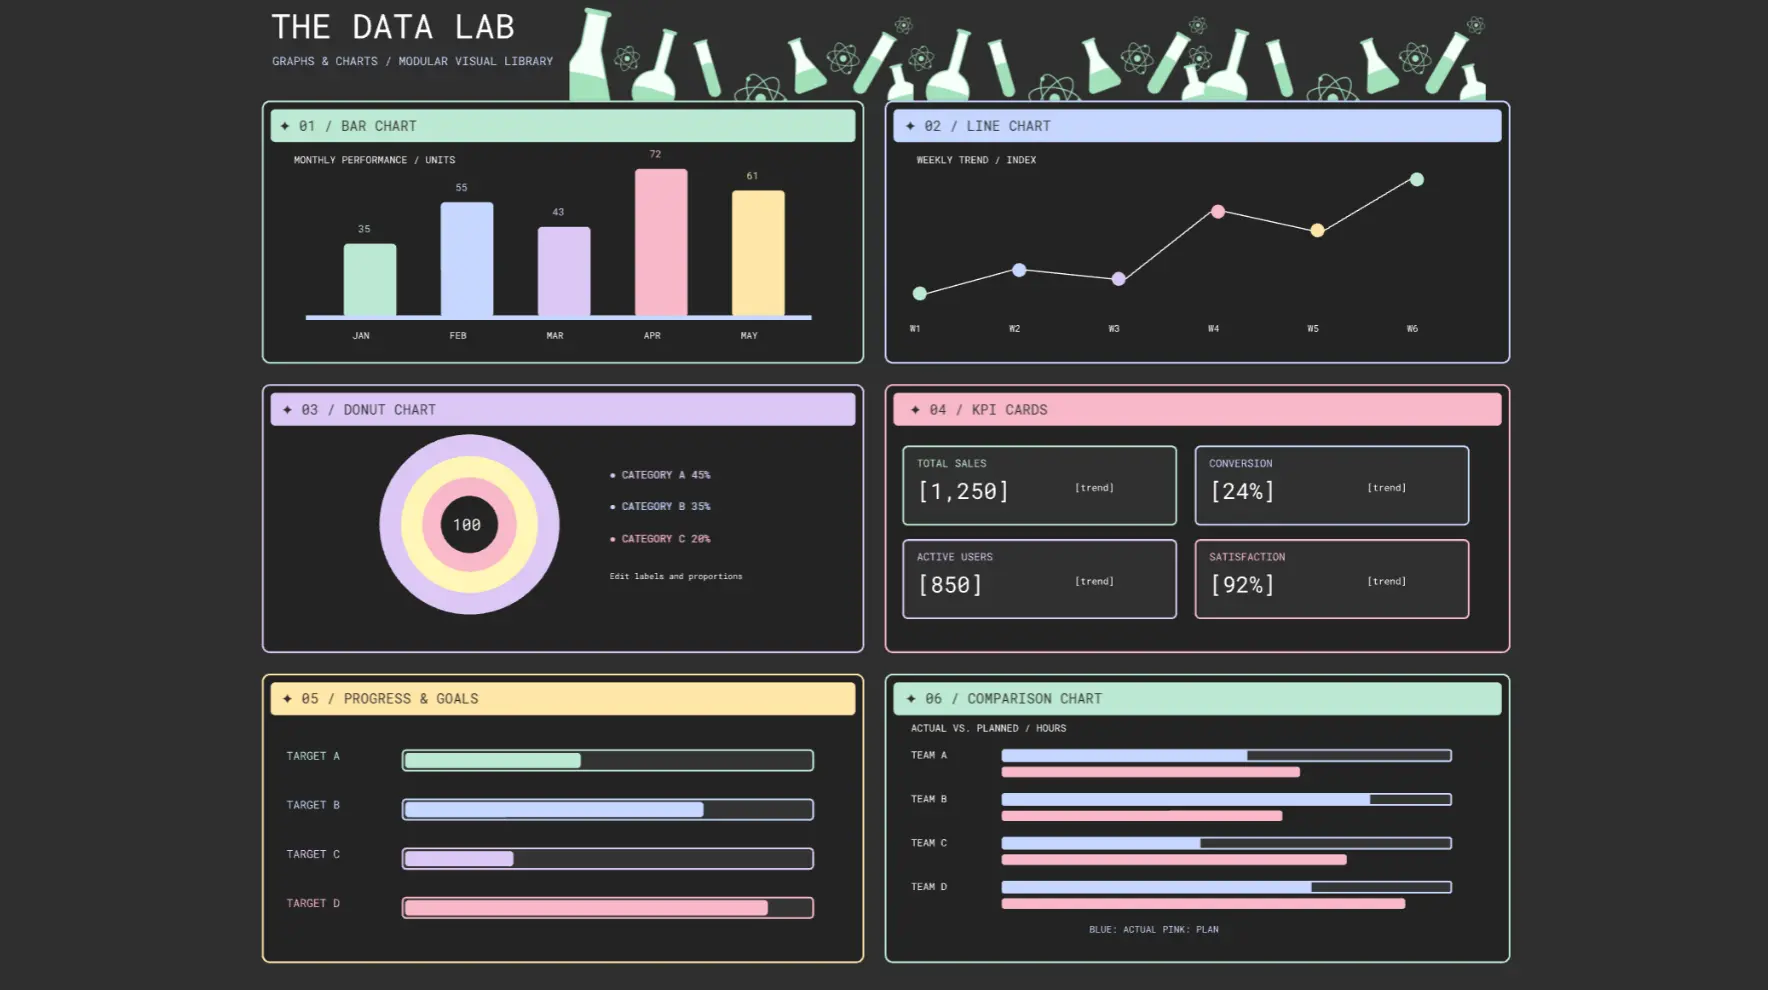
Visualize revenue growth over multiple years. Track YoY performance, identify trends, forecast revenue, and support strategic decisions.
Who Can Use
Sales Managers, CFOs, Business Analysts, Marketing Teams, Founders, Executives, Finance Teams, Investors. Ideal for SMBs, enterprises, startups, non-profits, e-commerce, SaaS, and services firms.
How to Use
Define time period (3–7 years recommended)
Collect annual revenue data
Calculate YoY Growth: ((Current − Previous) / Previous) × 100
Choose chart type: bar, line, or combo
Apply color coding and label axes
Interpret: spot peaks, declines, gaps vs. targets
Best Practices
Update each fiscal year, annotate key events, share in executive summaries.
Cheers!
Khawaja Rizwan, MVP