Table of contents
Table of contents
How to present your UX research findings
Summary
In this guide, you’ll learn:
- What to include in a UX research report
- How to structure a research presentation
- How to communicate outcomes
- A simple report and deck workflow
- Practical tips for different stakeholders
- Tools, templates and UX research report examples you can use
Collaborative AI Workflows
Join thousands of teams using Miro to build the right thing, faster.
We’ve all spent hours turning user interviews, usability tests, and product analytics into actionable insights. It’s time consuming, but realistically, it’s still only half the work. Presenting UX findings in a stakeholder-ready format is the next big step. Miro’s Momentum at Work report notes that knowledge workers now spend three hours on maintenance tasks for every hour of momentum work, and this includes time lost digging through notes and slide decks to make sense of all the research.
External research also shows that organizations that integrate research into product decisions report dramatic improvements, including 83% better product usability, 63% higher customer satisfaction, and 2.7x better outcomes when research is embedded in business strategy. Investing in clear, concise UX research presentations reduces wasted effort and drives better products. This guide will show you how to transform your UX research into presentations and reports that drive better decisions.
Why sharing UX research matters
UX research is about more than gathering data; it’s also about influencing better decisions. Effective sharing of UX research creates multiple benefits.
- Reduces risk - with early presentation of findings, teams can validate assumptions before committing to costly development.
- Informs decisions - clear reports help you frame insights around specific business or product questions, informing the next steps.
- Aligns teams - priorities and trade-offs are much easier to agree on when everyone sees the same evidence.
- Builds empathy - real quotes, clips, and data help teams recognize and acknowledge user needs and pain points beyond abstract metrics.
- Prioritizes improvements - well-structured deliverables surface the most important issues and opportunities, making it clear where resources should be focused.
Create your own user research presentation in Miro and discover why UX research matters - learn how in our video.
UX research outcomes
Research outcomes are not just raw observations, they are the decisions and changes your work enables and guides. Typical outcomes include:
- Key insights: Evidence-backed statements that explain why users behave a certain way. Each insight should be paired with data, such as quotes, metrics, or clips, and context.
- Evidence collections: Organized sets of quotes, notes, and metrics that support each insight. Keeping evidence linked to findings increases credibility and enables deeper dives.
- Prioritized issues: A ranked list of problems or opportunities, showing which matters most to both users and the business.
- Actionable recommendations: Concrete proposals for design, product, or process changes, including owners and expected impact.
- Next steps and open questions: Clear tasks for further research or implementation, alongside unknowns that need validation.
Components of a UX research report
Based on best practices, a stakeholder-ready UX report balances deep insights with short summaries in equal measure. Here are six components you should always include in your UX research reports.
- Introduction: A short overview of your research, why it’s important, and how it connects to wider company objectives or challenges.
- Research goals: Outline the key decisions or questions your research will inform, along with any hypotheses.
- Business value: Explain why the research matters for the team or related product roadmap.
- Methodology: Outline your methods and participants at a high level, noting why they were chosen.
- Key learnings: Present your insights clearly and concisely, sharing context and evidence while tailoring depth to your audience.
- Recommendations: Present actionable next steps
- Next research: Clearly document what wasn’t tested, unresolved questions, or assumptions that need validation
- Appendix: Include links to source data such as interview transcripts, usability recordings, survey results, and analytics dashboards
How to write a UX research report
To craft a UX research report that meets stakeholder needs and drives action, the following steps can help.
1. Define the audience and decisions
Identify who will read your report, for example executives, designers, and engineers. Then, consider what decisions they will need to make. Tailor the language and amount of detail in your report accordingly - executives care about business impact, while developers need to know what technical changes are needed. A helpful reference for thinking about how UX research outputs support different stakeholder needs can be found in Miro’s UX research overview.
2. Lead with the summary
Your summary should set the scene for your report, summarizing the research goals, business value, and methodology. Then, you can list three to five key insights so busy stakeholders can grasp the key messages instantly. Structuring this upfront narrative can be easier using presentation-style frameworks such as Miro’s UX template collectionwhich helps shape clear, scannable executive summaries.
3. Show key learnings with evidence
For each insight, you need to pair it alongside proof. This could include recurring themes, quotes, data visualizations, and relevant artifacts like personas, journey maps, affinity diagrams, and prototypes. The key here is to make it easy for readers to trace findings back to raw data. To support this process, teams often use structured boards such as Miro’s UX Research Planand UX Research Trackerto systematically capture and organise evidence as it emerges.
4. Make recommendations actionable
Link each insight to a clear recommendation or design principle. You’ll need to specify the owner (i.e. product manager or designer etc), and the expected impact. Avoid vague suggestions and be explicit about how the recommendation addresses the insight and the metrics for success. Miro’s UX research guidancecan help frame how insights are translated into structured, decision-ready recommendations.
5. Provide depth via links
Keep your report scannable by linking out to repositories like a Miro board that contains raw notes, transcripts, survey results, and prototypes. This allows curious readers to dig deeper without overwhelming those who only need the top-line details. A useful starting point for this kind of supporting material is Miro’s research template library, which can act as a central hub for all underlying research artifacts.
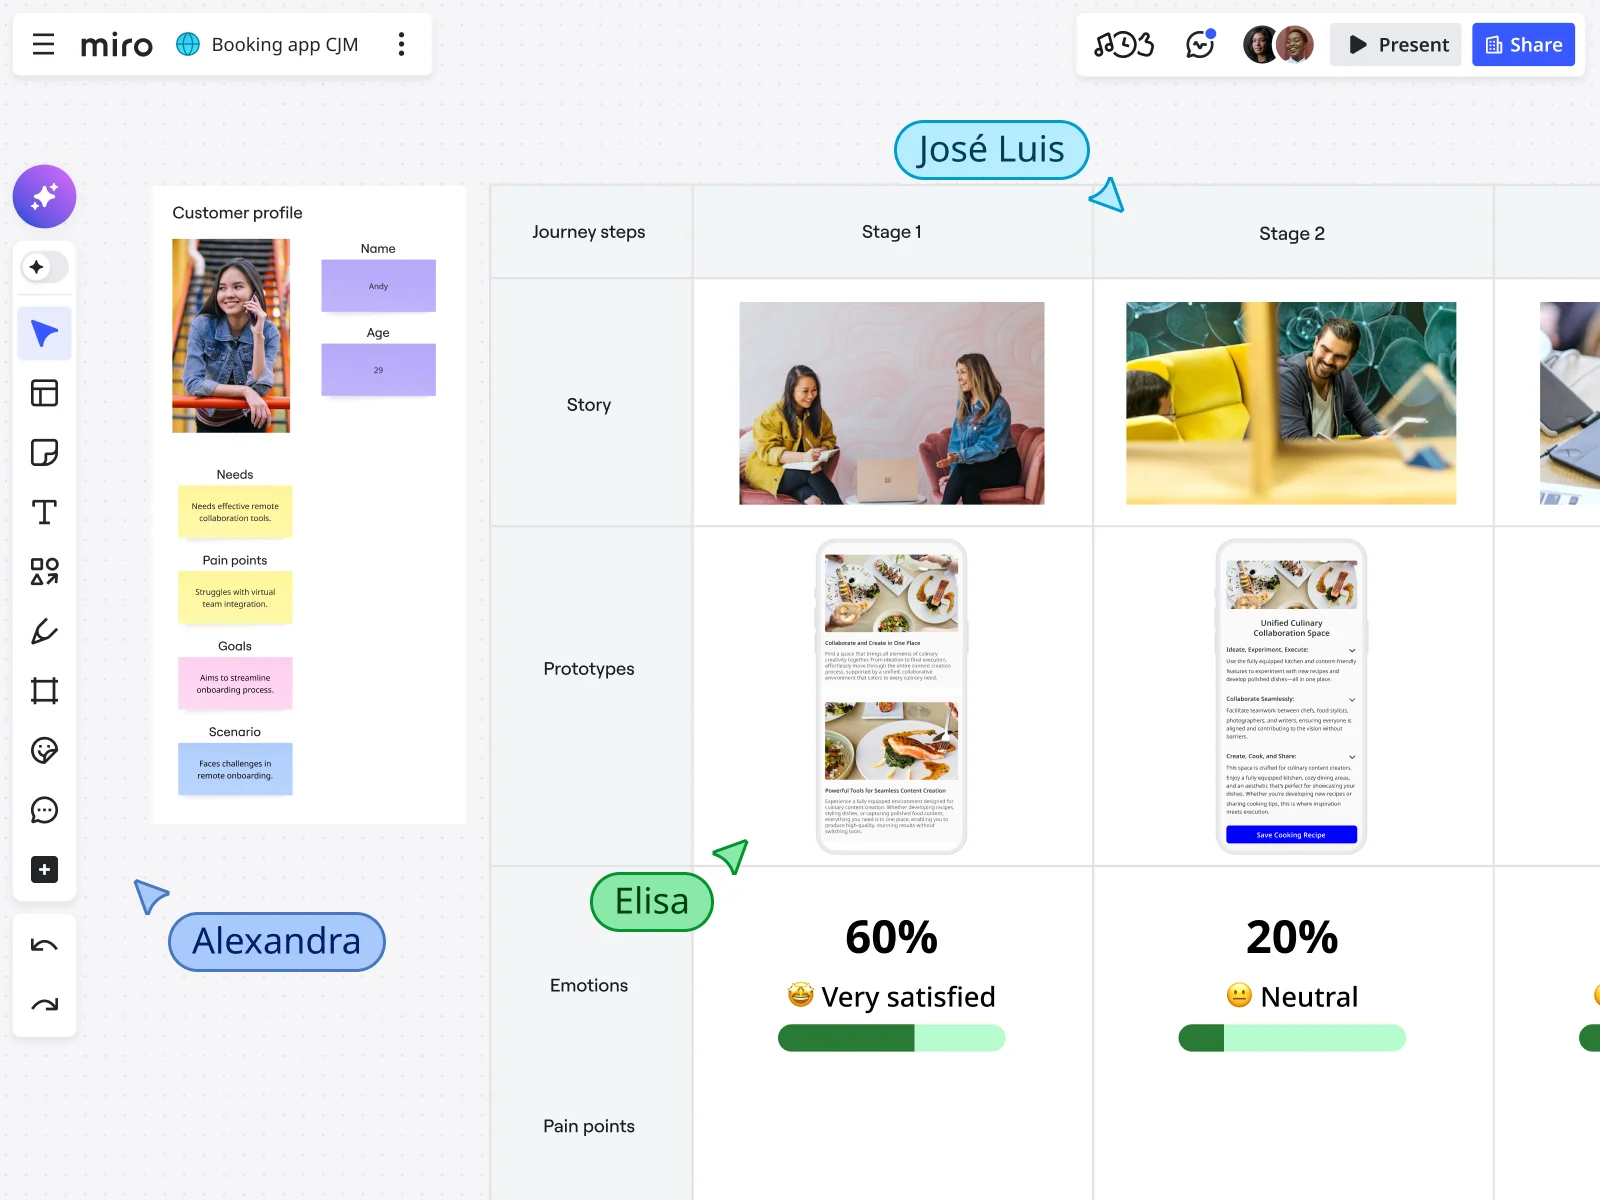
How to present UX research findings
Delivering your findings in a clear deck turns your research into a narrative that guides stakeholders towards decisions. Use a simple structure to keep the story clear and action-oriented:
- Why we did this - start with the decision or problem you’re addressing and the scope of the research. Explain how the research lines up with business goals.
- Methods at a glance - summarize who you spoke to, what methods you used, and how many participants were included. Keep the details concise; your audience shouldn’t need to understand every nuance.
- Top insights - present three to four key findings, one per slide. For every insight, state what you learned and why it matters.
- Evidence - follow each insight slide with quotes, clips, or metrics that brought that insight to life. Visuals and direct quotes here will support empathy among teams.
- Recommendations and priorities - provide actionable next steps tied to each insight, along with a sense of priority and impact.
- Risks, limitations, and gaps - briefly mention what you didn’t test, biases or uncertainties, and open questions that future research should address.
- Next steps - close your deck with a slide on who will be responsible for what and when. Clarify how you’ll monitor the impact of changes and when follow-up research should happen.
At Medibank, teams use Miro to bring UX research, customer feedback, and delivery insights into a shared visual workspace. Researchers can present findings in context, pairing insights with evidence, highlighting trade-offs, and aligning stakeholders across design, product and delivery. After a large project using Miro, Medibank achieved stakeholder alignment and a clear prototype in just six weeks - 75% less time from idea to outcome than originally thought.
“When everyone’s solving the same problem, in the same space, at the same time — that’s when the magic happens. That’s how six weeks becomes not just possible, but repeatable.” Ben Abbott, Product Leader at Medibank Digital Labs
Read the full Medibank case study
Alongside this structure, there are some additional considerations you need to keep in mind when drafting your UX research presentation.
Tell a story
Use questions, storytelling techniques, and varied media to maintain the attention of your stakeholders. Invite the audience to participate by asking them to predict findings or suggest solutions - Miro’s voting tools can help you do this.
You may also want to embed short videos, audio clips, or interactive prototypes instead of static slides. Miro’s collaborative canvas can make it easier for you to host these artifacts in one place.
Combine qualitative and quantitative data
Back up qualitative themes with supporting metrics wherever possible. For example, if users report confusion during onboarding, show usage drop-off metrics or task close rates to underscore the scale of the problem.
Focus on action
Limit your presentation to the top three or four insights and recommendations to avoid it becoming too long or unengaging. Humans process information best in small chunks; long lists may lead to decision fatigue.
UX research presentation templates
Building presentations from scratch can be time-consuming. Miro offers templates for UX research reports and presentations that guide you through the structure we detailed above. These templates include pre-built slides for method summaries, insight cards, evidence galleries, and recommendation lists.
Our UX research presentation examples and templates also integrate with tools you already use, including Figma, Google Slides, and video embeds so you can keep your narrative cohesive. Use the templates as a starting point and customize them for your audience.
Explore Miro’s UX research presentation templates
UX Research report vs presentation
When establishing whether to use a deck or a report for your research data, it’s best to compare their features alongside your overall goal. Reports can provide depth and longevity, while presentations can drive alignment in real time. You could also use both.
Here’s a short table highlighting when each method should be used, as well as when asynchronous updates may be necessary.
Format | Best for | Advantages | Limitations |
Written report | Sharing comprehensive findings and creating a record for future reference. | Allows detailed explanations, multiple appendices, and links to raw data. | Requires time to read and digest fully, making it less engaging for live sessions. |
Slide deck | Aligning a group quickly or communicating high-level insights. | Visuals and narrative can hold attention better, enabling real-time Q&A. | A deck must be concise to be engaging, so some details could be excluded. |
Async update | Informing stakeholders between meetings or across time zones. | Simple summaries via messaging platforms can maintain momentum, linking to your report for further details. | There may be less opportunity for discussion and immediate feedback. |
Tips for presenting UX research findings
Even the strongest research can fall flat if it’s not presented clearly. When sharing UX research findings, the goal isn’t to showcase methodology or volume; it’s to help stakeholders understand what matters, why it matters, and what to do next.
The tips below focus on keeping presentations focused, engaging, and decision-oriented, so research leads to alignment and action rather than more questions.
- Tell a story - use a narrative arc to guide your audience. Start with context, build tension with surprising findings, and finish up with a resolution. Storytelling helps stakeholders remember and act on what they hear.
- Show, don’t just tell - visualize data and include quotes or video clips to bring user voices into the room. Miro’s AI-powered prototypes let you create quick mockups to illustrate ideas and get instant feedback from stakeholders.
- Combine qual and quant - use statistics and charts to validate themes, then pair them with qualitative quotes to humanise the numbers.
- Highlight the impact - describe how each insight and recommendation will affect business metrics like activation, retention, or NPS.
- Be concise and transparent - focus on the few insights that matter most and be honest about what is not covered. Acknowledge limitations to reinforce the credibility of your work.
Best alternatives to in-house UX research
Not every organization has the bandwidth or expertise to conduct every research study in-house. Outsourcing can be a good option when:
- You lack capacity or specialist skills
- You need speed or scale
- You want independent validation
When researching and evaluating vendors, look for clear methodologies, transparent deliverables, access to raw data, and a plan for how they will communicate with your stakeholders. Remember that even if someone else conducts the research, your team is still responsible for interpreting and sharing it effectively.
Present and align research in Miro
Even with in-depth research, change cannot be achieved unless teams can see it, discuss it, and act on it together. Miro provides a collaborative canvas where you can centralize your evidence, draft reports, and build presentations in one place. You can import notes, sticky clusters, survey data, and AI-generated prototypes before creating interactive boards that tell a cohesive story.
Use Miro to map your research journey: capture user interviews, cluster patterns with Miro AI, draft insight cards, vote on priorities, and build report and presentation boards. With integrations to tools like Figma, Google Slides, Jira, and Confluence, Miro becomes a hub for research to live and grow.
FAQs
How do you present UX research findings to non-design stakeholders?
When presenting to non-design stakeholders, you should focus on decisions, not methods. Lead with a short summary of the top insights, explaining why they are critical to the business before pairing each insight with clear evidence and recommended actions. It’s best to avoid deep methodological detail unless you need it to build confidence.
What’s the difference between a UX research report and a presentation?
A UX research report is a detailed, written record that captures findings, evidence, and context for future reference. The goal of a presentation is to align and enable better decision-making, highlighting only the key insights, implications, and next steps. Many teams use both though; a report for depth and a presentation for discussion.
How many insights should I include in a UX research presentation?
The most effective UX research presentations focus on three to four key insights, keeping stakeholders engaged so actions can be prioritized more effectively. Additional findings can be linked in supporting materials or a research repository.
Can Miro AI help me to create an engaging UX research presentation?
Yes, Miro AI can be helpful when creating UX research presentations, whether it’s summarizing research notes, clustering insights, or drafting insight statements. It can also help structure your boards or presentation flows, making it easier to turn evidence into a focused, engaging narrative.
Author: Danielle Caldas, Organic Growth Manager @ Miro Date: April 17, 2026