Website Development Project
Gantt Chart
Brief
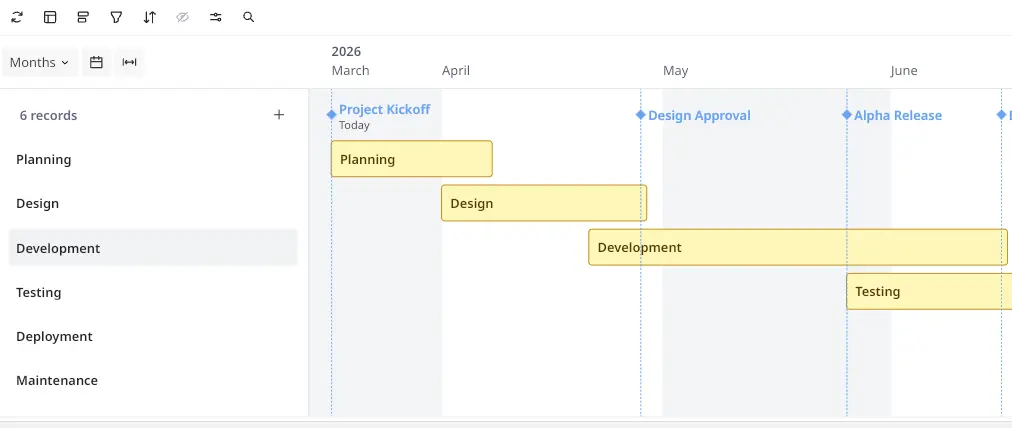
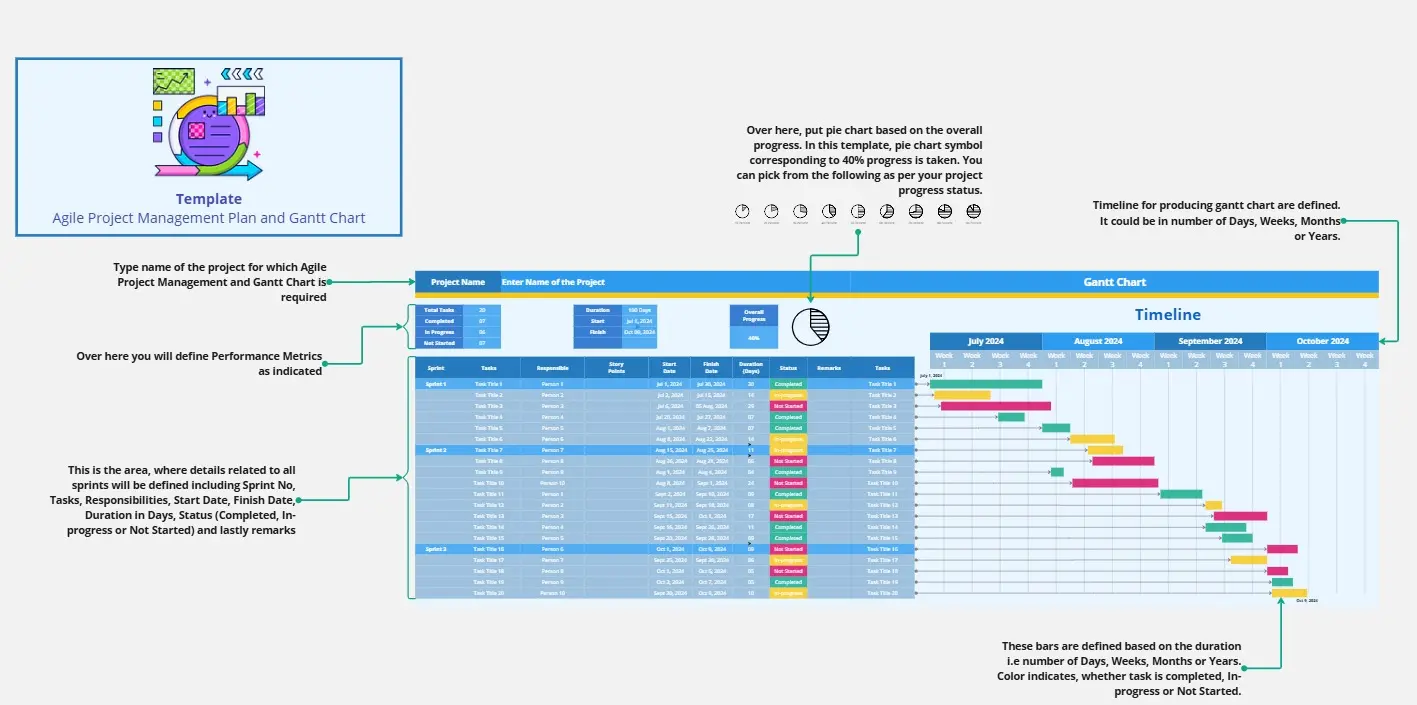
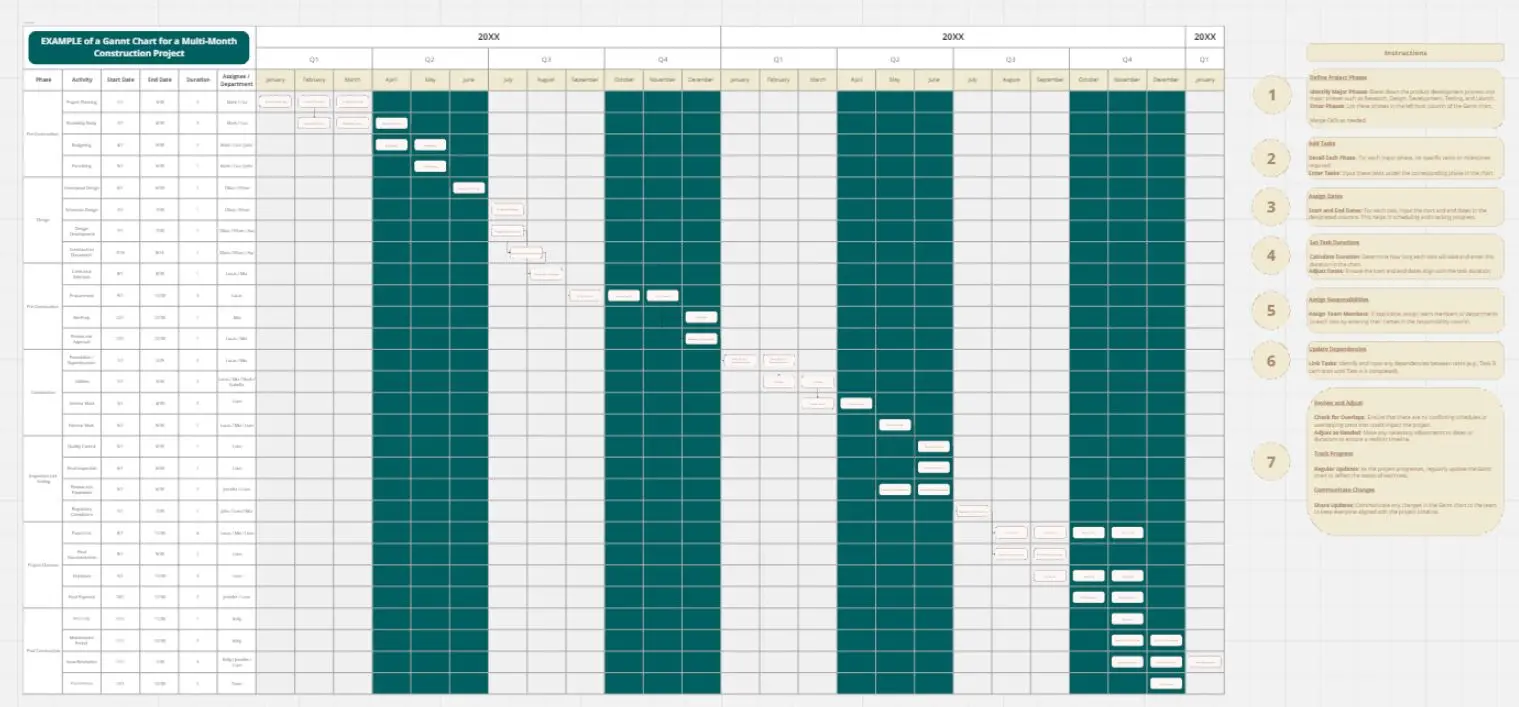
The Website Development Project Gantt Chart is an 8-week visual timeline that maps the complete website development lifecycle — from Project Kickoff & Planning through Post-Launch Monitoring. It covers 13 critical phases including requirements gathering, design, development, testing, and deployment. The template includes fields for Project Manager, Start Date, and End Date, helping teams maintain clear accountability and deadlines throughout the project.
Who Can Use This Template
Ideal for project managers, web development teams, digital agencies, product owners, and IT departments managing end-to-end website builds. Suitable for both small teams and larger cross-functional groups requiring a shared delivery plan and visual progress tracking.
How to Use This Template
Fill in the Project Manager name, Start Date, and End Date at the top of the chart. Adjust the task bars across the 8-week timeline to reflect your actual schedule for each development phase. Use the blank version provided to customize the chart for your specific project needs. Review the reminder note: ensure all deliverables are reviewed before moving to the next phase. Update the chart regularly to track progress and communicate status with stakeholders.
Cheers!
Khawaja Rizwan, MVP