Root Cause Analysis - Fishbone
(Ishikawa) Diagram
Brief
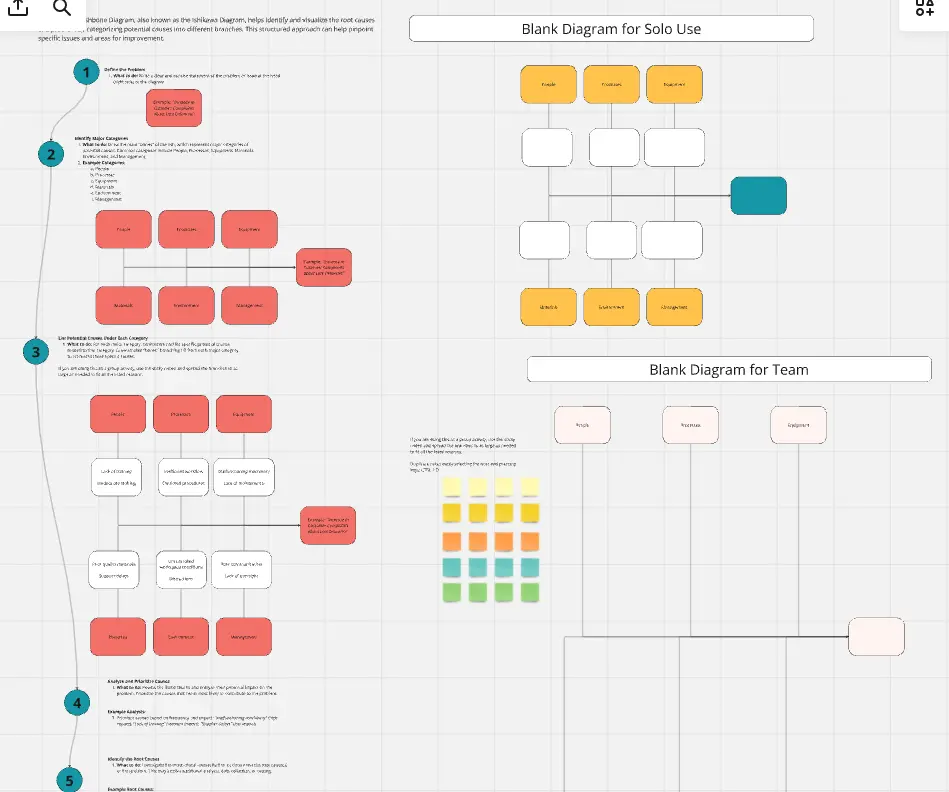
The Fishbone (Ishikawa) Diagram is a visual root cause analysis tool that maps potential causes of a problem across six standard categories, helping teams systematically identify and prioritize root causes rather than treating symptoms. This structured approach ensures comprehensive problem investigation and data-driven decision-making.
Who Can Use It
Operations and logistics teams
Quality assurance professionals
Process improvement specialists
Project managers
Warehouse and supply chain teams
Any cross-functional team investigating recurring problems or performance issues
How to Use It
State the problem clearly in the fish head (rightmost chevron shape)
Use the six category branches — People, Process, Equipment, Materials, Environment, and Measurement — as structured prompts for brainstorming
Add possible causes as nodes branching off each category line
Discuss and mark the most likely root causes as a team (highlight or circle them)
Verify the top 1–2 suspected causes with data before acting
Customize categories to fit your context (e.g., for service teams: Policies, Procedures, People, Place)
About the Example
The example addresses a warehouse team investigating late shipments, with the problem stated as "30% of orders ship later than promised."
Causes are mapped across all six categories:
People: New packers not fully trained, peak-hour understaffing
Process: No cut-off time for same-day picking, orders batched only twice daily
Equipment: One label printer per four stations, scanner batteries dying mid-shift
Materials: Common box sizes out of stock, packing slips printed far from floor
Environment: Aisle congestion, seasonal demand spikes
Measurement: Promise date not synced with stock system, no daily late-order report
Two causes are verified as root causes: "no picking cut-off time" and "promise dates not synced with stock system." The team's next action is to fix both and re-measure the late-shipment rate, demonstrating how the diagram guides teams from broad brainstorming to focused, data-backed action.
Cheers!
Khawaja Rizwan