Operational Efficiency Project
Gantt Chart
Brief
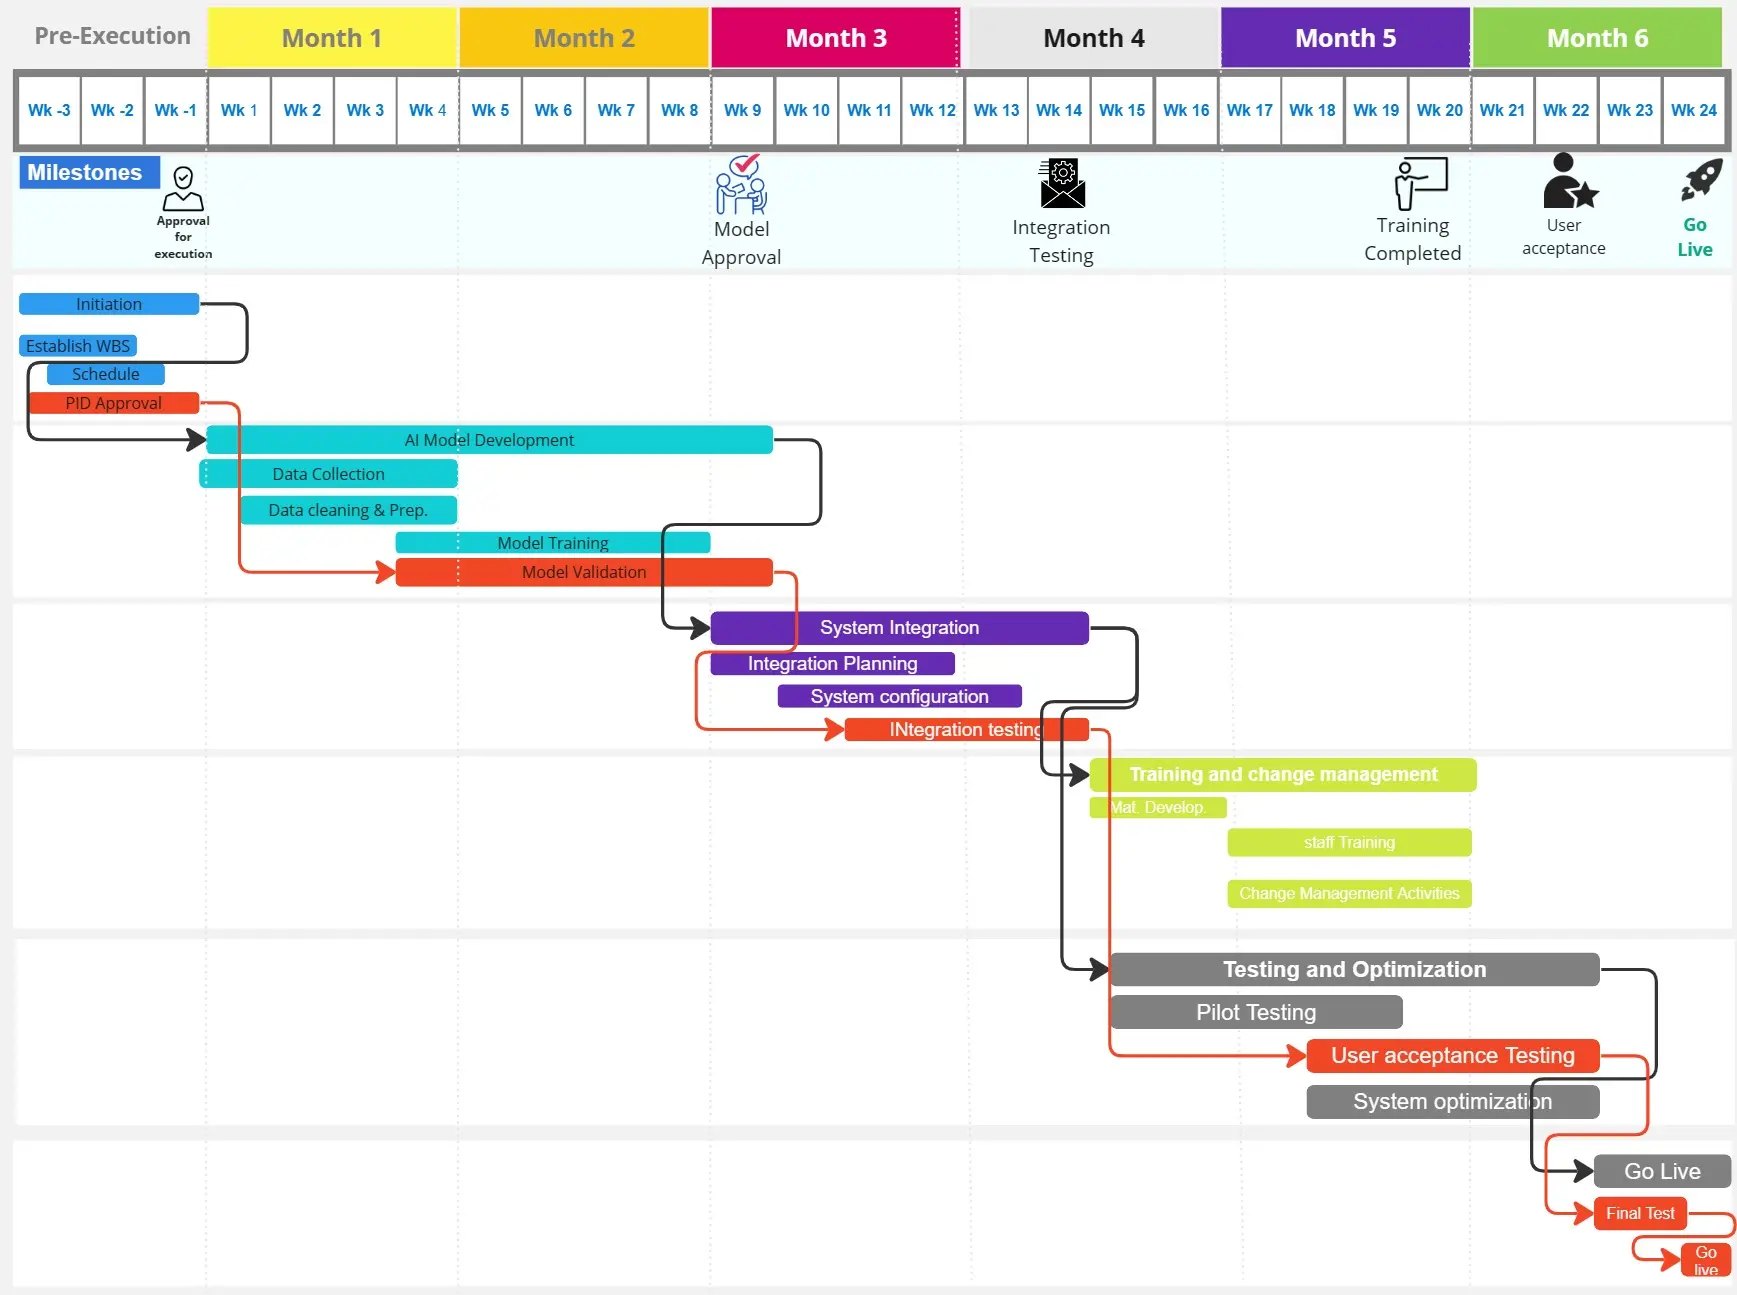
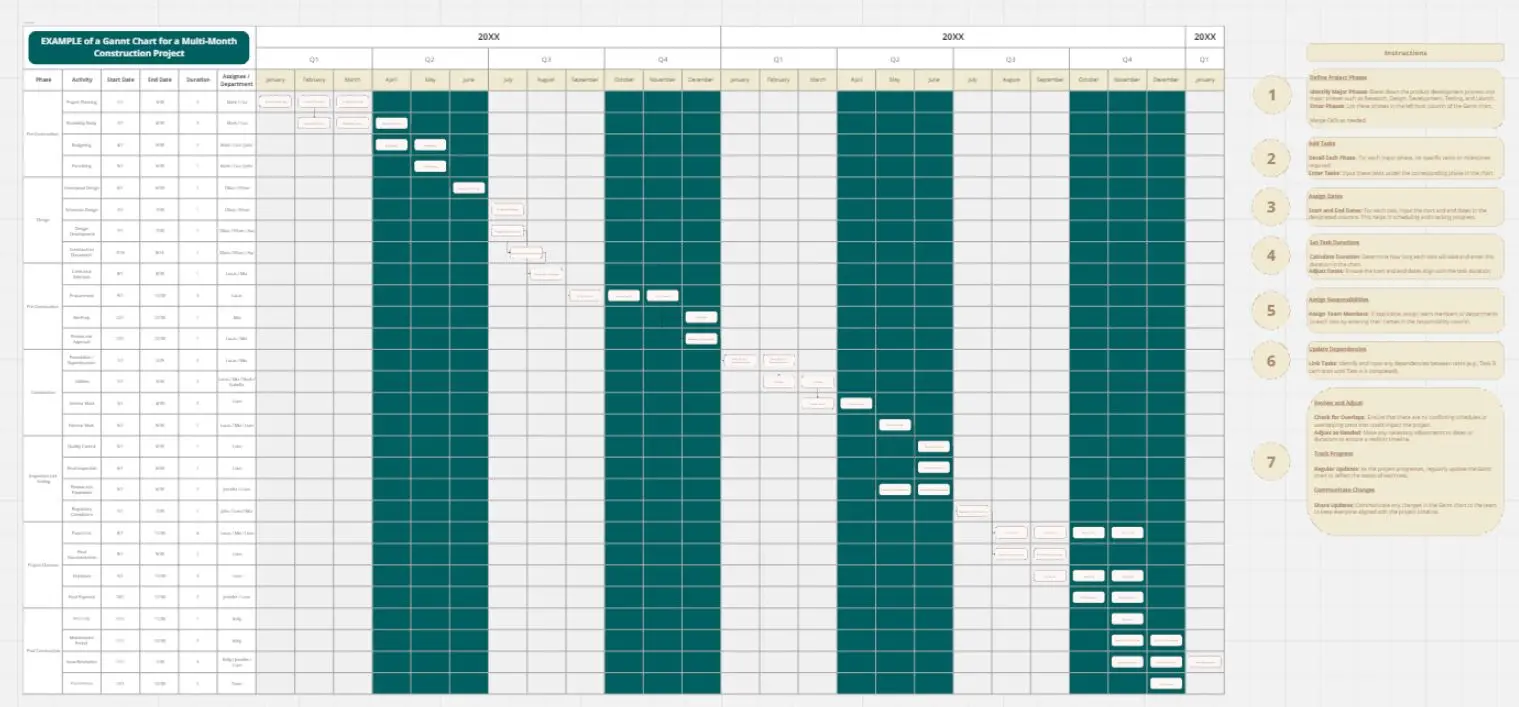
The Operational Efficiency Project Gantt Chart is a visual timeline template for planning and tracking operational efficiency projects. It organizes work into workstreams and tasks mapped across a date range with color-coded status indicators—Done, On-Going, and Upcoming—enabling teams to assess progress at a glance. Milestone markers provide additional checkpoints throughout the timeline.
Who Can Use It
This template is ideal for project managers, operations teams, business analysts, team leads, and anyone managing multi-phase projects who needs a clear visual overview of task sequencing and progress across parallel workstreams.
How to Use It
Replace the [Product Name] placeholder with your project name. Define your workstreams (e.g., Process Mapping, Bottleneck Identification, Strategy Development, Implementation, Monitoring). Add tasks under each workstream. Set timeline dates across the header. Apply color-coded status bars and milestone markers to reflect current progress. Update regularly as the project advances.
About the Example
The example shows a "Software Product Launch" project with five workstreams—Process Mapping, Bottleneck Identification, Strategy Development, Implementation of Changes, and Monitoring and Review—spanning 01 Nov to 28 Nov 2026. Tasks appear at various stages (Done, On-Going, Upcoming), with a "Today" marker at 16 Nov indicating the current date.
Cheers!
Khawaja Rizwan, MVP