0likes
8uses
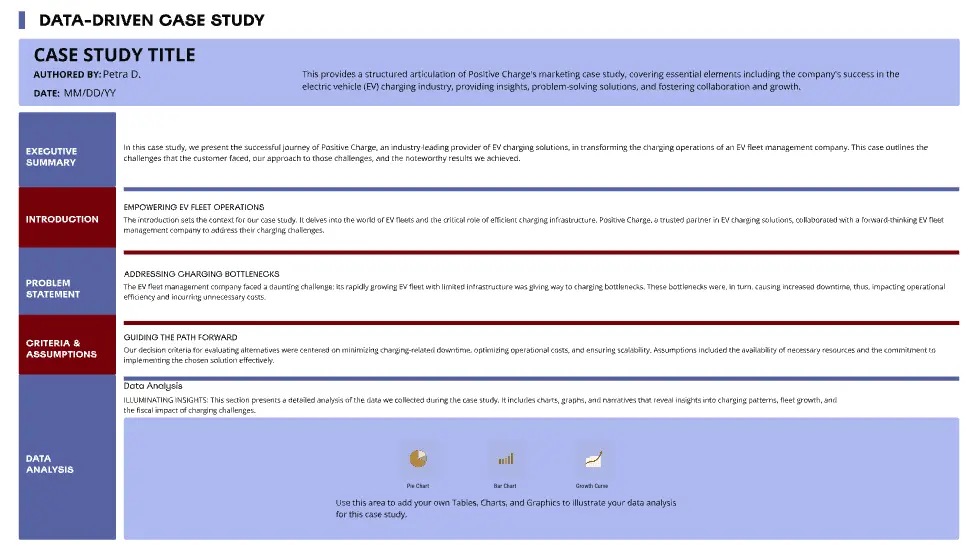
Turn product data into smarter roadmap decisions. This collaborative workshop helps startup founders and product teams analyze performance metrics, evaluate potential features, prioritize initiatives using measurable criteria, and create a strategic product roadmap aligned with customer needs and business goals.
Are your product roadmap priorities supported by meaningful data, or are they driven by opinions and assumptions?
The Data-Driven Roadmap template helps startup founders and product software teams make informed product decisions using customer insights, performance metrics, and structured prioritization.
Product teams often face competing feature requests, limited development capacity, and pressure to deliver improvements quickly. Without a clear evaluation process, deciding what to build next can become a debate over individual preferences rather than customer and business impact.
This workshop introduces a more objective approach to product roadmap planning.
Through collaborative data analysis, opportunity evaluation, and feature prioritization, participants investigate product performance, identify improvement opportunities, and compare initiatives against shared criteria.
The workshop concludes with a visual roadmap that connects product decisions to measurable goals, planned milestones, and development priorities.
Rather than treating data as a report to review after decisions are made, this template helps teams use evidence to shape those decisions from the beginning.
Designed for small teams, this template works for both virtual and in-person workshops.
Startup founders aligning product investments with measurable business outcomes
Product managers making evidence-based roadmap decisions
UX/UI designers identifying opportunities through customer behavior and usability data
Software engineers evaluating product initiatives and implementation considerations
Marketing and sales teams contributing acquisition and conversion insights
Customer success teams identifying engagement and retention challenges
Workshop duration: Flexible; allocate approximately 3 hours for a small-team session.
Recommended participants: 3–8
Facilitator: Product manager, product strategist, startup founder, or product analytics lead
Gather relevant product and customer information.
Useful sources include:
Product usage and engagement analytics
Customer acquisition and conversion data
Feature adoption metrics
Retention and churn information
Customer satisfaction results
Support requests and usability findings
Current product goals and performance indicators
Existing feature requests and planned initiatives
Choose a manageable set of metrics aligned with your product's current goals.
For virtual sessions, use the Miro board, digital sticky notes, scoring tables, and editable roadmap elements.
For in-person sessions, display the board on a shared screen or use printed worksheets, sticky notes, and a whiteboard before transferring final decisions into Miro.
Begin by reviewing your product's objectives and the performance challenges your team wants to address.
Discuss which customer and business outcomes matter most during the current planning period.
Ask participants to identify important product decisions that could benefit from stronger evidence.
Use the introductory section to establish the workshop's focus and capture relevant business goals.
Example: "Our goal is to increase the percentage of new customers who successfully complete their first project."
Discuss what data would help the team understand current performance.
Output: A shared product objective and an agreed set of questions to investigate.
Review the product metrics and customer evidence gathered before the workshop.
Use the board's analysis tables and evaluation areas to organize findings.
Ask participants to identify meaningful patterns, performance gaps, and opportunities.
Look for insights related to:
Customer Acquisition: Are potential customers successfully discovering and signing up for the product?
Activation: Are new customers reaching their first meaningful outcome?
Engagement: Which features and workflows receive consistent use?
Retention: Are customers continuing to receive value over time?
Customer Satisfaction: What feedback indicates positive experiences or recurring frustrations?
Discuss what the available evidence suggests and distinguish observed patterns from possible explanations.
Example: Analytics indicate that many users create an account but never complete their first project.
The team identifies onboarding as a potential improvement opportunity but needs further research to understand why customers stop.
Output: A collection of data-supported product insights, performance gaps, and research questions.
Review the opportunities identified during data analysis.
Ask participants to independently propose features, improvements, or initiatives that could address the observed problems.
Use the evaluation and scoring areas of the template to compare the proposals.
Consider factors such as:
Customer impact
Alignment with product goals
Supporting evidence
Potential business value
Implementation effort
Technical feasibility
Discuss each initiative and record the reasoning behind its evaluation.
Avoid treating estimated benefits as guaranteed outcomes.
Example:
Proposed Initiative: Guided project onboarding
Supporting Insight: Low first-project completion among newly registered customers
Expected Impact: Help more customers reach their first meaningful product outcome
Potential Constraint: Development and usability testing effort
Output: A collection of evaluated product initiatives with documented evidence and expected impact.
Use the prioritization section to compare the evaluated initiatives and determine which deserve attention.
Review each opportunity against your agreed product goals, available data, and development capacity.
Organize initiatives into the priority categories provided on the board:
Must Have
Critical initiatives needed to address significant customer or product requirements.
Should Have
Important improvements that support meaningful outcomes but are not mandatory for the immediate planning period.
Could Have
Potentially valuable improvements that can be pursued when capacity and priorities permit.
Won't Have
Initiatives excluded from the current planning period.
Ask participants to review proposed placements independently before discussing the final categories.
Resolve disagreements by examining the evidence and practical trade-offs.
Example:
Must Have: Resolve a critical onboarding failure.
Should Have: Improve first-project guidance.
Could Have: Add advanced project templates.
Won't Have: Introduce extensive interface customization during the current cycle.
Output: A prioritized collection of product initiatives supported by data, product goals, and team discussion.
Translate the prioritized initiatives into the visual roadmap.
Use the roadmap's milestone sequence to communicate planned product improvements and their expected progression.
For each initiative, capture:
Initiative or feature title
Short description
Target date or planning period
Supporting product insight
Expected outcome
Relevant KPI or success measure
Arrange initiatives chronologically and review the sequence for technical dependencies, team capacity, and strategic alignment.
Example:
Initiative: Guided Project Onboarding
Target: Month / Year
Supporting Data: Low first-project completion
Expected Outcome: Improve customer activation
KPI: Percentage of new accounts completing a first project
Review the completed roadmap and identify any assumptions that require further investigation.
Output: A visual product roadmap connecting prioritized initiatives, planned milestones, and measurable product outcomes.
By completing this template, your team will have:
A shared understanding of the product's current objectives
Organized product performance data and customer insights
Identified opportunities connected to measurable product challenges
A collection of evaluated product features and initiatives
Documented rationale for prioritization decisions
A categorized list of product priorities
A visual roadmap communicating planned initiatives and milestones
Relevant KPIs for tracking product outcomes
A clearer connection between product investments and expected customer or business value
Start with meaningful metrics. Focus on indicators connected to customer outcomes and business objectives rather than reviewing every available product metric.
Give every insight context. A declining metric deserves investigation before the team decides what caused it.
Separate observations from explanations. Product analytics may show where customers stop using a workflow, but customer research can help explain their behavior.
Use consistent evaluation criteria. Compare initiatives against the same measures to keep prioritization discussions focused.
Encourage independent thinking. Ask participants to review evidence and evaluate opportunities before opening the group discussion.
Challenge unsupported impact estimates. When someone predicts a large improvement, ask what data or customer evidence supports the expectation.
Keep the roadmap achievable. Review development capacity and dependencies before assigning target dates.
Avoid prioritizing only what is easiest to measure. Some meaningful customer problems require qualitative research to understand their impact.
Connect milestones to measurable outcomes. A completed feature is a delivery result; improved customer behavior is an outcome worth evaluating.
Review results after implementation. Compare actual product performance against the expected outcomes that informed the roadmap.
The goal isn't to collect more data. It's to use the evidence you have to make better product decisions.
A data-driven product roadmap uses product performance, customer research, and measurable business goals to inform development priorities.
It helps teams explain why particular initiatives deserve investment and how their success will be evaluated.
A traditional roadmap may begin with features requested by stakeholders or planned release dates.
A data-driven roadmap begins by investigating performance, identifying opportunities, and evaluating initiatives using agreed criteria.
The resulting roadmap connects development priorities to supporting evidence and measurable outcomes.
Bring data relevant to your product's current goals.
Examples include activation rates, feature usage, retention, conversion, customer satisfaction, usability findings, and customer feedback.
A smaller set of relevant metrics is more useful than a large collection of unrelated reports.
Use the customer research, prototype testing, early usage insights, and qualitative feedback available to you.
Label weakly supported conclusions as assumptions.
The workshop can help identify the most useful metrics and research activities to introduce next.
No.
You can work with simple reports, exported spreadsheets, survey results, or manually collected feedback.
The focus is on interpreting available evidence and making thoughtful product decisions rather than using sophisticated analytics software.
Begin with the outcome your team wants to improve.
Choose a metric that reflects meaningful progress toward that outcome.
For example, if your objective is to improve onboarding, first-project completion may provide a more useful success indicator than total registrations.
Investigate the difference.
Review the reliability and relevance of the data, consider alternative explanations, and identify what additional research is needed.
Contradictory findings can expose assumptions that deserve attention before development begins.
Document the expected benefit and identify what needs to be validated.
Use customer interviews, prototypes, usability testing, or small product experiments to gather evidence.
Do not treat a lack of existing metrics as proof that an initiative has no potential value.
Use the agreed objectives and the scope of the current planning period.
Must Have initiatives should address critical requirements or significant problems that cannot reasonably be deferred.
Challenge items that are marked critical solely through stakeholder preference.
No.
Expected impact should be considered alongside confidence in the evidence, implementation effort, dependencies, and available capacity.
A promising initiative may require further research before committing substantial development resources.
Review the roadmap when important new information becomes available or during regular product planning cycles.
Reassess initiative priorities when customer behavior, performance metrics, product capabilities, or business objectives change.
Yes.
AI can help summarize anonymized research findings, identify potential patterns, organize evaluation notes, and draft initiative descriptions.
It can support brainstorming and suggest possible success measures.
Review AI-generated interpretations against original data and avoid treating predicted results as established findings.
Track the outcomes associated with the prioritized initiatives.
Compare performance before and after implementation, taking relevant changes in customer behavior and external conditions into account.
Review what worked, what did not, and how the findings should influence future roadmap decisions.
Use the Data-Driven Roadmap when your team needs to connect product performance, customer insights, and development priorities through a structured decision-making process.
The completed roadmap should communicate what your team plans to improve, the evidence informing those decisions, and how progress will be measured.
Understand the data. Challenge assumptions. Prioritize meaningful outcomes.

Deanne Watt
Product Strategy @ MiNDPOPGroup.com
My approach to product is to get to the heart of what drives a company. I am passionate about the entire end-to-end process and making it more efficient, collaborative as well as aligning teams and improving communication. We have built about 200 Miro boards so far that cover ideation, strategy, design, engineering, and even marketing promotion.