Customer Feedback Gantt Chart
Brief
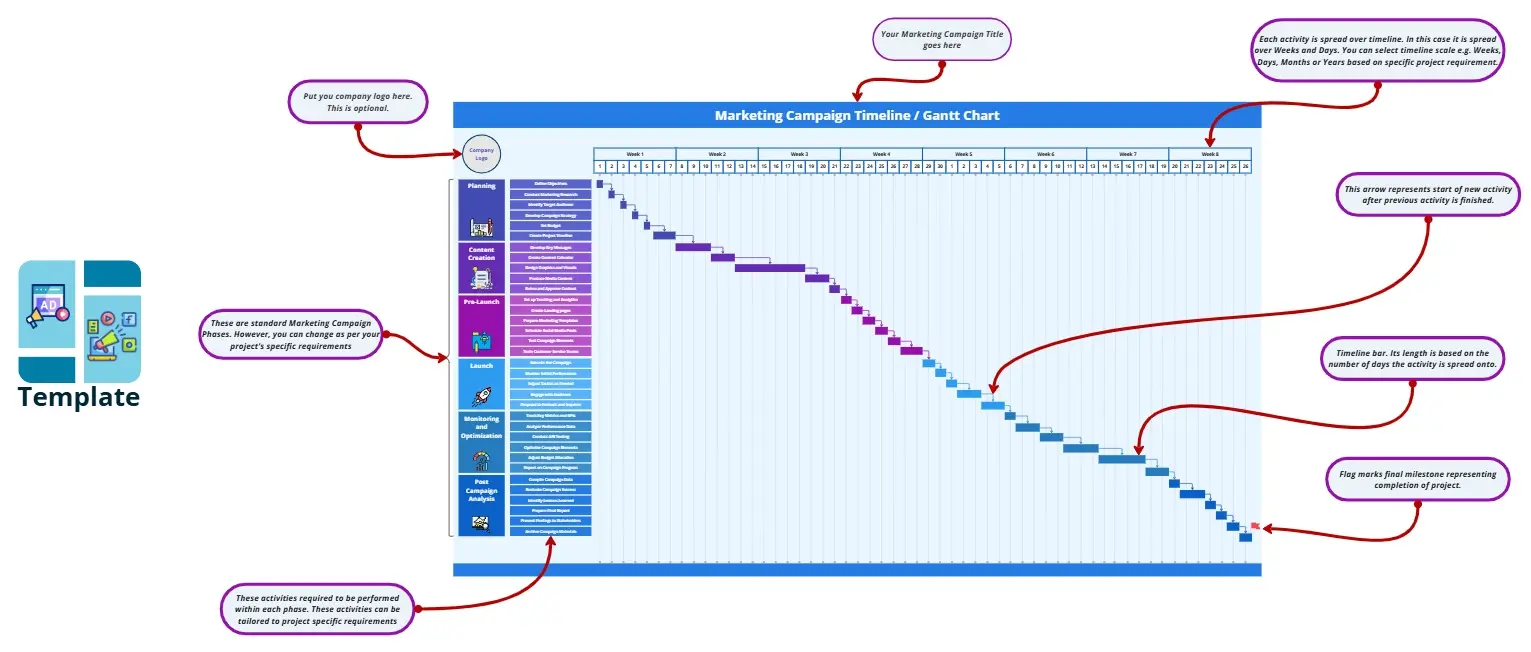
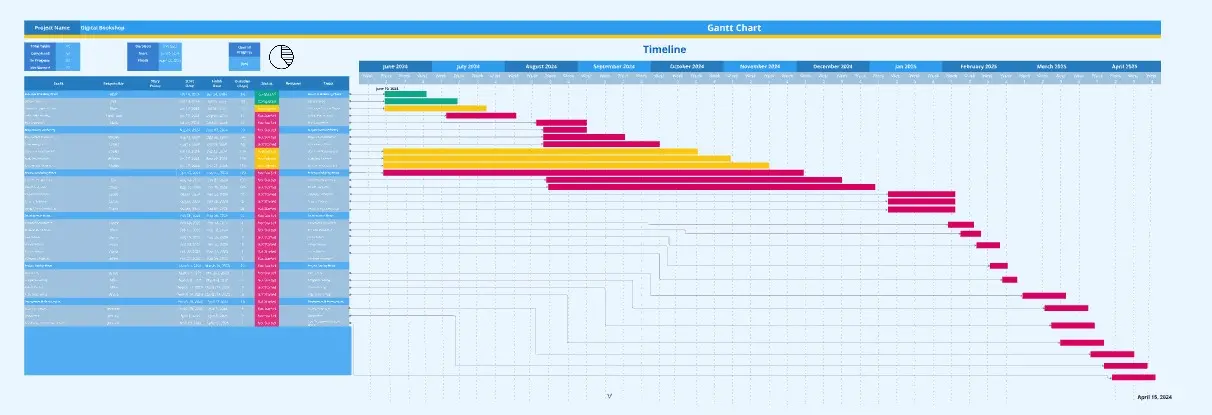
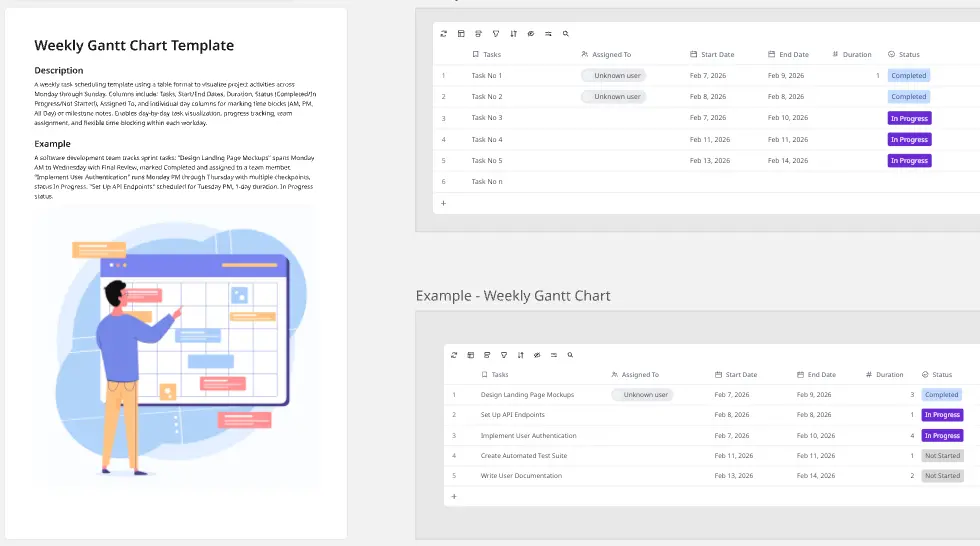
A visual project planning tool displaying tasks, timelines, and dependencies on a horizontal timeline. Helps teams coordinate projects, track progress, manage deadlines, and communicate status.
Who Can Use It
Project Managers, Product Teams, Marketing, Operations, Customer Success, and Agile Teams. Applicable across SaaS, consulting, healthcare, retail, education, and any organization managing time-bound initiatives.
How to Use
Define project phases as labeled rows
Set start/end periods for each phase
Add sub-tasks under phases
Assign owners across the timeline grid
Mark status: Completed, In Progress, or Waiting
Use month columns to visualize duration and overlaps
Monitor the vertical "today" marker for current progress
Customization
Change phase colors to match your workflow
Adjust time scale (weeks, quarters, years)
Add/remove rows as projects evolve
Rename columns with actual dates
Replace owner placeholders with team members
Customize status labels
Add connectors to show task dependencies
Cheers!
Khawaja Rizwan, MVP