Network diagram examples to visualize your network with confidence

Summary
In this guide, you will learn:
- Network diagram templates for platforms like Cisco, AWS, Azure, Google Cloud, and Kubernetes for visualization and planning
- Miro’s pre-made templates include industry-standard icons and notations for accuracy
- AWS Architecture Diagram Template features for visualizing cloud infrastructure like EC2 and S3
- Kubernetes Architecture Diagram Template for mapping clusters, nodes, pods, and services
- Integration capabilities for real-time data and linking with project management tools like Jira and Asana
- Benefit of using Miro’s visual workspace to create clear, organized, and interactive network diagrams
Try Miro now
Join thousands of teams using Miro to do their best work yet.
When it comes to understanding and managing complex networks, a well-crafted network diagram is your best friend. Not only do these diagrams offer a clear, visual representation of network architecture, but they also empower teams to diagnose issues, optimize performance, and plan expansions with confidence. Let's dive into some stellar network diagram templates, and explore how Miro’s innovation workspace can help you create these diagrams effortlessly.
Network diagrams explained
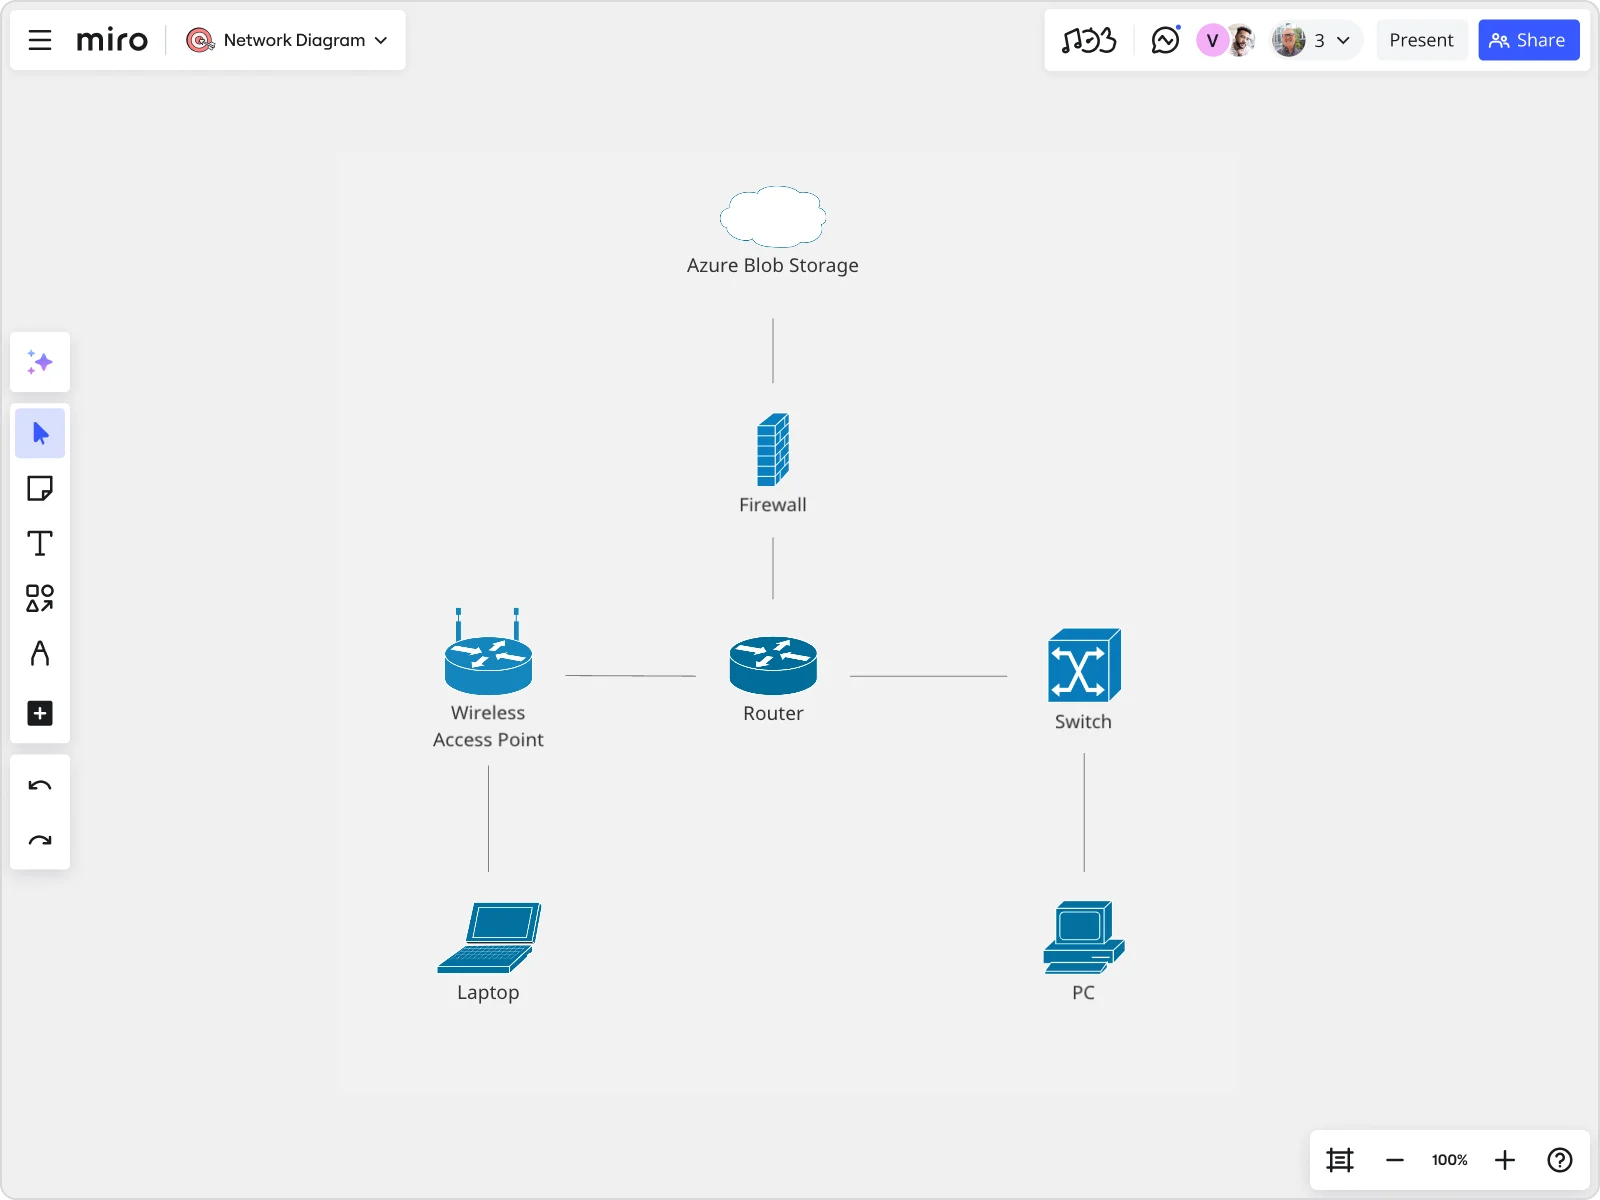
Before we jump into specific templates, let's get a grip on what network diagrams are and why they’re so crucial. Essentially, a network diagram is a visual representation of a computer or telecommunications network. It displays the various components like routers, switches, and devices, along with their interconnections. For product teams, especially developers, these diagrams are invaluable for visualizing network structure, troubleshooting, and strategizing improvements.
Azure Architecture Diagram Template
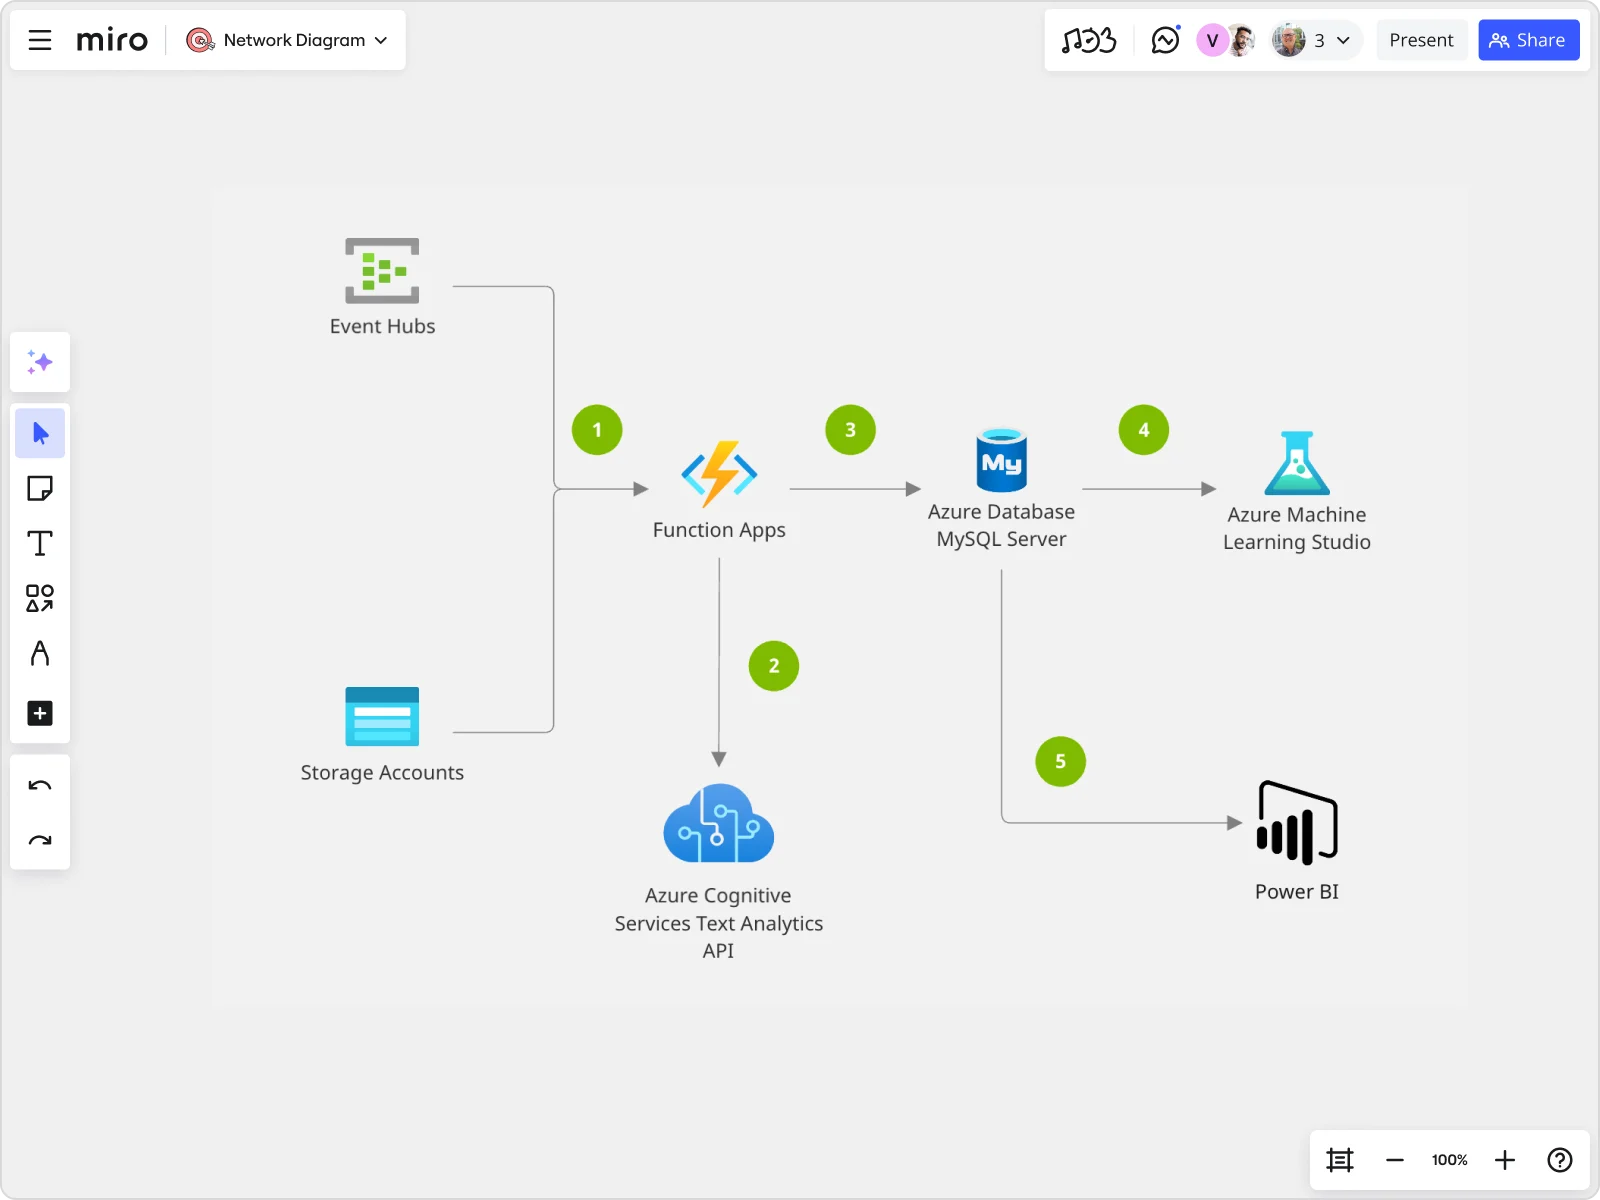
Kicking things off, the Azure Architecture Diagram Template is a must-have for any team leveraging Microsoft’s cloud services. This template showcases a variety of Azure components, from virtual machines to databases, all mapped out in a cohesive, easy-to-understand layout. What’s fantastic about using Miro for this is our advanced diagramming capabilities, which let you drag and drop elements, auto-connect them, and align everything perfectly with smart guides. Plus, our collaborative features mean your team can work together in real-time, no matter where they are.
Cisco Network Diagram Template
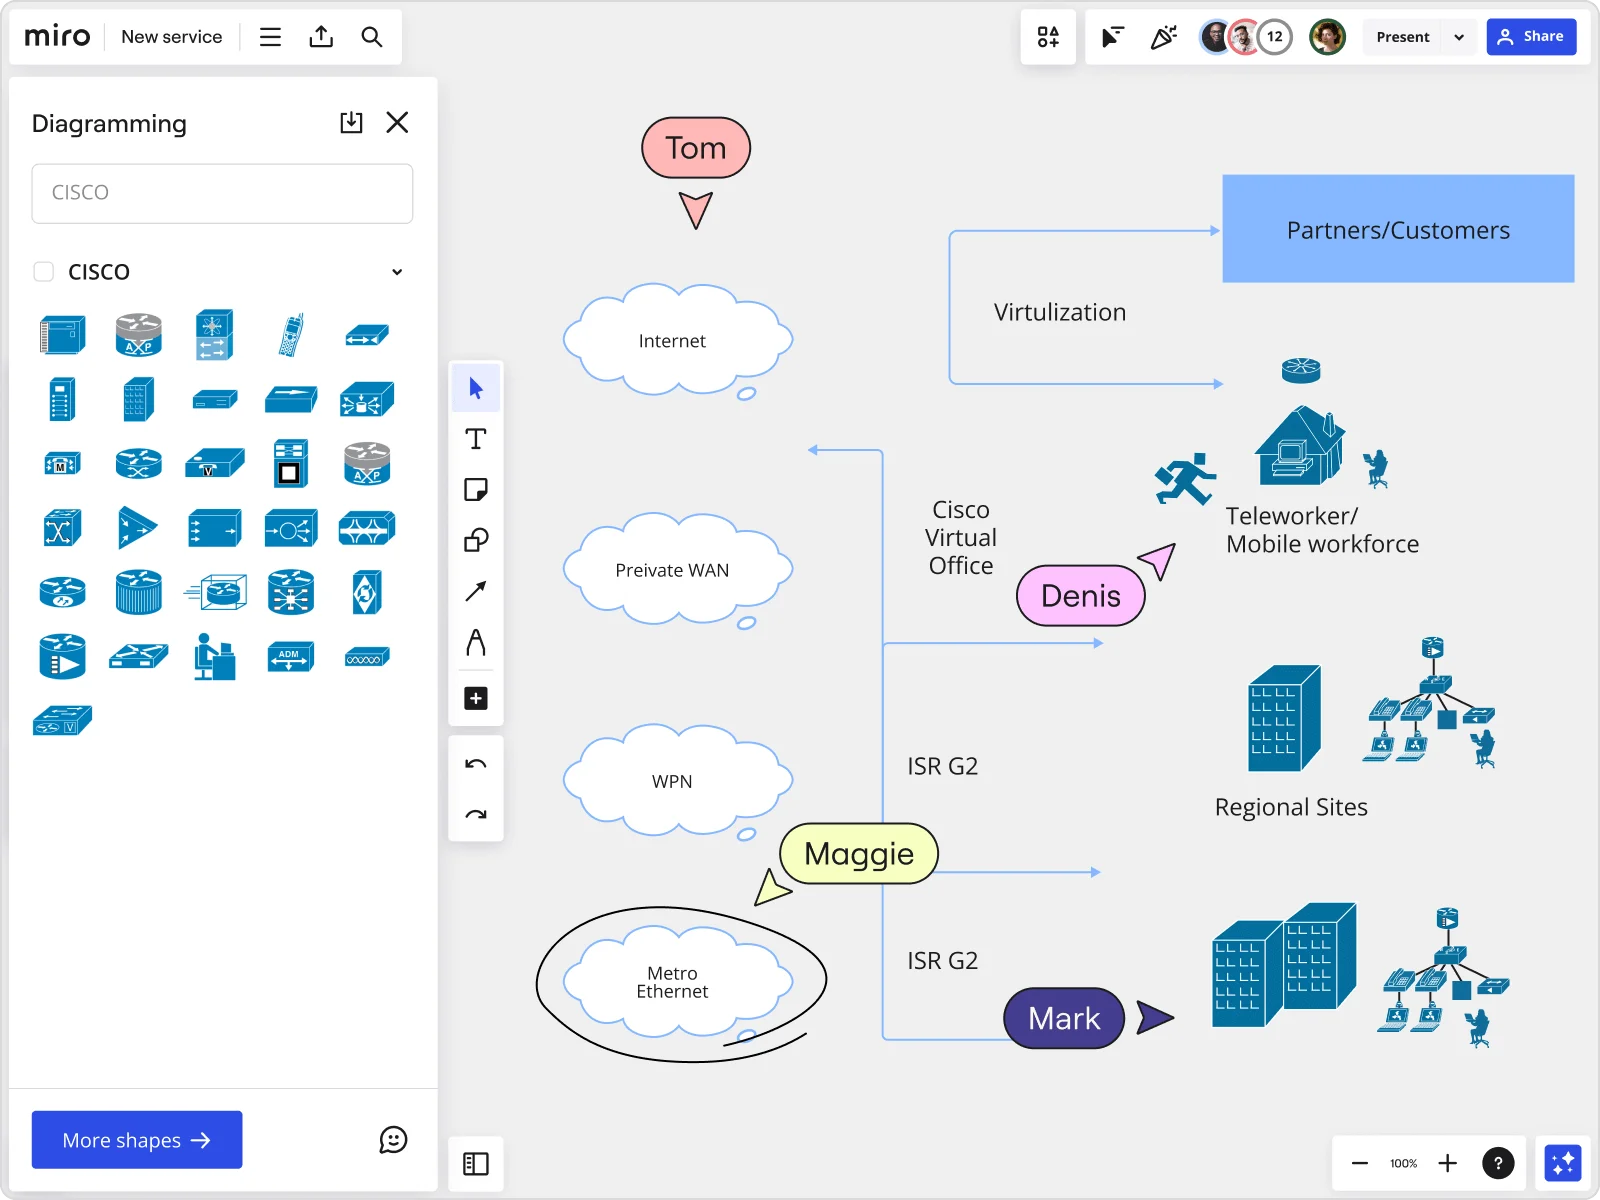
For those working with Cisco products, the Cisco Network Diagram Template is a goldmine. It includes all the standard Cisco icons and notations, making it a breeze to document and plan your network. Miro’s pre-made templates save you tons of time, allowing you to focus on what really matters—optimizing your network. And with our entity relationship modeling tools, you can visualize data models right alongside your network diagram, providing a comprehensive view of your infrastructure.
AWS Architecture Diagram Template
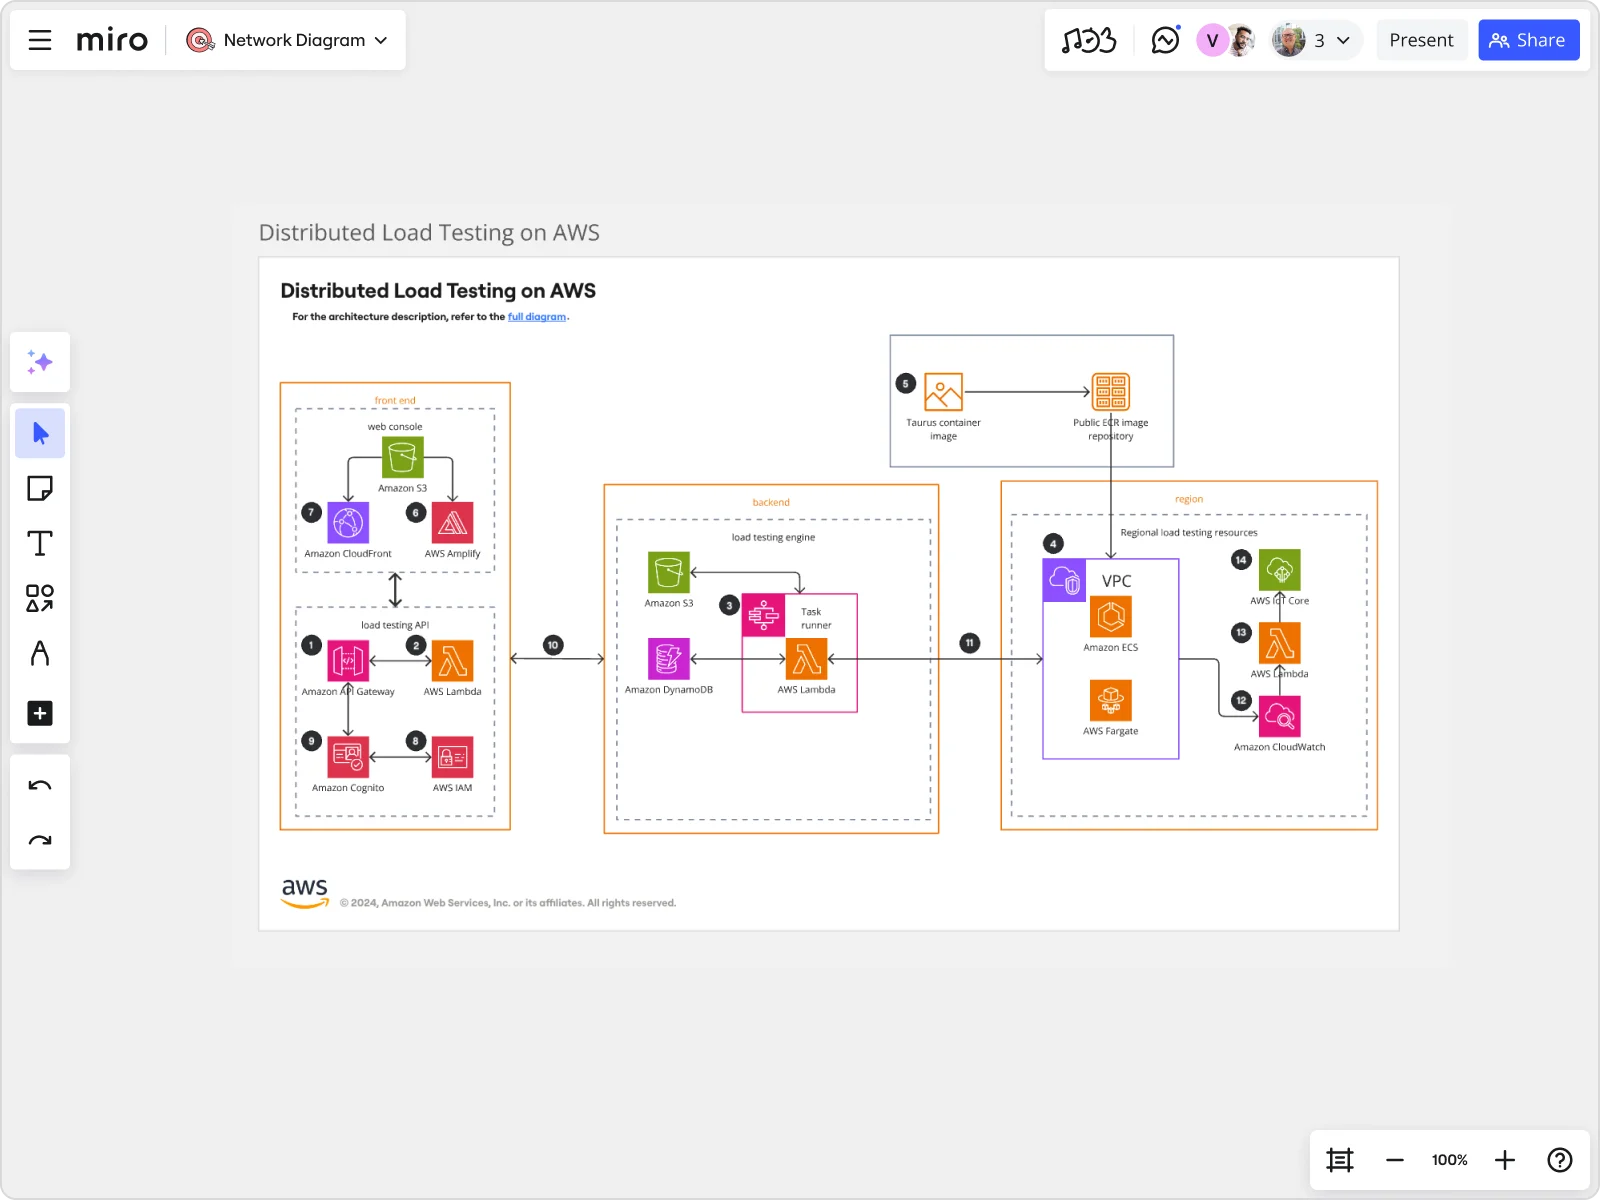
Amazon Web Services (AWS) is a giant in the cloud space, and the AWS Architecture Diagram Template is tailored to help you visualize your AWS infrastructure. This template covers everything from EC2 instances to S3 buckets, laid out in a clean, organized manner. Miro’s visual workspace shines here, offering one-click creation and connection of elements, making it incredibly intuitive to map out your AWS environment. Plus, you can integrate with tools like Jira and Asana, bringing in tasks and issues as interactive cards to keep your projects on track.
Kubernetes Architecture Diagram Template
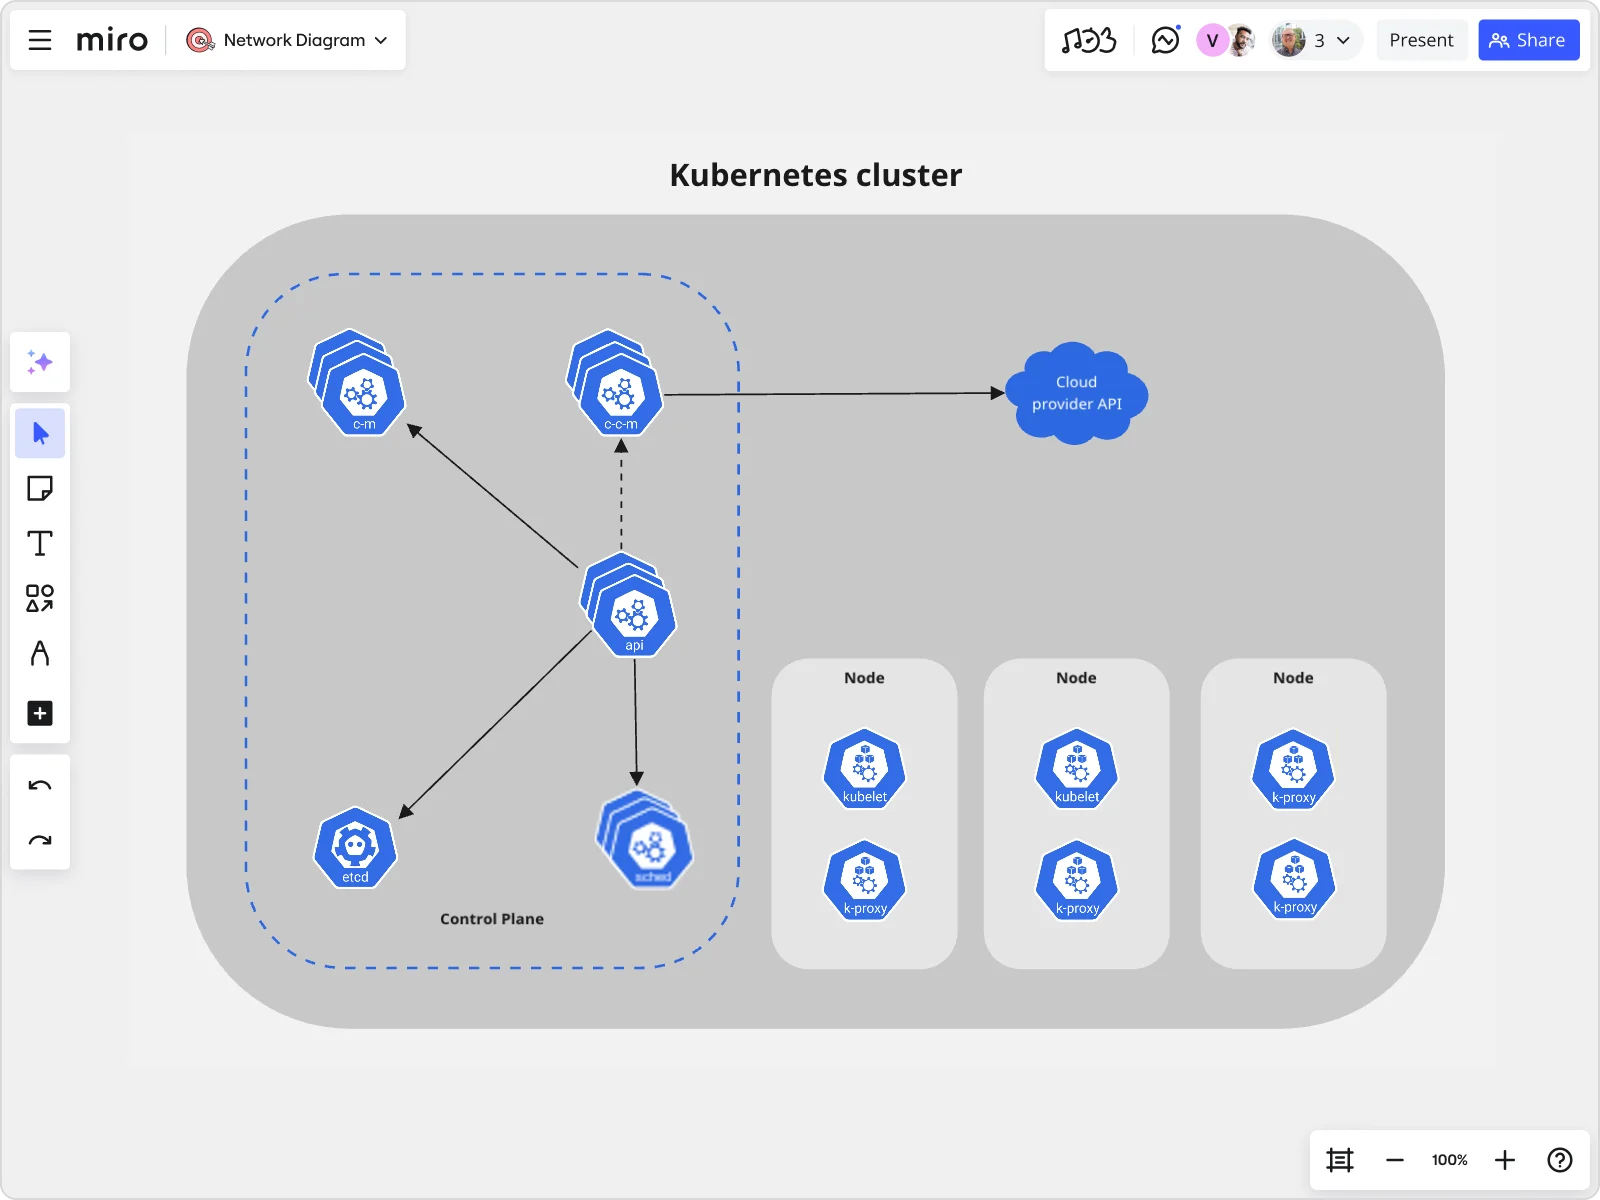
For teams working with containerized applications, the Kubernetes Architecture Diagram Template is a lifesaver. It helps you visualize your Kubernetes clusters, nodes, pods, and services, all within a single, easy-to-navigate diagram. Miro’s keyboard shortcuts and smart guides make the process of creating these diagrams fast and efficient. Plus, with our integration capabilities, you can pull in data from various sources, enriching your diagrams with real-time information.
Data Flow Diagram Template
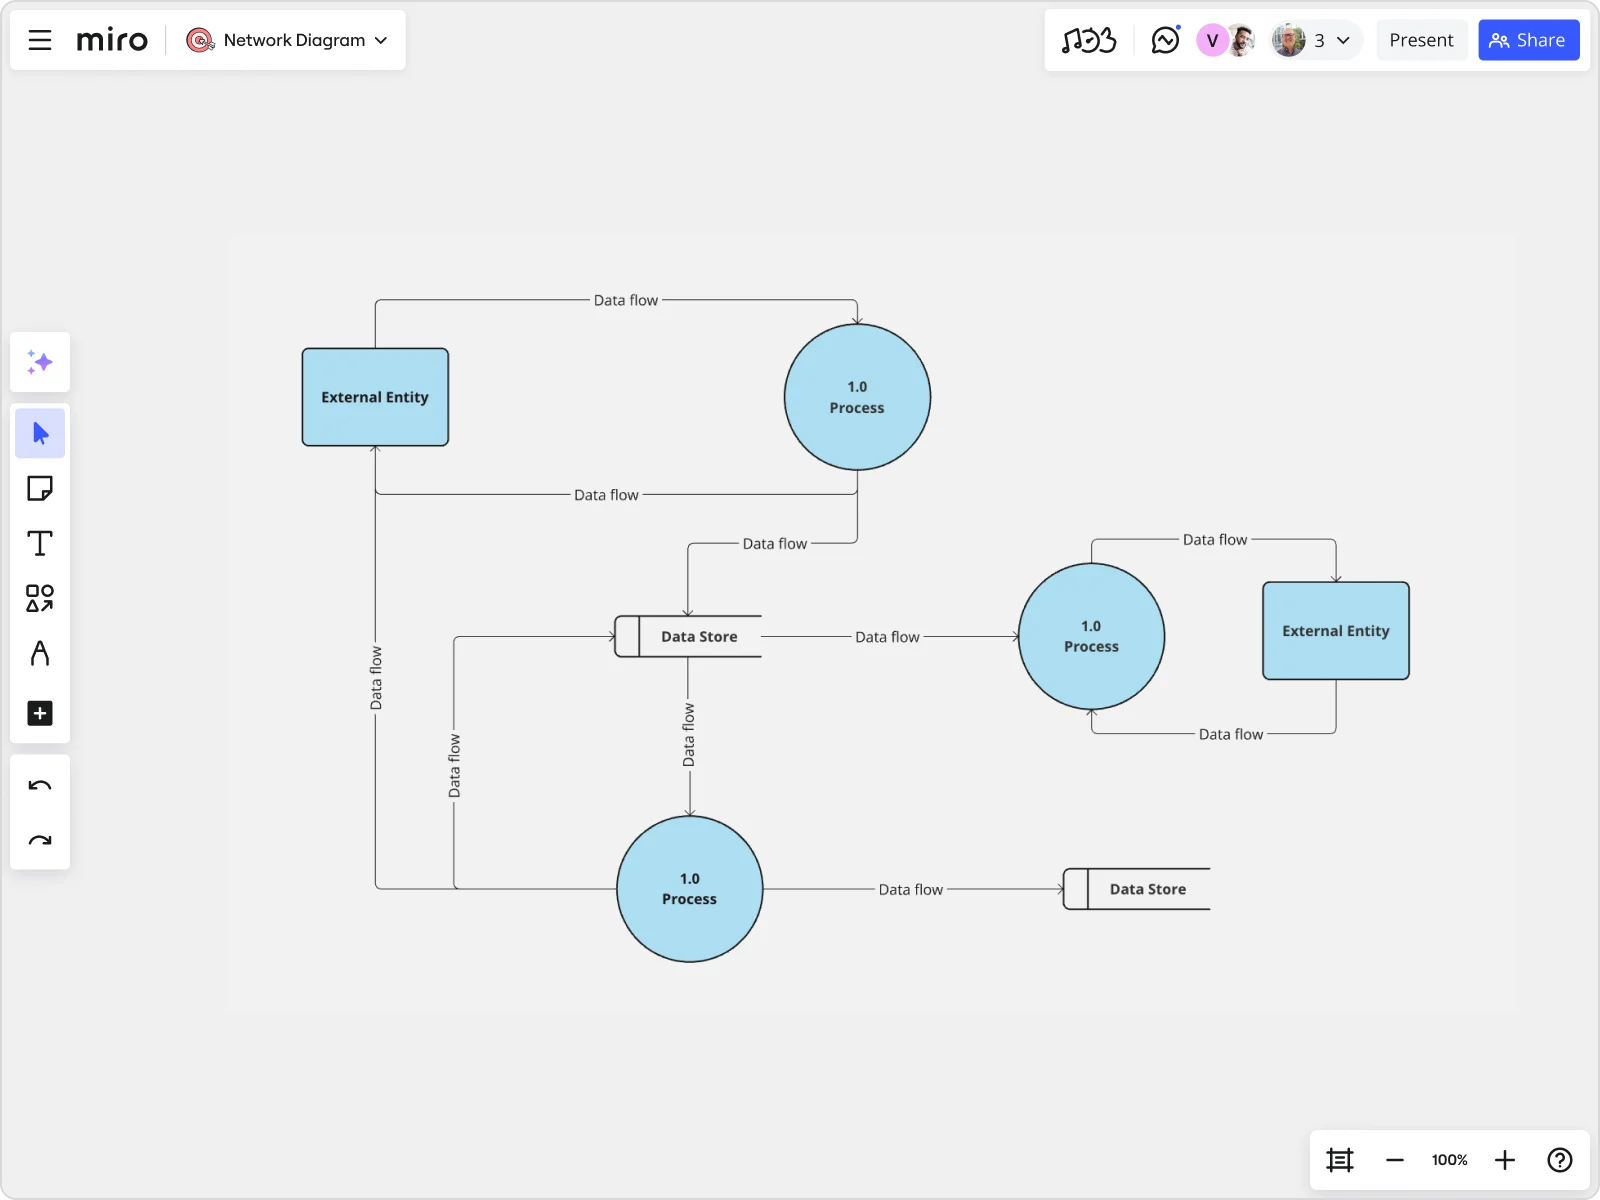
Lastly, the Data Flow Diagram Template is perfect for visualizing how data moves through your system. Whether you’re mapping out data processing, storage, or distribution, this template provides a clear, structured way to see the big picture. Miro’s collaborative features are particularly powerful here, allowing multiple team members to contribute insights and adjustments, ensuring your data flow diagram is both accurate and comprehensive.
Best network diagramming practices
When it comes to creating network diagrams, a few best practices can go a long way:
- Keep it simple: Avoid overcrowding your diagram with too many details. Focus on the key components and their connections.
- Use standard symbols: Stick to industry-standard icons and notations to ensure your diagrams are easily understood by anyone who views them.
- Collaborate: Use Miro’s real-time collaboration features to get input from your team, ensuring your diagram is accurate and comprehensive.
- Regular updates: Networks evolve, and so should your diagrams. Update your diagrams regularly to reflect any changes in your network.
Creating network diagrams doesn’t have to be a daunting task. With Miro’s innovation workspace, you have all the tools you need to create clear, detailed, and collaborative network diagrams. Ready to visualize your network with confidence? Try Miro today and see how our visual workspace can transform your network planning and management.
Author: Miro Team
Last update: October 9, 2025