The ultimate guide to network diagrams
Summary
In this guide, you will learn:
- What a network diagram is: a visual representation of a network's components and their interconnections.
- How to create a network diagram step-by-step: including tool selection, component layout, connections, labeling, and refinement.
- The benefits of using Miro’s network diagram tool: ease of use, collaboration, and access to standard symbols and templates.
- How Miro supports specialized network diagrams: dedicated shape packs, templates, and real-time collaboration for AWS and Cisco.
- Tips for enhancing network diagrams: using symbols, color coding, and layering for clarity and complexity management.
- The importance of network diagrams: for troubleshooting, security, compliance, and team alignment.
Collaborative AI Workflows
Join thousands of teams using Miro to build the right thing, faster.
Network diagrams are great tools for explaining how computers – or any telecom network – run. But what exactly is a network diagram for? Who uses it and how can you go about creating one? We’ve put this quick guide together to cover everything you need to know about network diagramming, including our answers to these questions and more.
Let’s jump right in.
What is a network diagram?
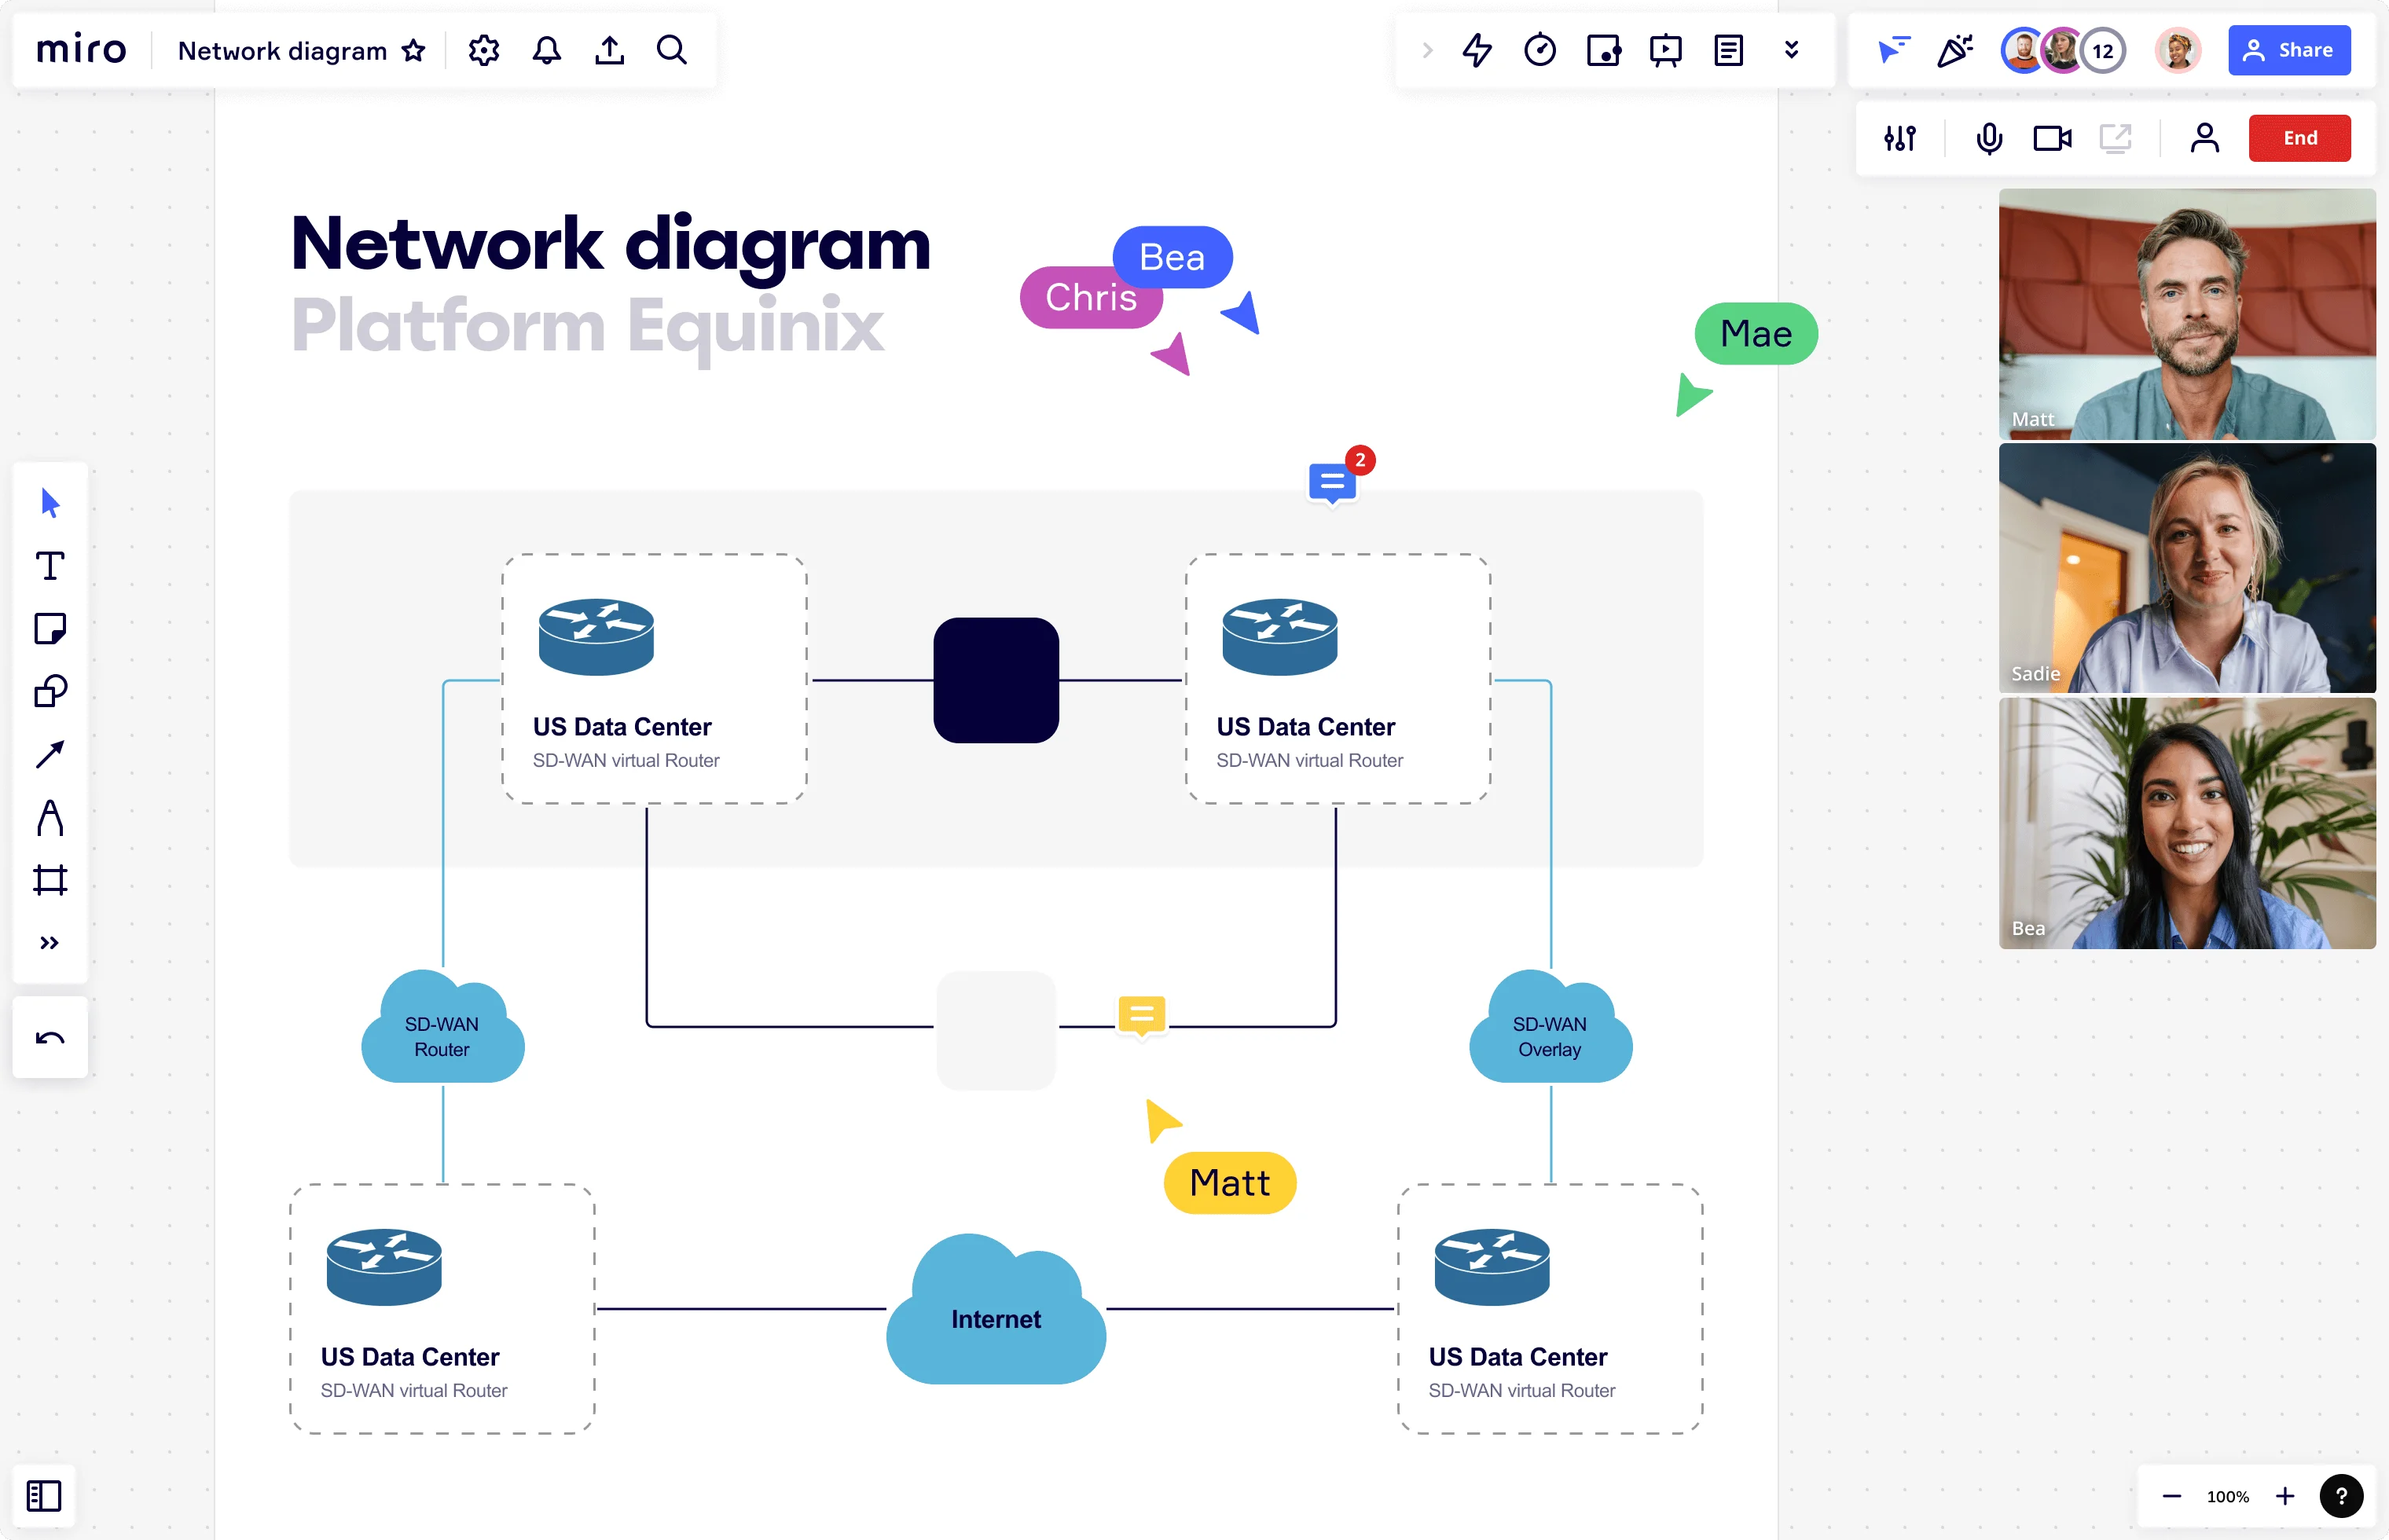
A network diagram is a visual representation of your computer activity network. It’s essentially a chart with a series of symbols and icons representing different elements of your network, allowing you to understand how it’s structured and how it works.
Network diagrams are mainly useful for IT professionals, network admins, and system architects who design, manage, and troubleshoot computer and telecom networks. That said, they can also be helpful for business analysts or even for project managers.
Depending on your goal, a network diagram can be very detailed or just provide a big-picture overview. For example, if you're setting up a new network, you might start with just the basics. As your business grows, your diagrams get more detailed to keep your tech in line with your needs.
Using a data flow visualization tool, you’ll be able to spot all the connections in your network and find areas to improve — like fixing issues, optimizing structures, and meeting compliance requirements.
Network diagrams for project management
Network diagrams are traditionally used by IT teams and developers to outline system architecture — but did you know project managers use them too?
Project managers use these diagrams to outline project activities and identify relationships between tasks. Everything is mapped out in a clear structure and chronological order, showing dependencies and allowing project managers to visualize the project timeline.
In the early stages, project diagrams are usually top-level, focusing on key deliverables and milestones. As the project progresses, the diagram gets fleshed out with more details, such as dependencies, additional tasks, and deadlines.
Why is a network diagram important?
Network diagrams are incredibly useful tools for both IT and project teams. Developers can use them to outline their network structure, while project managers can map their project scope and track progress. Here’s a closer look at some of the key benefits:
Visualize your entire network
A network diagram lets you see your entire network architecture at a glance. This helps IT managers and developers plan, organize, and control the system's structure more effectively.
Pinpoint dependencies
By highlighting dependencies, network diagrams help you understand your system or project better. You can spot potential roadblocks early and take preventative measures.
Identify improvements
Network diagrams reveal areas for improvement. For developers, this means ensuring the system functions correctly. For project managers, it ensures the project runs smoothly. If you’ve missed something, the diagram will bring it to light.
Align cross-functional teams
Create and share a network diagram to get everyone on the same page. Anyone from any department can review it and understand the software or project’s current state.
Update stakeholders
Sharing your network diagram is a great way to keep key stakeholders informed. They don’t need to be technical experts to grasp the diagram, as long as they understand the basic symbols and icons — which we’ll look at more closely later.
TIP: Miro makes it easy to share your network diagram, whether you want to invite others to view and comment on your board, generate a URL, or export it as a PDF — among plenty of other meaningful ways to get feedback and collaborate in Miro.
Types of network diagrams
If you're wondering how many types of network diagrams there are, the best thing to note is that they typically fall into two main categories: physical and logical.
Physical network diagrams
A physical diagram outlines the relationship between actual devices, showing how network devices are physically connected with wires and cables. It’s best to use a physical diagram when you need to improve the physical structure of your network — allowing you to visualize hardware setups and make it easier to plan and troubleshoot physical connections.
Logical network diagrams
A logical diagram focuses on the logical aspects of a network, like how communication flows between different devices. Logical diagrams typically outline routers, subnets, firewalls, and other routing protocols.
You’ll typically use a logical diagram when you need to streamline communication and information flow within your network. It helps you understand how data moves through the system, which helps with network design and optimization.
How do you read a network diagram?
Reading a network diagram involves understanding the symbols and connections that represent various elements within the network. While we’ll look at common symbols in the next section, here's a guide to help you interpret a network diagram:
1. Recognize the layout
Network diagrams often follow specific layouts, sometimes based on network topologies like star, bus, or ring. Recognizing these patterns helps you understand the overall structure. For example: • Star layout: All nodes connect to a central hub. • Ring layout: Nodes form a circular path. • Mesh layout: Nodes interconnect in a web-like structure.
2. Follow the connections
Trace the lines connecting the symbols to understand how data flows through the network. Lines might represent different types of connections, like Ethernet cables, fiber optics, or wireless links.
3. Understand the labels
Labels provide important information about each element. Look for details like IP addresses, device names, and connection types. This information helps you identify specific components and their roles within the network.
4. Analyze the flow
Consider how data moves through the network. Identify starting points, paths, and endpoints to understand data flow and potential bottlenecks or vulnerabilities.
Network diagram symbols and icons
When mapping your system architecture, every diagram is made up of standardized network diagram icons. Whether you’re a seasoned developer or a newbie, these symbols help you understand the network and how it works.
Some of the most common symbols include:
• Cloud: Represents internet-based resources. • Firewall: Indicates security measures protecting the network. • Terminal: Depicts end-user devices like computers or workstations. • ADSL/DSL: Shows broadband connections. • Server: Illustrates servers hosting applications or data. • Router: Indicates devices routing data between networks. • Signal: Represents wireless connections
These icons may look different depending on how they are represented by different providers. For example, Cisco, AWS, and Azure all use icons to represent the various components that make up their systems.
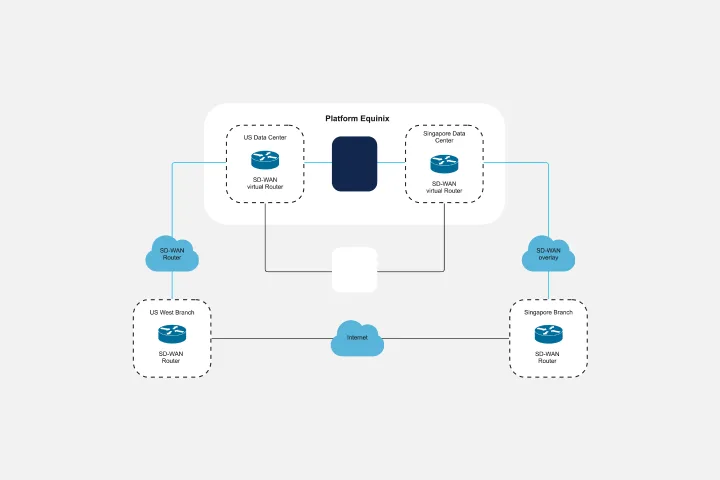
Example of a network diagram
Understanding how network diagrams are structured can be much easier with a real-world example. Let's take Cisco, for example. Cisco is known for its expertise in digital communications and networking. Their solutions are used worldwide, making them a reliable benchmark for network design.
Cisco's network diagrams are great because they include advanced automation, real-time visibility, and strong security measures. These features are essential for designing efficient and secure networks.
You can see this in action with Miro’s Cisco Data Network Diagram Template. This customizable template helps businesses design and showcase their Cisco network setup using a library of icons. It allows network engineers and designers to visualize networks clearly, spot inefficiencies, and find areas for improvement.
How to create a network diagram
Want to learn how to draw a network diagram? Follow these steps to get started:
1. Choose the right tool
Picking the right network diagram tool can make all the difference. Look for a platform that's intuitive, easy to use, and supports team collaboration.
Miro, for example, comes with advanced tools to help you create engaging diagrams and powerful collaboration features to support both async and real-time work — all while offering an intuitive interface. We also offer plenty of network diagram templates to help you kickstart projects.
2. Use the right format
With your tool ready, decide whether you need a physical or logical network diagram. Remember — a physical diagram helps show the actual connections (like cables and devices), while a logical diagram focuses on how information flows through the network (like data movement and routing).
3. Add network components
Now, start adding the components of your network. Familiarize yourself with the standardized symbols and plot the different elements of your network architecture, such as servers, routers, and switches.

4. Name the components
Label each symbol to clarify what it represents. Adding text labels helps specify the exact equipment, like specific routers or wireless access points, making your diagram clearer and easier to understand.
5. Structure your diagram
Make sure your diagram is well-structured by drawing connection lines and arrows between the components. These lines should clearly show how the network elements are connected and how information flows. Try not to cross lines unless necessary, and consider using different colors to represent various types of relationships, like green for bidirectional flow and red for unidirectional flow.
Create your network diagram in Miro
Ready to create your network diagram? Miro is the perfect place to get started.
Between our intuitive interface, customizable templates, and wide range of seamless collaboration features, you’ll have everything you need to create a compelling and detailed network diagram. But why not see for yourself?
Sign up for Miro to take your diagramming experience to a new level.
Author: Miro Team
Last update: October 9, 2025