Data migration process flow diagrams for streamlining transitions

Understanding data migration process flow diagrams
Data migration is a crucial process that involves transferring data from one system or environment to another. To ensure a smooth and successful transition, a well-structured process is essential.
One valuable tool in this process is a data migration process flow diagram. This article will explore the significance of using such a diagram and how it can streamline transitions and ensure efficient data transfers.
Key elements and components of the diagram
A data migration process flow diagram is a visual representation that illustrates the sequence and dependencies of various steps involved in the data migration process.
This diagram serves as a blueprint, guiding the migration process and working as a tool for data flow visualization. A data migration process flow diagram typically includes the following elements:
• Data sources: Identify the origin of the data and its existing format or structure.
• Data transformation: Illustrate any necessary data transformations or conversions during the migration.
• Mapping: Show the mapping between source and target data elements.
• Validation: Represent data validation and quality checks at each stage.
• Error handling: Outline procedures for identifying and addressing errors or discrepancies.
• Destination: Depict the final destination of the migrated data.
Now that you can better understand what makes up the data migration process flow diagram, we can look at the topic in more detail.
Benefits of a data migration process flow diagram
A data migration process flow diagram provides a comprehensive overview of the entire migration journey, highlighting key stages, data sources, transformations, and destinations, and offers several benefits that we will dive into.
Streamlining the migration process
The diagram provides a visual representation of the entire migration journey, allowing stakeholders to identify and optimize the flow of data.
Identifying potential bottlenecks and risks
By visualizing the process, potential bottlenecks or risks can be proactively addressed, minimizing potential disruptions.
Ensuring data integrity and accuracy
The diagram facilitates better data management by emphasizing data validation and quality checks, ensuring the integrity and accuracy of the migrated data.
Enhancing collaboration and communication
A process flow diagram serves as a common reference point, promoting effective communication and collaboration among teams involved in the migration process. You can use a data flow template or a basic flowchart template to get started faster.
Creating a data migration process flow diagram
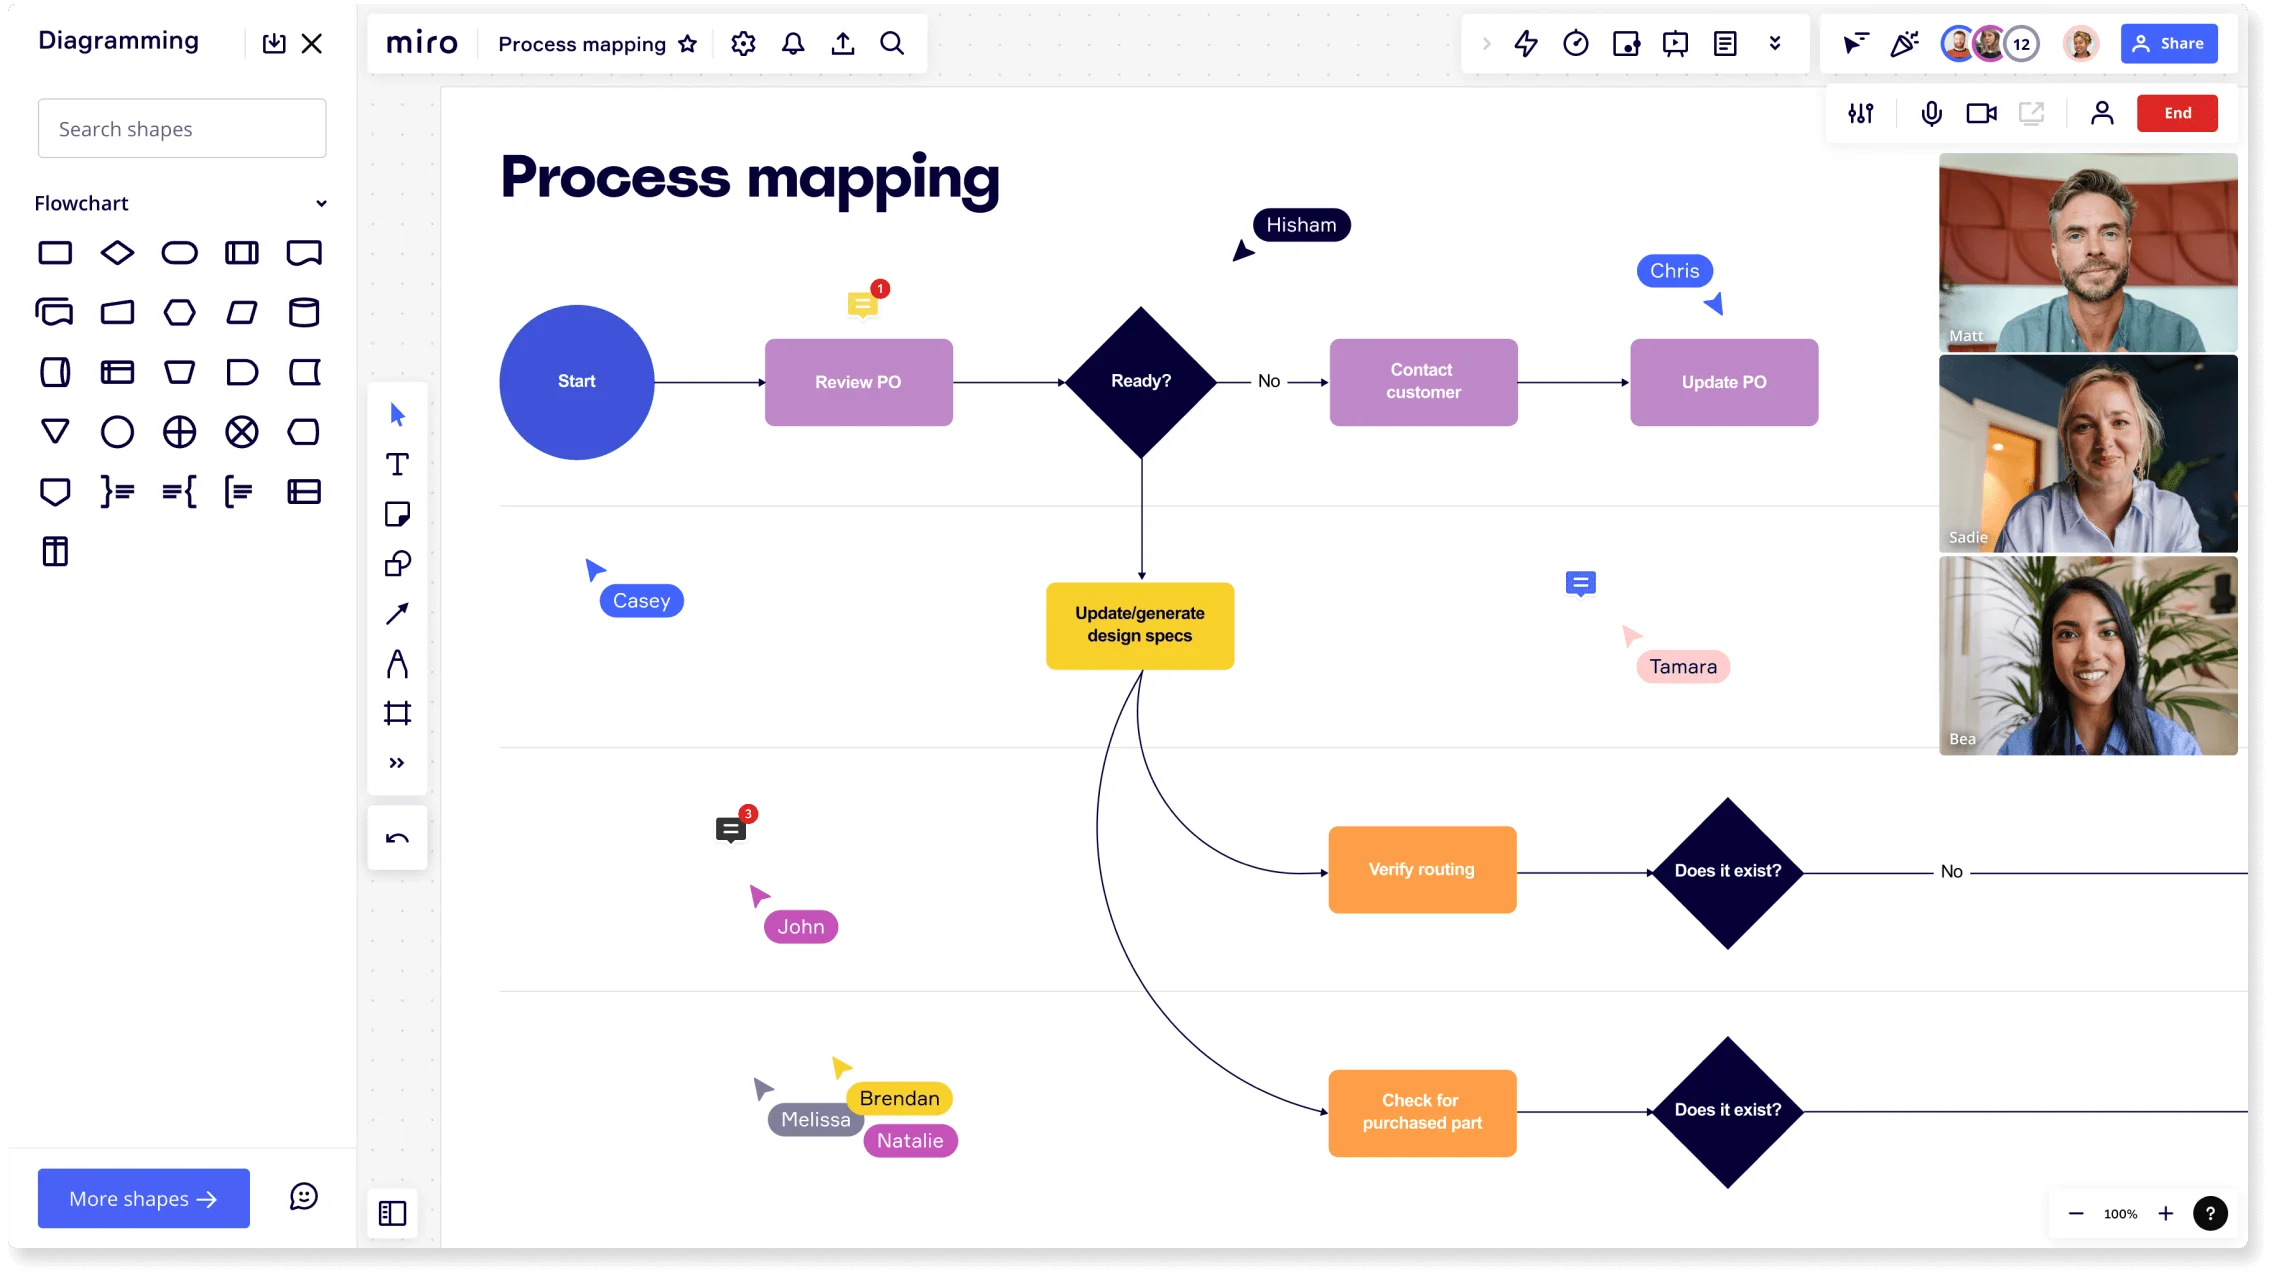
You can use Miro to create your data migration process flow diagram and collaborate with your team throughout the design process. To create an effective data migration process flow diagram, follow these steps:
1. Identify goals and objectives
Determine the specific goals and objectives of the migration project. List core functionalities or data elements you plan to include in the low-fidelity prototype.
2. Define method and resources
Consider the type of users, feedback mechanisms, and available tools and resources to tailor the level of detail in your diagram.
3. Utilize Miro's flowchart maker:
Leverage Miro's flowchart maker template to create your data migration process flow diagram. Customize it to suit your specific needs.
4. Map data sources and transformations:
Clearly visualize the source and target data elements, along with any necessary transformations or conversions.
5. Incorporate error handling and contingency plans:
Include steps and mechanisms for error handling, data validation, and contingency plans to ensure a robust migration process.
Implementing and optimizing data migration
Once the data migration process flow diagram is created, follow these steps to implement and optimize the migration process:
1. Guided by the diagram:
Use the process flow diagram as a guiding framework during the migration. Ensure that the actual data transfer aligns with the depicted flow.
2. Conduct test runs and validation:
Execute test runs to validate the accuracy and integrity of the migrated data. Adjust the diagram as needed based on the insights gained.
3. Continuous monitoring and refinement:
Monitor the migration process and refine the diagram iteratively to improve efficiency and address any unforeseen challenges.
Conclusion
A data migration process flow diagram is a powerful tool for streamlining transitions and ensuring efficient data transfers. By visually representing the migration journey, it enables stakeholders to identify potential bottlenecks, maintain data integrity, and enhance collaboration.
Utilizing Miro's diagram maker, you can create comprehensive process flow diagrams that guide and optimize the data migration process. Embrace the benefits of this valuable tool to achieve successful and seamless data migrations.