Stakeholder Mapping Template
Identify and map out the people involved in a project with the stakeholder map template. Easily get buy-in and accomplish your goals.
Trusted by 65M+ users and leading companies


About the Stakeholder Mapping Template
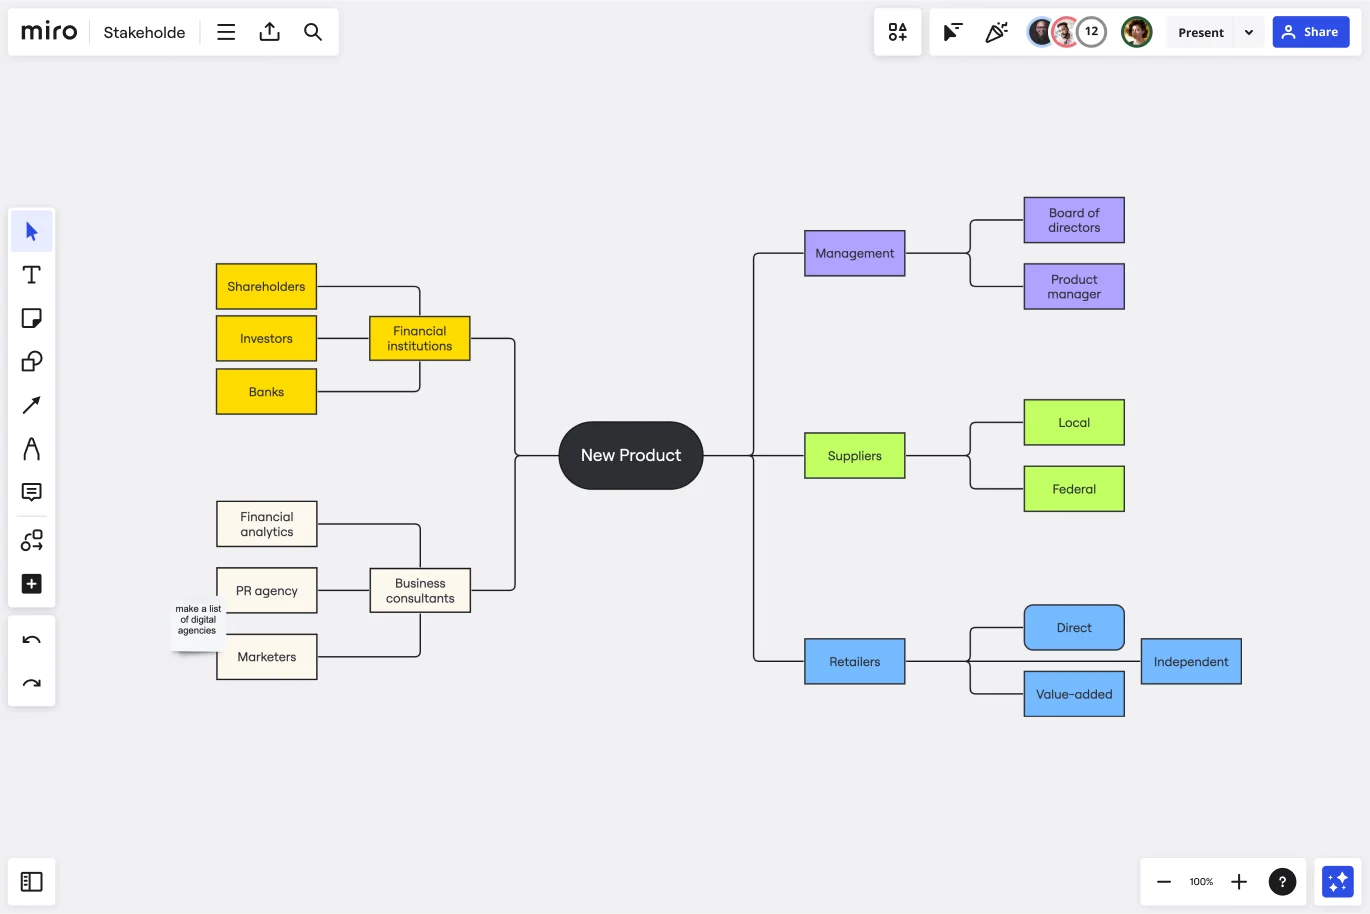
A stakeholder map is a visual tool that helps you categorize people based on their power and interests. This enables you to understand how they may influence your project or have an interest in your product or idea.
However, it is important to note that stakeholder mapping only focuses on the hierarchies within your organization, and it's a widely used project management tool at the beginning of a project. Doing it early can prevent miscommunication, ensure all groups are aligned on objectives, and set expectations about outcomes and results.
How to use the stakeholder map template in Miro
Here are the steps to follow when creating a stakeholder map:
Identify stakeholders: Begin by identifying the stakeholders relevant to your project or scenario. These could be people, groups, or organizations interested in your initiative.
Easy edititing: Double-click on each shape to add or edit content. Here, you can add details such as the stakeholder's name, role, relationship to the project, and any other relevant information.
Make it your own: Use Miro's automated diagramming features to expand your stakeholder map and categorize them accordingly.
Invite everyone to join you: If you're working with a team, use Miro's collaboration features to invite team members to the board. This enables real-time collaboration and input.
Comments and annotations: Encourage team members to add comments or annotations to the Stakeholder Map. This helps capture additional insights and perspectives.
By following these steps, you can create a comprehensive stakeholder map that includes all relevant people and groups and captures different perspectives and insights.
Why should you use a stakeholder mapping template?
Imagine starting a new project and wanting it to be as successful as possible. You should start asking these questions: Who should you involve? Who should you keep updated? Who is likely to have questions or objections?
That’s when the stakeholder mapping template comes in quite handy from the start, so you can manage stakeholders and assertively communicate with them to move your project forward.
Here are three benefits of stakeholder mapping:
Define your projects well
Stakeholders aren’t just your allies – they can also deliver insights and advice that help you shape your project. When you involve a diverse group of stakeholders from the start, they will help you create the best outline and plan for your project that will set it up for success.
Create a shared understanding from early on
Once you understand your stakeholders and who they are, you can communicate early and often develop a shared understanding of your project. If they grasp the benefits, they are more likely to support you down the line.
Secure resources
Often, stakeholders are the ones who hold the purse strings or have the necessary influence for getting you the resources you need. A stakeholder map will help you identify these individuals more quickly.
With Miro's easy-to-use strategic group mapping tools it's easy to visualize your competitive scenario.
What should a stakeholder map include?
Stakeholder maps include primarily a diagram of the people involved, interested, or signing off on your project. It can contain internal or external stakeholders and people who should be informed or consulted about your project’s development.
How can I ensure that the stakeholder map remains relevant and up-to-date?
It's important to regularly review and update the stakeholder map, especially when there are changes in organizational strategy, goals, or stakeholder relationships. This will help ensure that the map remains accurate and effective.
Get started with this template right now.
Syllabus Template
Works best for:
Education
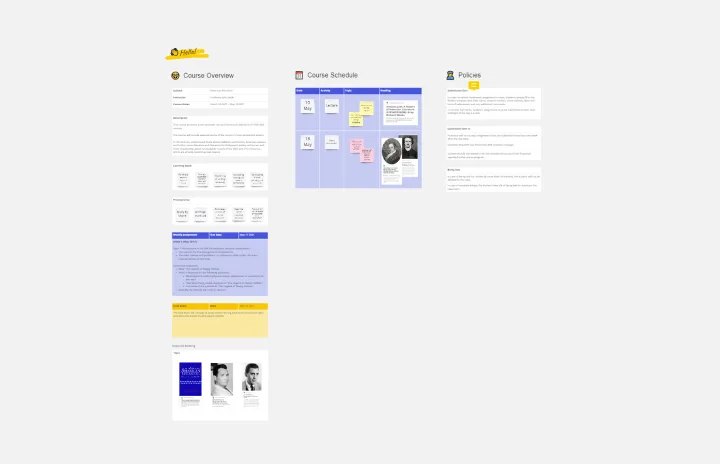
A Syllabus is a brief guide to your course, including expectations for your students, readings they will complete throughout the course, and a mission statement or course description. The Syllabus outlines any policies your students should follow during the course, rules and regulations that apply to them, and anything else your students should know. A Syllabus is a valuable tool for orienting your students, and it’s important the syllabus be clear and easy to follow. Use the Syllabus template to streamline the process of creating a simple, intuitive syllabus for your course.
Algorithm Flowchart Template
Works best for:
Diagramming, Flowcharts
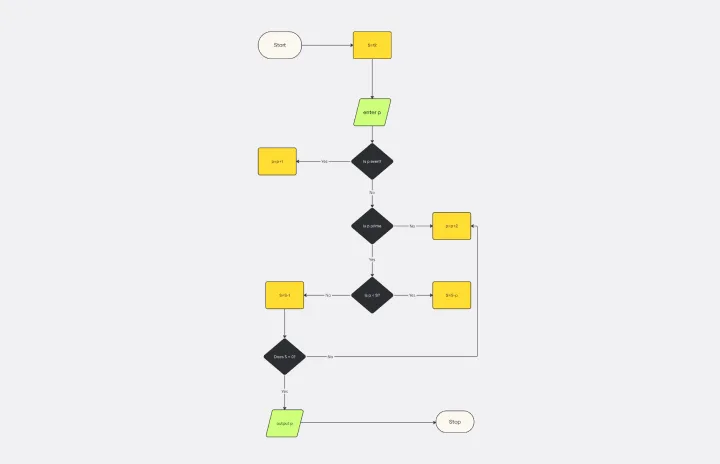
The Algorithm Flowchart Template is a useful tool for simplifying the process of creating and understanding complex algorithms. Its pre-structured format makes it easy to lay out each operation and decision point in a clear and easily understandable visual format. This is particularly helpful for explaining intricate processes to team members who may not be as technically proficient in the subject matter. With each step clearly defined within its designated shape, the flowchart promotes clarity and makes it easy to identify the logical flow at a glance. This clarity is the template's most significant advantage, reducing cognitive load and enabling a more inclusive and straightforward approach to discussing and refining algorithmic solutions.

PI Planning Template
Works best for:
Agile Methodology, Strategic Planning, Software Development
PI planning stands for “program increment planning.” Part of a Scaled Agile Framework (SAFe), PI Planning helps teams strategize toward a shared vision. In a typical PI planning session, teams get together to review a program backlog, align cross-functionally, and decide on the next steps. Many teams carry out a PI planning event every 8 to 12 weeks, but you can customize your planning schedule to fit your needs. Use PI planning to break down features, identify risks, find dependencies, and decide which stories you’re going to develop.
Project Organizational Chart Template
Works best for:
Project Management, Documentation, Org Charts
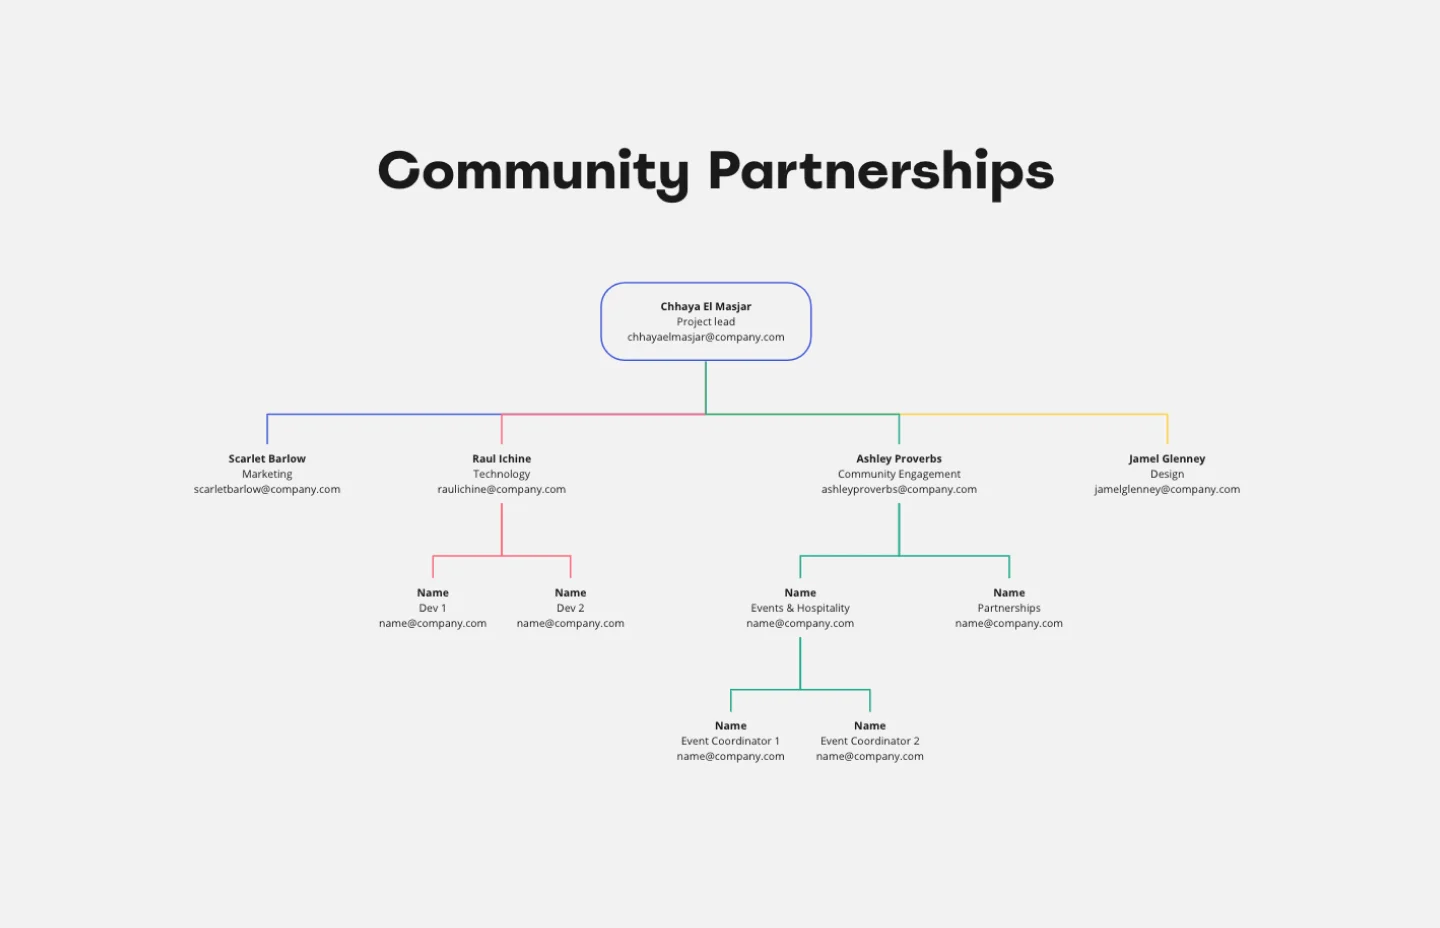
When you’re embarking on a long, complex project, you will inevitably hit roadblocks and obstacles. It’s important to have your project organizational chart on hand to overcome those challenges. A project organizational chart is a visual diagram that illustrates who is on your team and the role they play in a given project. It documents the structure of the project organization, the hierarchy between team members, and the relationships between employees. Project organizational charts are useful tools for clarifying who does what, securing buy-in, and setting expectations for the group.
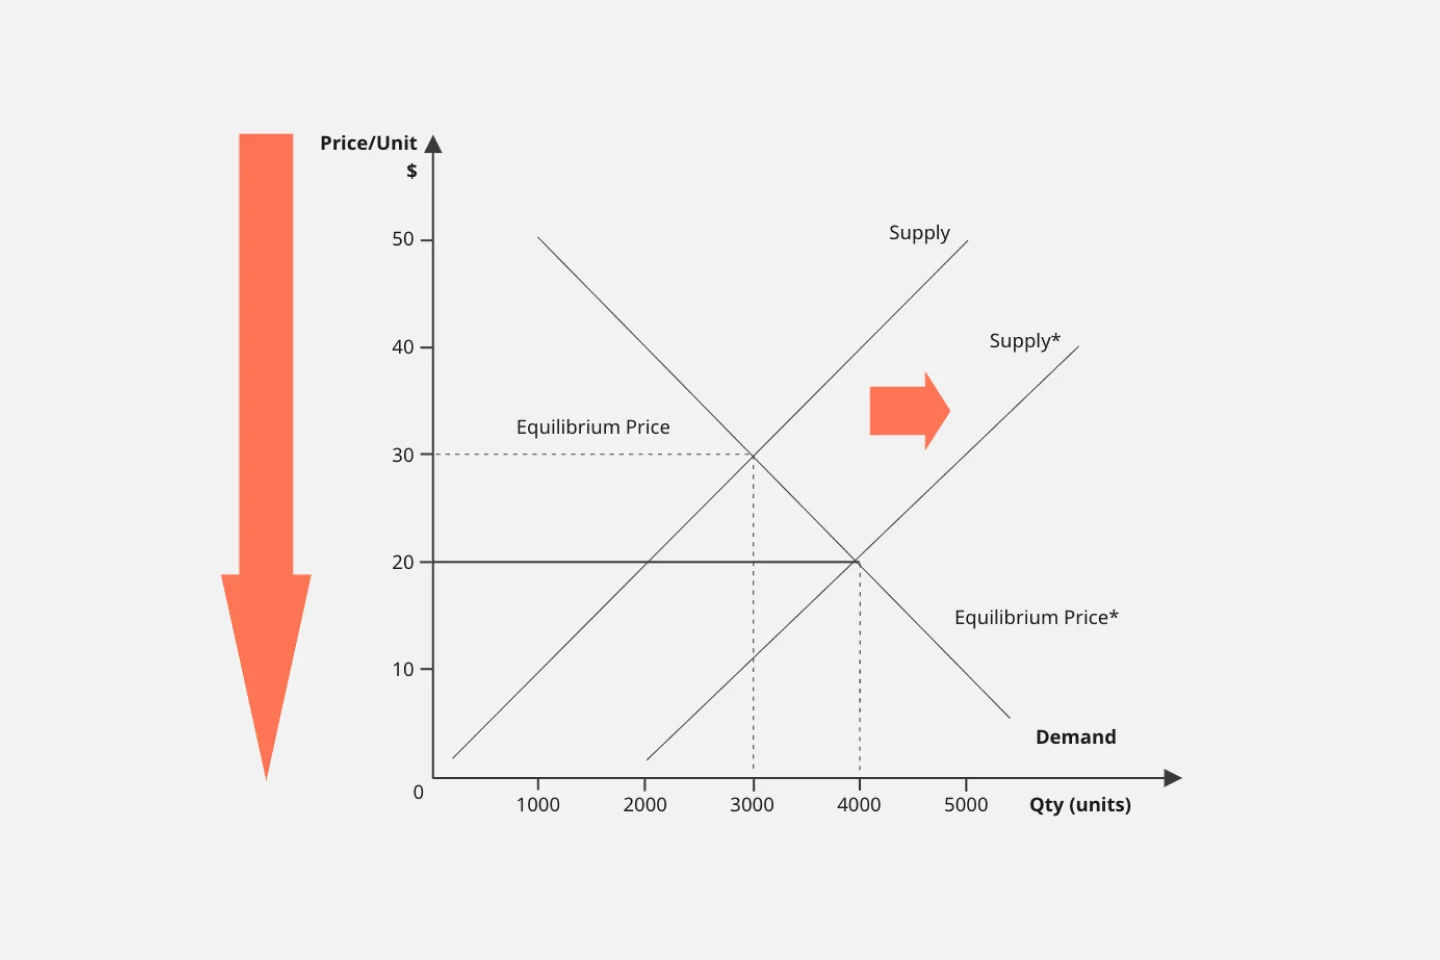
Supply and Demand Graph Template
Works best for:
Market Research, Mapping, Diagrams
How do you price your product so that you make a profit while keeping customers and manufacturers happy? By finding a fair price. A supply and demand diagram is a graph that visualizes how much demand there is for your product and how many products you need. This, in turn, helps you with product pricing.
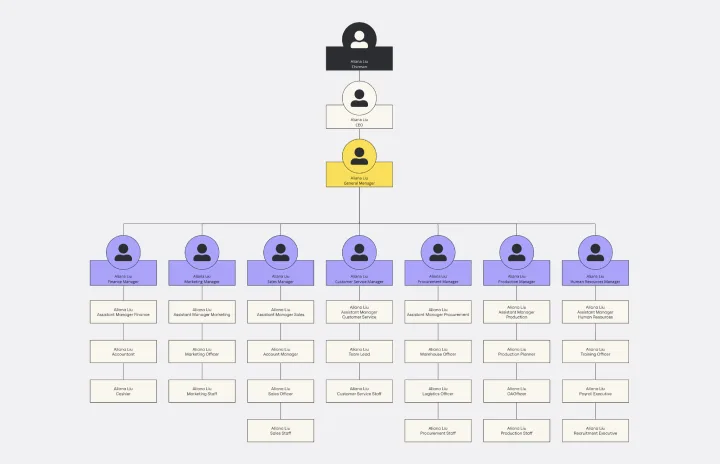
Vertical Organizational Chart
Works best for:
Diagramming, Organizational Charts, Organizational Design
The Vertical Organizational Chart Template is an efficient way to illustrate the hierarchy of an entity in a top-down format. This tool helps represent roles and relationships in a clear manner, starting from the topmost authority and branching downwards. It allows for a better understanding of the flow of responsibilities and communication channels within the organization. One of its most significant advantages is promoting clear communication. Depicting the organization's structure helps avoid misunderstandings and ensures everyone is on the same page regarding the chain of command.