
Table of contents
Table of contents
SaaS Customer Journey: The map your team needs to ship faster and win bigger
What you'll learn
Companies like Moladin doubled productivity by mapping their customer journey. Here's how to do the same:
→ The 7 stages every SaaS customer goes through (Awareness → Consideration → Trial → Activation → Conversion → Retention → Advocacy)
→ Why it matters: McKinsey research shows journey performance correlates with 3%+ revenue growth
→ How to build it: Step-by-step guide + video walkthrough using Miro's templates
→ Real results: Moladin's story of doubling productivity and accelerating decision-making
→ Avoid the traps: 5 common mistakes that make journey maps fail
→ Get answers: 8 FAQs on B2B vs B2C, tools, metrics, and executive buy-in
Time to read: 12 minutes | Time to start mapping: This week
SaaS Customer Journey
Look, we're going to be direct: if you're not mapping your SaaS customer journey, you're basically flying blind. And that's expensive.
Here's what we see happening: SaaS teams pour resources into building features, running ads, and closing deals — then watch users disappear somewhere between sign-up and actual value. The problem isn't your product or your marketing. It's that nobody's mapped the actual path your customers take, which means nobody can fix the places they're getting stuck.
Customer journey mapping isn't theory work. It's the roadmap that shows you exactly where to focus to drive real growth. And we're genuinely excited to show you how to build one that actually gets used.
The SaaS customer journey is different from traditional B2B or B2C paths. Your customers don't just buy once and walk away — they're signing up for trials, evaluating features, deciding whether to convert, and (hopefully) renewing every month or year. That cyclical relationship means there are way more opportunities to win them over, and way more places to lose them.
In this guide, we're walking through everything: what makes SaaS journeys unique, the seven stages that matter, how to build a map your whole team can actually use, and real examples of companies (like Moladin) who doubled their productivity by getting this right. Let's get you there, fast.
What makes the SaaS Customer Journey different (And why that matters)
It's not a straight line — It's a loop
Traditional customer journeys look like funnels: awareness → consideration → purchase → done. SaaS? That's just the beginning. Your real revenue comes from retention, expansion, and turning customers into advocates who bring you more customers.
Here's what sets SaaS apart:
Subscriptions change everything. Your customers are constantly evaluating whether to keep paying you. That's not a one-time sale — it's an ongoing relationship where you need to prove value continuously.
Self-service is the new normal. Most SaaS users will never talk to your sales team. They're discovering your product through content, signing up on their own, and trying to figure out if it solves their problem — all without human intervention.
Free trials and freemium create a new stage. Your "customers" aren't actually paying you yet. They're test-driving, which means your onboarding and activation matter more than your pricing page.
Multiple people, multiple journeys. Especially in B2B, you're dealing with the person who researches solutions, the person who tests them, the person who approves the budget, and the people who actually use the product daily.
Product usage tells the real story. In SaaS, customer behavior inside your product reveals everything: who's engaged, who's at risk of churning, who's ready for an upsell.
The bottom line? If you're using a generic journey map template designed for e-commerce or traditional B2B, you're missing the nuances that make or break SaaS growth.
Miro's innovation workspace helps teams map these complex, non-linear journeys in real-time, so everyone's working from the same playbook.
The 7 stages of a SaaS Customer Journey (And what actually happens at each one)
Let's cut through the theory and talk about what's really happening as someone moves from "never heard of you" to "can't shut up about you."
Stage 1: Awareness
What's happening: A potential customer realizes they have a problem and starts looking for solutions. They stumble across your brand through search, an ad, a friend's recommendation, or a review site.
Key touchpoints: SEO content, paid ads, social media, referrals, G2/Capterra reviews, webinars
Metrics to track: Website traffic, content engagement, brand search volume
Reality check: At this stage, they're not thinking about you specifically — they're trying to understand their problem. Your job is to show up where they're looking and be helpful, not salesy.
Stage 2: Consideration
What's happening: They're actively evaluating options, comparing you to competitors, reading reviews, watching demos, and trying to figure out if you're legit.
Key touchpoints: Product pages, competitor comparisons, case studies, demo videos, pricing pages, review sites
Metrics to track: Demo requests, pricing page views, time on product pages
B2B specific twist: In B2B SaaS, this stage involves multiple stakeholders. The person researching might not be the person buying. They're building an internal case for why your solution is the right choice.
Reality check: You're not the only option they're looking at. Your comparison content needs to be honest about where you shine and where you don't — because they're going to find that information anyway.
Stage 3: Trial/Freemium sign-up
What's happening: They've decided to give you a shot. They sign up for a free trial or freemium account. Congrats — you've got a user, not a customer (yet).
Key touchpoints: Sign-up flow, welcome emails, account setup, initial product experience
Metrics to track: Sign-up conversion rate, time to complete setup, activation rate
Critical moment: Every second of friction matters here. If your sign-up requires 15 form fields, you're losing people.
Stage 4: Activation and onboarding
What's happening: This is where you prove your worth. Can you get them to that "aha moment" — the point where they realize your product solves their problem — before they lose interest?
Key touchpoints: Product tours, in-app guidance, onboarding emails, tutorial videos, help documentation
Metrics to track: Feature adoption rate, completion of key actions, time to first value, onboarding completion rate
Common trap: Showing off every feature you've built. Nobody cares about your full feature set on day one. They care about solving the specific problem that brought them here.
Reality check: Most SaaS users decide whether to keep using a product within the first few sessions. If you're not delivering clear value fast, they're gone. Not later — now.
Stage 5: Conversion to paid
What's happening: Your trial user becomes a paying customer. This is what all the earlier work was building toward.
Key touchpoints: Upgrade prompts, pricing explanations, payment flow, ROI demonstrations
Metrics to track: Trial-to-paid conversion rate, average contract value, time to conversion
What triggers conversion:
- Hitting usage limits on the free plan
- Seeing clear ROI from the trial period
- Needing features only available in paid plans
- Approaching the end of trial with momentum
Reality check: Companies with the best trial-to-paid conversion rates aren't the ones with the cheapest pricing — they're the ones who've clearly demonstrated value during the trial.
Stage 6: Retention and expansion
What's happening: Now they're paying you, which means the real work begins. You need to keep delivering value, prevent churn, and look for opportunities to expand the relationship.
Key touchpoints: Product updates, customer success check-ins, usage monitoring, renewal notices, feature adoption campaigns, expansion conversations
Metrics to track: Churn rate, net retention rate (NRR), feature adoption depth, product usage intensity
Two paths diverge here:
- Healthy customers: Using the product regularly, exploring new features, ready for expansion
- At-risk customers: Declining usage, support tickets about problems, renewal coming up
Reality check: This is where SaaS companies actually make money. Acquiring a new customer costs 5-7 times more than keeping an existing one (Gartner research). Retention beats acquisition. Miro helps teams visualize customer health across the journey, making it easier to spot at-risk accounts before they churn.
Stage 7: Advocacy
What's happening: Your happiest customers start actively promoting you. They leave reviews, refer colleagues, participate in case studies, and answer questions in your community.
Key touchpoints: Review requests, referral programs, case study opportunities, community forums, user conferences
Metrics to track: Net Promoter Score (NPS), referral rate, review volume, customer lifetime value
What creates advocates:
- Consistently delivering value that exceeds price
- Feeling heard when they give feedback
- Getting recognition for their success
- Being part of a community
Reality check: Advocacy doesn't happen automatically. You need to make it easy (give them referral links), rewarding (offer incentives that matter), and meaningful (recognize their contributions publicly).
When Moladin mapped their customer journey end-to-end — including this advocacy stage — they were able to double their product development productivity by understanding where customers got stuck and where they soared.
Why customer journey mapping actually moves the needle
Here's what happens when you map your customer journey properly:
You stop the bleeding
McKinsey research found that companies excelling at delivering customer journeys see significantly higher revenue growth — in fact, a one-point improvement on customer satisfaction with key journeys corresponds to at least a three-percentage-point increase in revenue growth rate. Higher satisfaction means lower churn. Lower churn means you stop losing the revenue you worked so hard to earn.
You find the hidden bottlenecks
Let's say 50% of your trial users sign up, but only 10% activate your key feature. Without a journey map, that looks like a product problem. With a journey map, you realize users never see the onboarding tooltip because it loads too slowly on mobile. Now you know exactly what to fix.
Everyone stops working in silos
When marketing doesn't know what product is building, when sales doesn't know what customer success is hearing, and when product doesn't know what marketing is promising — you get misaligned touchpoints and frustrated customers. A shared journey map gives every team the same playbook.
Real business outcomes:
- Shorter sales cycles because you're targeting the right message at the right stage
- Higher trial-to-paid conversion when you nail activation
- Increased customer lifetime value when you spot expansion opportunities
- Lower CAC when advocates start doing your marketing for you
- Better product decisions when you understand which features matter at which stages
Harvard Business Review research shows that organizations able to skillfully manage the entire customer journey reap enormous benefits: enhanced customer satisfaction, reduced churn, increased revenue, and greater employee satisfaction.
What happens without journey mapping
Siloed teams: Marketing creates content that doesn't match what the product actually does. Sales promises features that don't exist.
Inability to measure CX ROI: You can't improve what you can't measure.
Inconsistent experiences: Customers get different messages depending on which team they interact with.
Missed opportunities: You don't know when customers are ready for upsells, or when they're about to churn.
Reactive firefighting: You're always playing defense, dealing with problems after they happen.
How to build your SaaS customer journey map (The ship-it-this-week guide)
Forget the 47-page consulting deck. Here's how to actually create a customer journey map that your team will use.
Step 1: Pick your battle (define goals & scope)
Don't try to map everything for everyone. Start with one specific challenge and one specific customer segment.
Good goals:
- "Reduce trial drop-off for our SMB segment"
- "Improve activation rate for our project management persona"
- "Prevent churn in enterprise accounts during months 3-6"
Bad goals:
- "Understand our customers better" (too vague)
- "Map the entire company's customer experience" (too ambitious for v1)
Step 2: Build real customer personas
You need to understand who's actually using your product, not who you wish was using it.
For B2B SaaS, map multiple personas:
- The researcher who's looking for solutions
- The decision-maker who approves the budget
- The end-user who'll actually use the product daily
- The champion who sells it internally
Critical: Base this on real customer interviews and data, not assumptions.
Step 3: Map every touchpoint
Here's where you get your cross-functional team involved: marketing, sales, product, customer success, support.
Types of touchpoints:
- Marketing: Blog posts, ads, social media, webinars, email campaigns
- Sales: Demos, sales calls, proposals, pricing discussions
- Product: Sign-up flow, onboarding, feature discovery, in-app messages
- Customer success: Check-in calls, training sessions, renewal conversations
- Support: Help docs, chatbot, support tickets, community forums
Don't forget the "dark" touchpoints: Review sites, competitor research, peer recommendations, online communities.
Pro move: Use Miro's Journeys to map these in real-time with your team.
Step 4: Gather data (mix numbers with stories)
Quantitative sources:
- Product analytics (activation rates, feature adoption, usage patterns)
- Marketing analytics (traffic sources, conversion rates)
- Sales data (deal velocity, win rates, common objections)
- Support metrics (ticket volume, common issues)
Qualitative sources:
- Customer interviews (talk to happy customers AND churned customers)
- Support ticket themes
- Survey responses
- Sales call recordings
The magic happens when you combine them. Numbers tell you that 60% of trials drop off at day 3. Interviews tell you why.
Step 5: Map actions, emotions, and pain points
For each stage, document:
- What are customers doing? (Their actions)
- What are they thinking and feeling? (Their emotional state)
- Where are the friction points? (Pain points)
- What would make them progress? (Opportunities)
Include real customer quotes. When you use actual words from customer interviews, it builds empathy across your team.
Step 6: Visualize it (make it useful, not pretty)
What makes a useful map:
Visual and collaborative. Not a static PowerPoint buried in Google Drive. Use a tool where teams can comment, update in real-time, and link to related work.
Connected to your workflow. Link pain points directly to Jira tickets. Connect opportunities to your roadmap in Confluence.
Updated regularly. Set a recurring calendar reminder to review and refresh.
Accessible to everyone. The whole company should be able to see this.
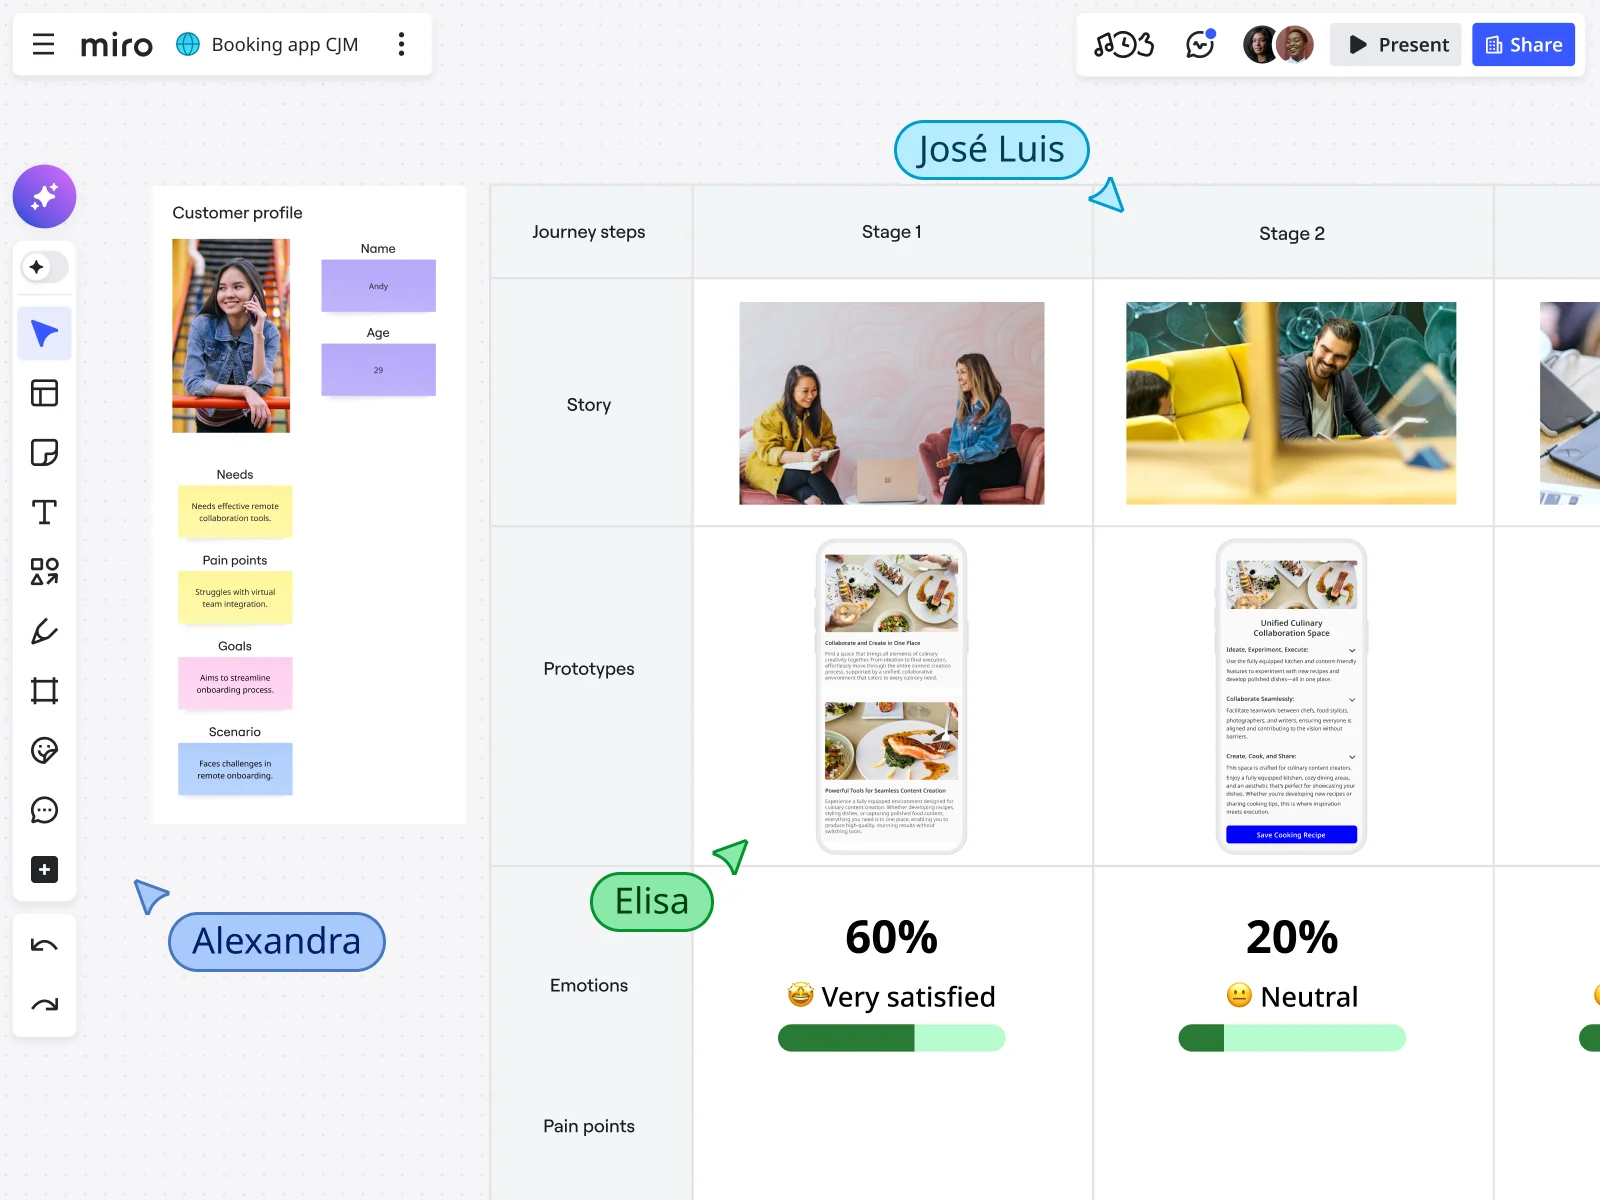
Miro advantage: You can build your journey map with your entire team in the same session, even if half the team is remote. Real-time cursors show you who's working on what. Miro's journey mapping templates give you a head start.
How to create a customer journey map in Miro (quick start)
Want to see this in action? Check out this step-by-step walkthrough:
Here's how to get started in Miro right now:
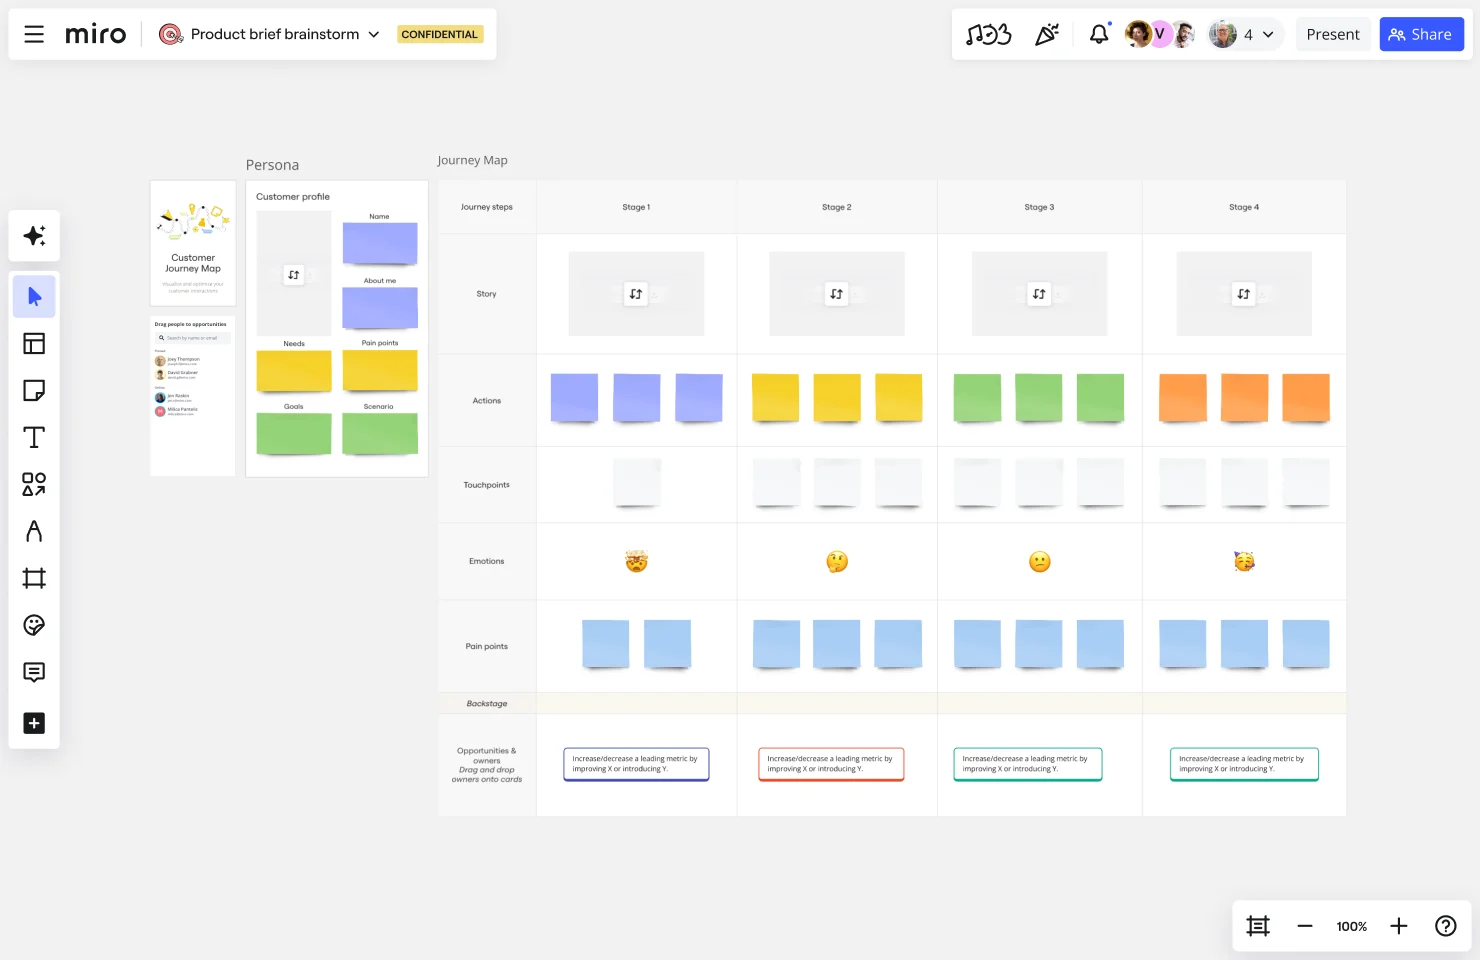
1. Choose your template
- Open Miro and search for "customer journey map" in the template library
- Select a template that matches your needs (current state, future state, or service blueprint)
- Click "Use template" to add it to your board
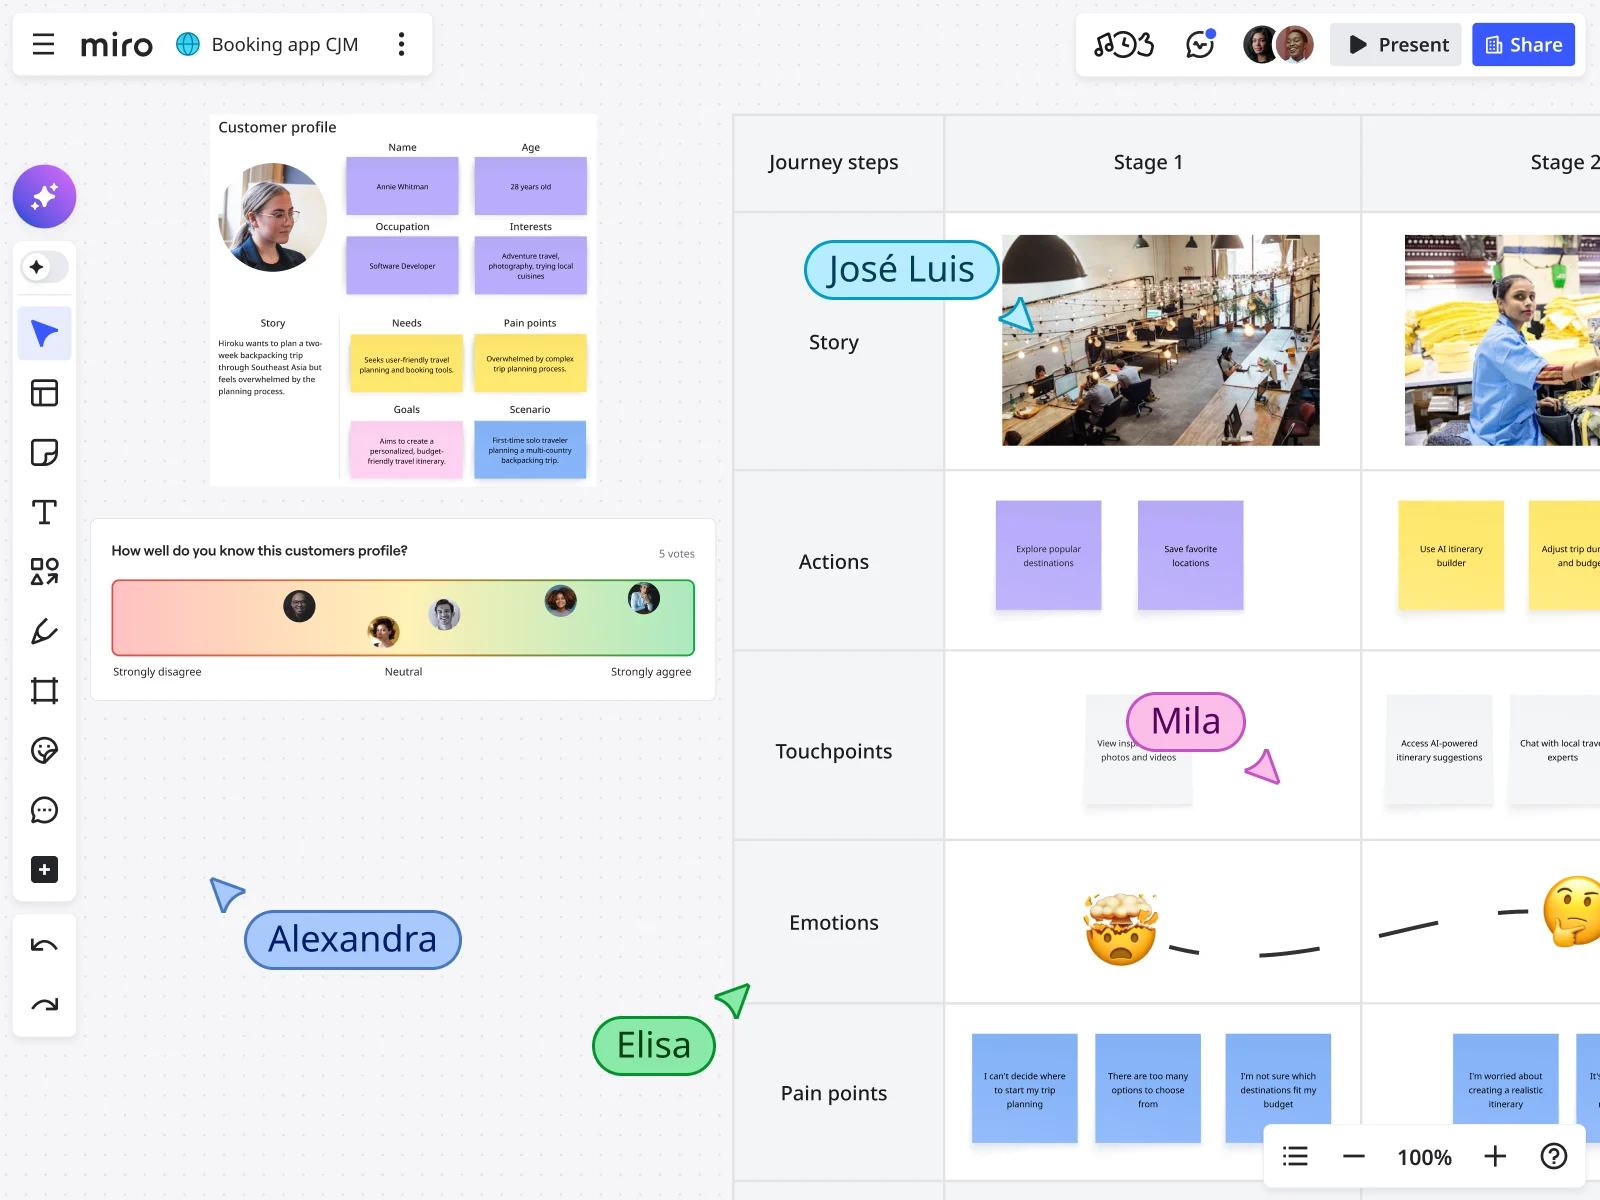
2. Define your persona
- Start by filling in your customer persona details at the top of the template
- Include their goals, pain points, and key characteristics
- Add a photo or avatar to make them feel real to your team
3. Map the journey stages
- Use the pre-built sections for each stage (Awareness, Consideration, Trial, etc.)
- Add sticky notes for customer actions at each stage
- Use different colors to categorize touchpoints by department (marketing, sales, product, support)
4. Capture emotions and pain points
- Add an emotion line showing how customers feel at each stage
- Use emojis or simple icons to visualize emotional highs and lows
- Document specific pain points where customers get frustrated or stuck
5. Identify opportunities
- Mark areas where you can improve the experience
- Add action items directly on the board
- Link to Jira tickets or other project management tools using Miro's integrations
6. Collaborate in real-time
- Invite your cross-functional team to the board
- Use @mentions in comments to assign tasks
- Run a live workshop where everyone adds insights simultaneously
- Vote on which opportunities to prioritize first using Miro's voting feature
Pro tip: Use Miro's AI features to help identify patterns across your sticky notes and generate summaries of customer feedback themes.
Step 7: Identify Opportunities and Actually Act on Them
For each pain point, ask:
- How impactful is fixing this?
- How difficult is it to fix?
- Who owns making this better?
- What's the first step?
Prioritize ruthlessly. Use an impact/effort matrix to identify quick wins and strategic bets.
Create accountability. Every identified opportunity should have an owner and a deadline.
Measure the impact. When you make changes based on journey map insights, track whether they actually move the metrics you care about.
Real results: How Moladin doubled productivity with journey mapping
Let's get specific about what happens when you actually do this work.
The Company
Moladin is an Indonesian automotive marketplace and fintech platform operating in a fast-moving market where speed and operational efficiency determine who wins.
The Problem
Moladin's business model shifted in 2021, moving to a more market-driven approach. Their operational workflows were evolving constantly — sometimes weekly — to meet new business needs.
What that looked like:
- Multiple teams struggling to track shifting processes
- Changes happening so fast that alignment became nearly impossible
- Prolonged response times when making decisions
- Bottlenecks nobody could see until after they caused delays
- Quality issues and critical errors slipping through
What They Did with Miro
Moladin's product team started using Miro in three specific ways:
- Research synthesis: Consolidated market insights and qualitative findings, making it easier to distill key takeaways
- End-to-end flow documentation: Mapped out entire customer journeys across mobile apps, internal dashboards, and manual processes
- Retrospectives: Conducted regular reviews to identify bottlenecks and optimize workflows
The Results
- Doubled product development productivity
- Faster iteration cycles because everyone could see the impact of proposed changes
- Better alignment across teams
- Higher-quality releases with fewer errors
- Accelerated decision-making: Product managers could instantly identify all touchpoints affected by changes
- Reduced feedback loops: Real-time updates during meetings meant stakeholders could approve changes on the spot
As their team said: "Miro has become the backbone of our product development process. Having a single source of truth has been invaluable — not only for helping new team members ramp up quickly but also for ensuring seamless collaboration across teams."
Best practices that actually matter
Focus on one persona at a time
Why it matters: When you try to map everyone's journey at once, you end up with a generic map that applies to nobody specifically.
What to do: Start with your highest-value segment. Map their journey thoroughly. Once that's working, expand to the next persona.
Get the whole team in the room
Why it matters: Marketing knows what happens before sign-up. Product knows what happens inside the app. Sales knows the objections. Customer success knows why people churn.
What to do: Run a cross-functional workshop where each team contributes. Use Miro's collaborative canvas so remote teams can participate fully.
Combine numbers with stories
Why it matters: Data shows what is happening. Customer conversations show why it's happening.
What to do: Pull quantitative data, interview customers (especially the ones who churned), and include direct quotes in your journey map to build empathy.
Map current state AND future state
Current state map: This is reality. Where are customers getting stuck today? Use this to identify problems.
Future state map: This is your goal. What would the ideal journey look like? Use this to guide improvements.
Make it living, not static
Why it matters: Your product changes. Your customers evolve. A journey map created six months ago might already be outdated.
What to do:
- Schedule quarterly reviews
- Update immediately when you launch major features or change pricing
- Connect the map to your actual work
Connect insights to action
Why it matters: The best journey maps mean nothing if nobody does anything with them.
What to do:
- Link every pain point to a task in Jira
- Assign clear ownership
- Embed your journey map where teams can access it
- Measure whether the changes you make improve key metrics
Five journey mapping mistakes that sabotage growth
Mistake #1: Building journey maps in a vacuum
What this looks like: The marketing team disappears for two weeks, emerges with a beautiful journey map based on their assumptions.
Why it fails: You're mapping your beliefs about the customer, not the actual customer experience.
Fix it: Involve multiple teams from the start. Base every stage on customer research and behavioral data.
Mistake #2: Treating it as a one-time project
What this looks like: "We did journey mapping last year. Check, done."
Why it fails: Your product evolves. Your customers' needs shift. The journey that was accurate six months ago might be completely outdated today.
Fix it: Build regular review cycles. Quarterly is a good baseline.
Mistake #3: Mapping too many personas at once
What this looks like: One map trying to capture the journey for SMBs, mid-market, enterprise, free users, and paid users all at the same time.
Why it fails: You end up with a generic map that's "sort of true" for everyone but deeply useful for nobody.
Fix it: Pick one high-value persona and map their journey thoroughly.
Mistake #4: Only mapping the happy path
What this looks like: Your journey map shows customers smoothly progressing from awareness to advocacy with no problems.
Why it fails: The whole point is to identify friction, drop-off points, and opportunities to improve.
Fix it: Actively seek out the messy parts. Interview customers who churned.
Mistake #5: Creating beautiful decks that nobody uses
What this looks like: A gorgeously designed journey map lives in a PowerPoint file. It gets presented once, then never referenced again.
Why it fails: Journey maps only create value when they inform actual decisions.
Fix it:
- Embed your map where teams actually work
- Link pain points to concrete action items
- Reference the map in sprint planning and roadmap discussions
SaaS Customer Journey Mapping FAQs
What's the difference between a B2B and B2C SaaS customer journey?
B2B SaaS journeys involve multiple stakeholders, longer sales cycles, and higher contract values. You're dealing with a buying committee where the CFO approves the budget, the IT director evaluates security, and the end-users actually test the product.
B2C SaaS journeys are typically faster and simpler. One person makes the decision, signs up, and starts using the product.
What matters for B2B: You need to map both the buyer's journey (who makes the financial decision) and the user's journey (who actually uses the product daily).
How often should I update my SaaS customer journey map?
Baseline: Review quarterly. Update immediately when major changes happen.
What counts as "major changes":
- Launching new features or products
- Changing pricing or packaging
- Shifting go-to-market strategy
- Noticing significant drops in key conversion metrics
What tools do I need to create a SaaS customer journey map?
Minimum viable stack:
Visual collaboration tool:
is purpose-built for this, with templates and real-time collaboration
Analytics platform:
To track conversion rates and user behavior
Customer feedback tools:
Surveys, interview transcripts, support ticket themes
Product analytics:
To understand feature adoption and usage patterns
Should I map the customer journey for each pricing tier separately?
Short answer: Yes, if the journeys are meaningfully different.
When to create separate maps:
- Free tier users vs. paid users (very different motivations)
- SMB vs. enterprise customers (different buying processes)
Start with your highest-value segment first.
What metrics should I track at each stage?
Awareness: Traffic, brand search volume, content engagement
Consideration: Demo requests, pricing page views, content downloads
Trial/Sign-up: Conversion rate, sign-up abandonment
Activation: Time to first value, feature adoption rate, onboarding completion
Conversion: Trial-to-paid rate, sales cycle length
Retention: Churn rate, NRR, product usage intensity
Advocacy: NPS, referral rate, reviews posted
What's the difference between a customer journey map and a user flow?
Customer journey map = Strategic, shows the complete experience across all touchpoints (marketing, sales, product, support) including emotions and motivations.
User flow = Tactical, shows the specific path users take within your product to complete particular tasks.
You need both. The journey map guides your strategy. User flows help you design specific product experiences.
How do I get executive buy-in for customer journey mapping?
Talk outcomes, not activities.
Don't say: "We should do customer journey mapping because it's a best practice."
Do say: "We're losing 60% of trial users before they activate. Journey mapping will show us exactly where they're dropping off so we can fix it and improve conversion."
Frame it around money:
- Reduced churn = retained revenue
- Higher conversion rates = faster growth
- Better targeting = lower CAC
Show proof: Reference companies like Moladin that doubled productivity by mapping their customer journey. Point to the McKinsey research showing journey performance strongly correlates with revenue growth.
Let's ship this: Your next steps
Here's the reality: Your SaaS customer journey exists whether you map it or not. The question is whether you're going to understand it, optimize it, and use it to drive growth — or keep guessing why customers drop off.
What we know works:
→ Start with one persona, one problem. Pick your highest-value customer segment and a specific challenge you're facing (like activation rates or churn). Map that journey first.
→ Get your team in the same room (or on the same board). Pull in marketing, sales, product, customer success, and support. Use a collaborative tool like Miro where everyone can contribute simultaneously.
→ Ground it in real data and real conversations. Mix analytics with customer interviews. Use actual quotes from real customers to build empathy.
→ Make it visual and living. Build your map somewhere it can evolve. Link it to your actual work — Jira tickets, Confluence pages, Slack discussions.
→ Connect insights to action. Every pain point should have an owner and a plan. Track whether your improvements actually move the metrics that matter.
Companies like Moladin are doubling productivity by getting this right. They're not doing anything magical — they're just mapping the journey, identifying the bottlenecks, and fixing them systematically.
Ready to start? Explore Miro's customer journey mapping tools and templates that teams are using to understand customers, align cross-functionally, and ship improvements faster.
Your customers are already on a journey with you. Let's make sure it's a great one.
Author: The Miro team Last update: January 12, 2026