Customer Journey Data Visualization in Miro
Customer journey mapping involves a huge amount of data. We’re talking emotions, channels, touchpoints, conversions, and feedback. This may feel overwhelming, but with Miro, you can turn that complexity into clear visual narratives that you can share, explore or take action on. Make customer experience improvements based on evidence, not guesswork.
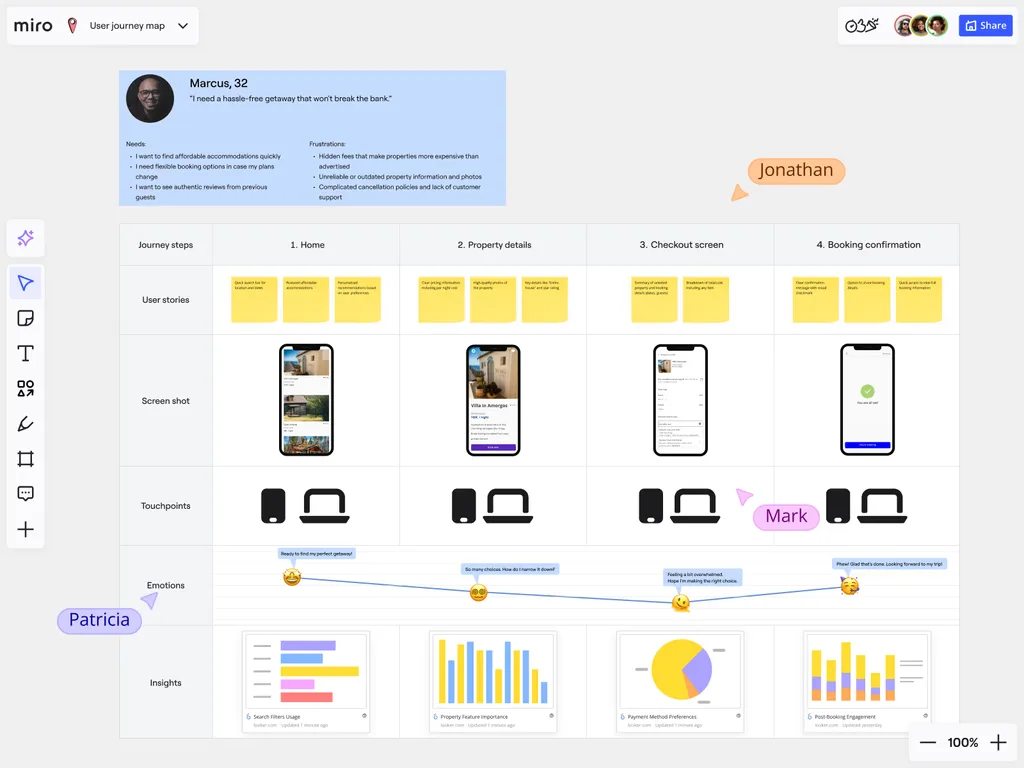
Visualize Customer Emotion and Satisfaction Data
Journey maps aren’t just about hitting steps, they’re about how your customers feel along the way. With Miro, you can plot satisfaction scores and pain points visually with charts, icons, and emojis. This makes it simple and easy to see where customers felt satisfied or frustrated. By making emotions visual, your teams can prioritize improvements that have the biggest human impact. Miro AI can also summarize feedback and cluster related comments, making it easier to spot recurring emotional triggers across customer segments.
Map Multi-Channel Journey Touchpoints
Most journeys don’t happen in just one place. They move across websites, apps, stores, and support lines. And Miro helps you map these flows more clearly.
Visualizing touchpoints side by side makes it easier to see where channels connect, overlap, or break down. By understanding how customers move between these touchpoints, teams can create smoother omnichannel experiences that prevent friction and build customer loyalty.
Pre-Purchase Touchpoints
Pre-purchase touchpoints are the first moments of connection. It may be discovering a brand on social media, clicking a link to a website, or getting a recommendation from a friend. It’s general awareness.
At this stage, your role is to demonstrate to customers how you can meet their needs in a clear and compelling way.
In Miro, your teams can map out these awareness movements side by side using swimlanes, as well as capture customer research in online sticky notes. This allows you to see which discovery channels create the most engagement and where to focus your efforts in the early stages of customer awareness.
Purchase Touchpoints
For customers, buying should feel effortless. Online or in-store. Long forms, slow websites, or complex checkouts can derail a decision and disrupt those delicate moments of motivation. But these issues can ruin the experience. Perfecting the purchase touchpoint reduces drop-offs and increases chances of return visits.
Miro helps you to visualize the purchase process more clearly with flowcharts, highlighting potential friction points for customers looking to purchase. You can annotate these points with icons or emojis, giving more context on priorities and urgencies for your team. This allows everyone to be aligned on problems, as well as providing one shared space to collaborate on solutions.
Post-Purchase Touchpoints
The problem with talking about a marketing ‘funnel’ is that it doesn’t talk about what happens to the customers once they’ve gone through. The journey doesn't end at checkout. Follow-up emails, support interactions, and loyalty programs are all essential for turning a one-and-done customer into an advocate. It’s well-known within the industry that it’s far more difficult to acquire a new customer than it is to retain an existing one, so this touchpoint should be prioritized.
In Miro, you can extend the customer journey map to include timelines of post-purchase interactions, and even integrate CRM data from tools like Salesforce or HubSpot.
Also, with AI-powered clustering, common recurring issues are much easier to spot. This helps you refine your retention strategies even further.
Create Interactive Journey Dashboards
Static reports get outdated quickly. Miro helps you build interactive dashboards where stakeholders can explore customer segments, time periods, or journey variations in real time.
Everyone gets access to the same source of truth, but can filter insights to match their role; whether they're in customer experience, campaigns, or operations. Boards can also be embedded directly into tools like Confluence, Teams, or Notion. That means your dashboards are accessible wherever your teams already work.
Integrate Real-Time Customer Data
Miro boards can be connected to live data sources, meaning your customer journey maps update automatically as behaviors shift or new feedback is collected. Remember, the customer journey is not always short-lived and your map will need to grow. The scalability of Miro ensures you can keep tracking and planning in boards as big as you need.
By integrating real-time data, your teams can monitor trends continuously and respond in the moment, rather than constantly responding to issues. You get more visibility, and therefore more control.
Enhance Your Customer Journey Maps with Powerful Data Visualisation
Turning customer journey data into actionable insights is easy with Miro. Watch your teams visualize customer emotions, explore touchpoints, and analyze metrics across the entire funnel. Explore Miro’s pricing plans and discover the one that best supports your customer journey mapping goals.
FAQs
Can you use different charts and graphs to visualize your journey data?
Yes! Miro has a lot of built-in charting tools to visualize data directly on your board. Create bar charts, line graphs, or pie charts directly in Miro to track things like satisfaction scores, engagement metrics, or conversion rates at each stage of the journey.
How can you visually represent customer emotions on a journey map?
Many teams use icons, emojis or color-coding to represent customer emotions on a journey map. For instance, a green smiley might show a positive moment, while red signals a pain point. It’s an easy way to signal emotion in a universal language.
How do you map a customer’s journey across multiple channels, like online and in-store?
You can use swim lanes to separate channels such as “Website,” “Social Media,” or “In-Store.” This is a clear way to see how journeys flow across touchpoints and where certain aspects need improvement.
Is it possible to create a dashboard from your customer journey map?
Yes. You can bring charts, metrics and customer feedback into one central area of your board. This creates a live dashboard for different teams and channels to find insights without constantly asking you to find the data for them.
Can you connect a customer journey map to external data sources?
Miro has some native integrations, but you can also connect over 160 tools and third-party apps to pull in live data such as web analytics, survey results, or support tickets.
This allows you to automatically update your journey map with real-time metrics, helping you continuously monitor performance.
Author: Miro Team Last update: October 6, 2025