About the Assumption Grid Template
Most business models and decisions are based on assumptions. Whether you’re a startup, an enterprise company, or somewhere in between, you’re probably making assumptions almost every day. But when resources and time are on the line, it can be hard to decide whether your assumptions are worth making -- and if you’re making tough judgment calls, it’s not always easy to know which assumptions to test.
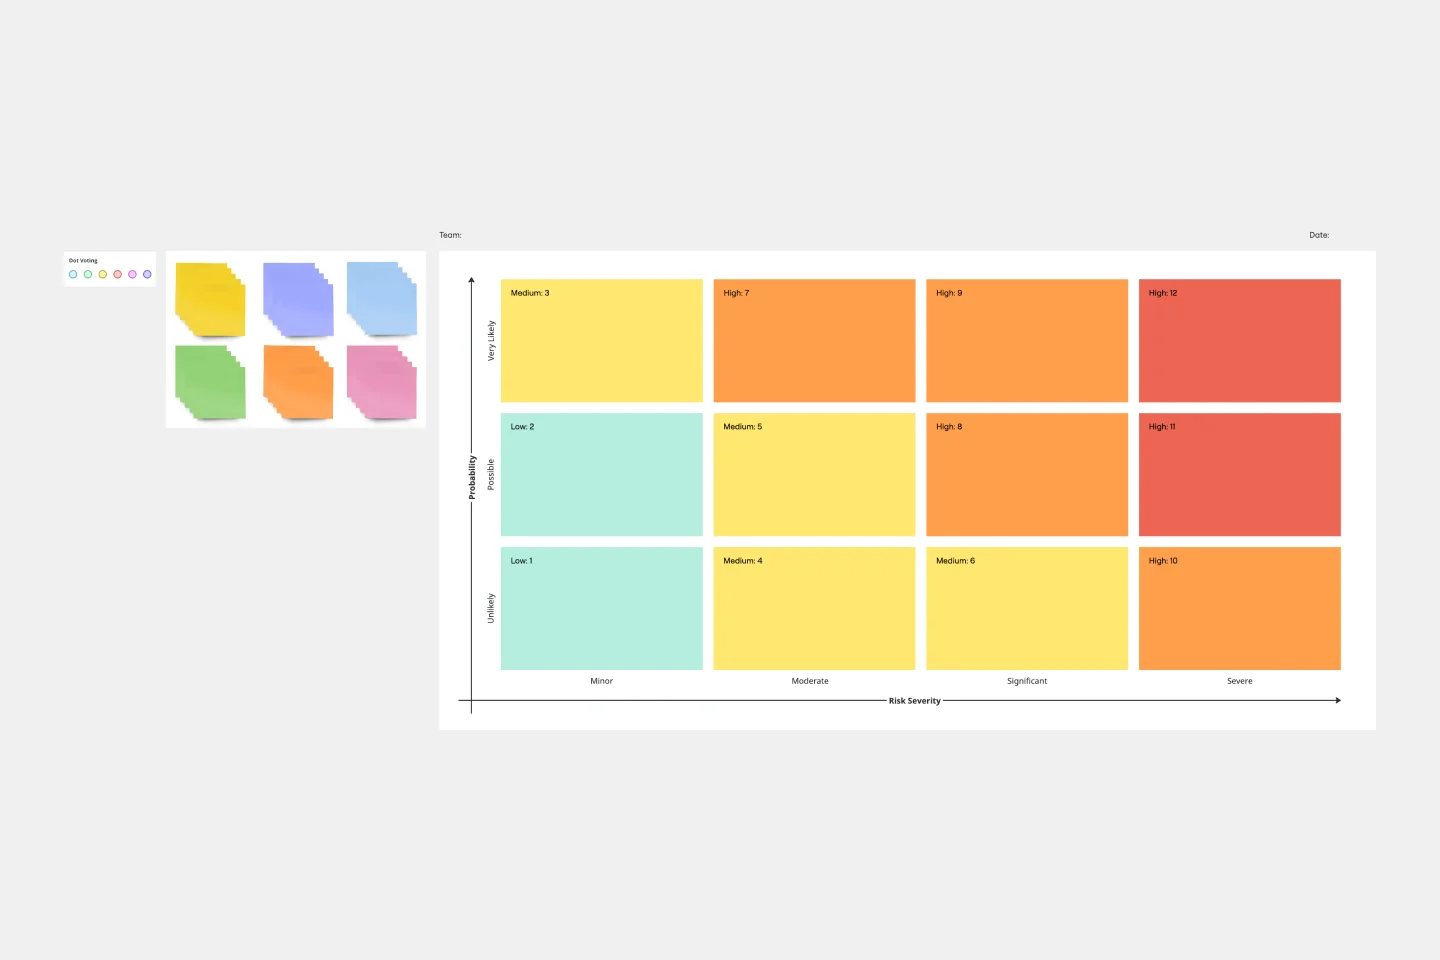
Developed by IBM, an Assumption Grid is a powerful tool that helps you decide which assumptions from your business model you should test first. The grid plots your assumptions on two axes: high impact assumptions for which you have little information, and low impact assumptions for which you have little information. Visualizing your assumptions can empower you to make judgment calls, prioritize, mitigate risk, and overcome uncertainties.
Once you’ve placed a variety of items on the grid, the Assumption Grid becomes a great conversational tool. Bring your team into a room and have them go over the results. New assumptions might materialize, or you might move items around on the grid.
How do you use the assumption grid template?
Here are the steps to use our template effectively:
1. Customize the template according to your specific requirements.
2. Invite team members to join your board and collaborate with you.
3. Create color-coded sticky notes to keep track of each person’s contributions.
4. Use the username or video chat feature if you require input from others.
5. Upload various file types, such as documents, photos, videos, and PDFs, to store all the relevant information in one place.
By following these steps, you can effectively use our assumption grid template and streamline your team's workflow.
Assumption Grid Template FAQs
When should you use the Assumption Grid template?
IBM recommends using the Assumption Grid as often as possible, and that is sound advice. For most organizations, risk is the only constant. The sooner you can recognize and evaluate your teams’ assumptions, the more quickly you can mitigate potential risk and make judgment calls.
You can use the Assumption Grid anytime you’d like to promote critical thinking about your ideas. The grid prompts you to consider levels of certainty and risk, which can help you and your team to uncover some of your biases and unfounded beliefs. The Assumption Grid is also a useful tool for overcoming decision-making roadblocks. If your team is divided on a decision, bring everyone together to build an Assumption Grid. The ensuing conversations might clarify goals and expectations.