About the Porter’s Value Chain Model (aka Value Chain Analysis template)
Commonly known as the Value Chain Analysis, Porter’s Value Chain Model is a much-used method to evaluate a business’s competitive edge and improve processes to have fewer bottlenecks and add more value to your customers.
What is a value chain analysis template?
A value chain analysis template includes a set of activities a company performs to deliver a valuable product from start to finish. The analysis allows your team to visualize all the business activities involved in creating the product — and helps you identify inefficiencies, bottlenecks, and miscommunications within the process.
Create your own value chain analysis template
Getting started with your team’s value chain analysis template is easy with Miro. Simply click “Use Template” and take the following steps to customize it for your own value chain analysis template:
Step 1: Replace the canned text in the orange squares and blue lines with your business’s specific primary and support business activities.
Step 2: Use sticky notes to map out the process for each business activity.
Step 3: Identify where bottlenecks occur and find areas where you can maximize value and gain a competitive advantage.
Make sure to consider using Miro's Value Stream Mapping tool during this process. This framework can help improve the efficiency of a specific process, which can then be integrated into a broader Value Chain Analysis to optimize the overall value delivery of the organization. Several value stream mapping templates are available on Miro to help get you started.
Benefits of using a value chain analysis template
First coined by Harvard Business School professor Michael Porter, Porter’s Value Chain Model helps your team evaluate your business activities so you can find ways to improve your competitive advantage. The value chain analysis will also help you determine costs, find activities that add the most value, outshine your competitors, and improve the value of what you deliver to your customers.
Building a product can be costly in terms of both time and resources. Even worse, it can be almost impossible to know whether a process works until after you’ve tried it. Porter’s Value Chain Model helps you visualize more complex or intangible processes.
Every business should perform this analysis at some point. Your team can do this anytime you want to improve your competitive advantage taking the following steps:
Define your business’s primary activities (e.g. logistics, operations, marketing).
Define your business’s support activities (e.g. HR, infrastructure, tech).
Analyze the cost and value of each.
Discover opportunities that allow you to gain a competitive advantage.
Value Chain Analysis Template FAQs
How do you draw Porter's value analysis?
You can build your Porter’s Value Chain Model following these steps: - Map all activities involved in producing your product - Calculate the cost of each activity - Find out what do your customers perceive as value - Check competitors Porter’s Value Chain Model and benchmarks - Choose what’s your competitive advantage and where will you capitalize
How do you analyze a value chain?
After building your value chain analysis template, you can evaluate the links between each activity and its values. This value chain analysis is particularly crucial when increasing competitiveness as it will determine how to proceed to improve processes.
How do you write a value chain analysis?
You can write your value chain analysis determining which activities are to be optimized. The analysis should include quantitative and qualitative data to help you develop action points to increase your product’s added value and customer base. After your value chain analysis is ready, you can draw a business case to implement changes and help you prioritize.

Miro
Your virtual workspace for innovation
Miro is an innovation workspace designed for teams of every size, everywhere, to dream, design, and build the future together. Our mission? To empower these teams to create the next big thing, powered by AI at every step of the way. Over 90 million users around the world rely on Miro to untangle complex ideas, put customer needs first, and deliver products and services faster. All supported by best-in-class security, compliance, and scalability.
Categories
Similar templates
SWOT Analysis Template
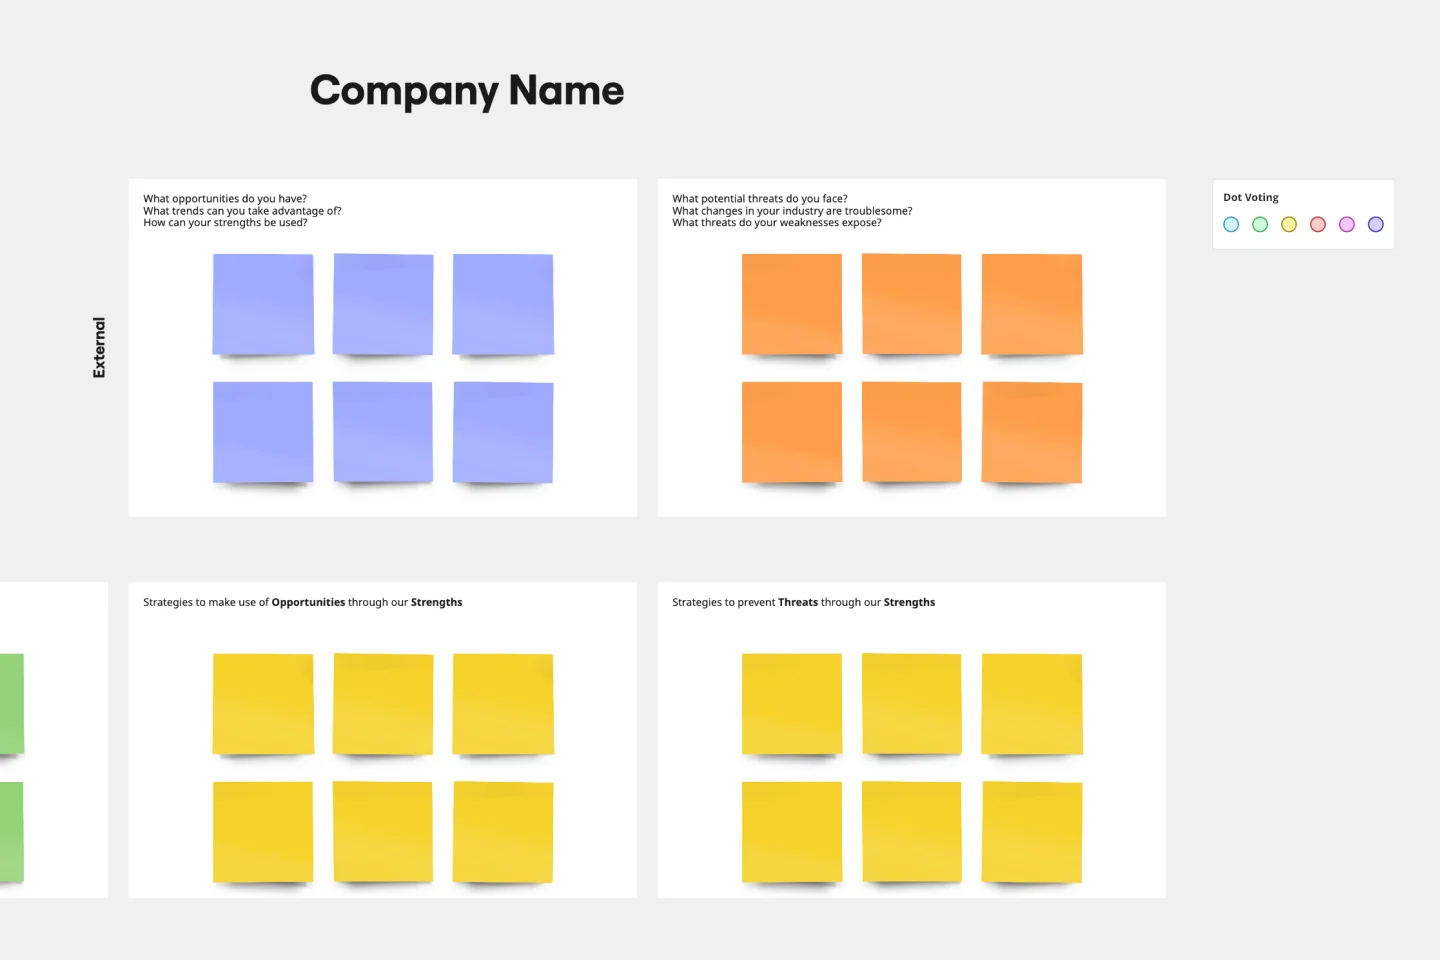
SWOT Analysis Template
When you’re developing a business strategy, it can be hard to figure out what to focus on. A SWOT analysis helps you hone in on key factors. SWOT stands for Strengths, Weaknesses, Opportunities, and Threats. Strengths and weaknesses are internal factors, like your employees, intellectual property, marketing strategy, and location. Opportunities and threats are usually external factors, like market fluctuations, competition, prices of raw materials, and consumer trends. Conduct a SWOT analysis whenever you want to explore opportunities for new businesses and products, decide the best way to launch a product, unlock your company’s potential, or use your strengths to develop opportunities.
Strategy Map Template
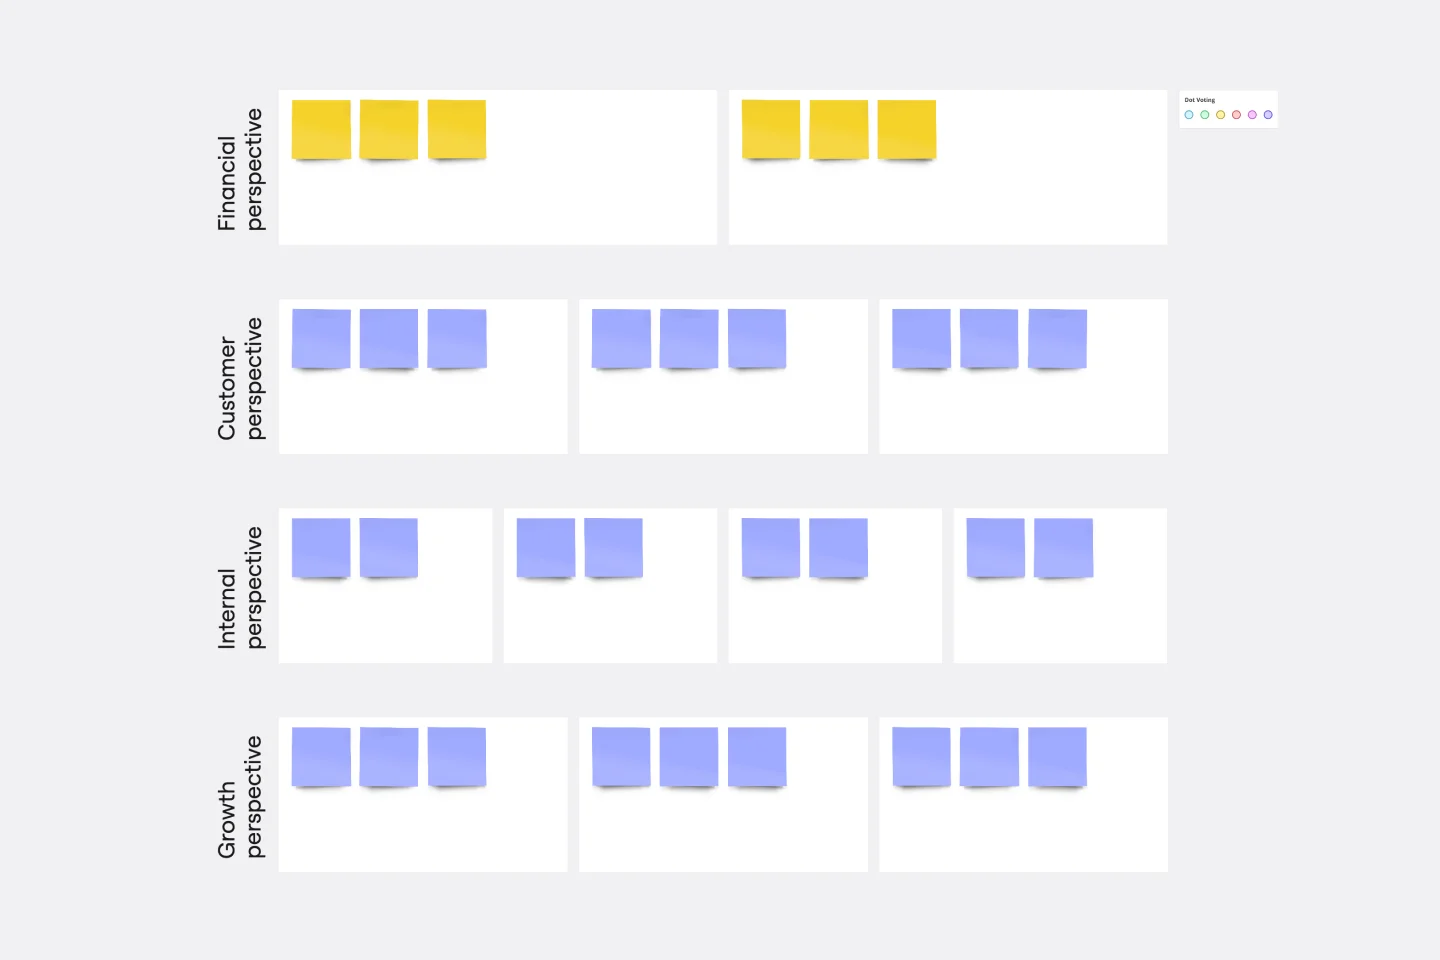
Strategy Map Template
How do your individual or team goals relate to an organization’s overall strategy? A Strategy Map is a stylized picture of your organization’s strategy and objectives. It’s powerful because it provides a clear visual guide to how these various elements work together. Strategy Maps can help align various different team goals with the overall strategy and mission. With the Strategy Map in place, teams can create set actionable, relevant KPIs. Strategy mapping is often considered part of the balanced scorecard (BSC) methodology, which is a strategic planning tool for setting overall team goals.
Impact/Effort Matrix Template
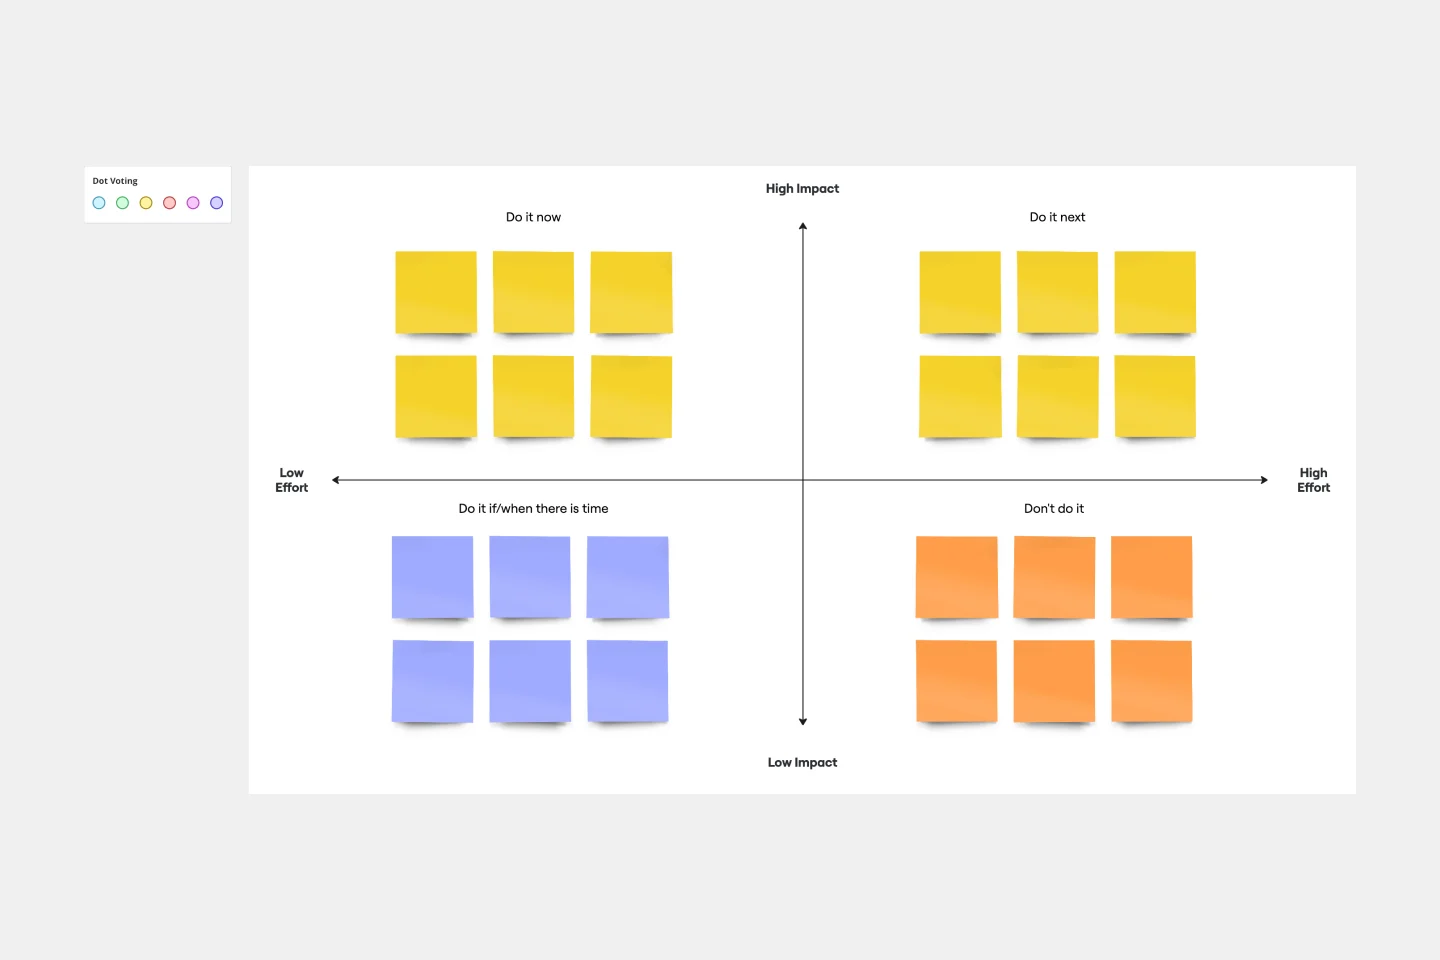
Impact/Effort Matrix Template
Growing organizations have countless to-do’s and only so many hours in a day (or weeks before a big launch) to get them done. That’s where an impact effort matrix comes in. It gives you a quick visual guide to help prioritize your tasks and know exactly what’s worth doing. Using our template, you can create a matrix that organizes your activities into four main categories: quick wins that are low effort, effort-intensive projects that provide long-term returns, fill-ins that are low effort but low value, and time-wasters.
SWOT Analysis Template
SWOT Analysis Template
When you’re developing a business strategy, it can be hard to figure out what to focus on. A SWOT analysis helps you hone in on key factors. SWOT stands for Strengths, Weaknesses, Opportunities, and Threats. Strengths and weaknesses are internal factors, like your employees, intellectual property, marketing strategy, and location. Opportunities and threats are usually external factors, like market fluctuations, competition, prices of raw materials, and consumer trends. Conduct a SWOT analysis whenever you want to explore opportunities for new businesses and products, decide the best way to launch a product, unlock your company’s potential, or use your strengths to develop opportunities.
Strategy Map Template
Strategy Map Template
How do your individual or team goals relate to an organization’s overall strategy? A Strategy Map is a stylized picture of your organization’s strategy and objectives. It’s powerful because it provides a clear visual guide to how these various elements work together. Strategy Maps can help align various different team goals with the overall strategy and mission. With the Strategy Map in place, teams can create set actionable, relevant KPIs. Strategy mapping is often considered part of the balanced scorecard (BSC) methodology, which is a strategic planning tool for setting overall team goals.
Impact/Effort Matrix Template
Impact/Effort Matrix Template
Growing organizations have countless to-do’s and only so many hours in a day (or weeks before a big launch) to get them done. That’s where an impact effort matrix comes in. It gives you a quick visual guide to help prioritize your tasks and know exactly what’s worth doing. Using our template, you can create a matrix that organizes your activities into four main categories: quick wins that are low effort, effort-intensive projects that provide long-term returns, fill-ins that are low effort but low value, and time-wasters.