Opportunity Canvas Template
Facilitate discussions about new features or capabilities.
About the Opportunity Canvas template
What is an Opportunity Canvas?
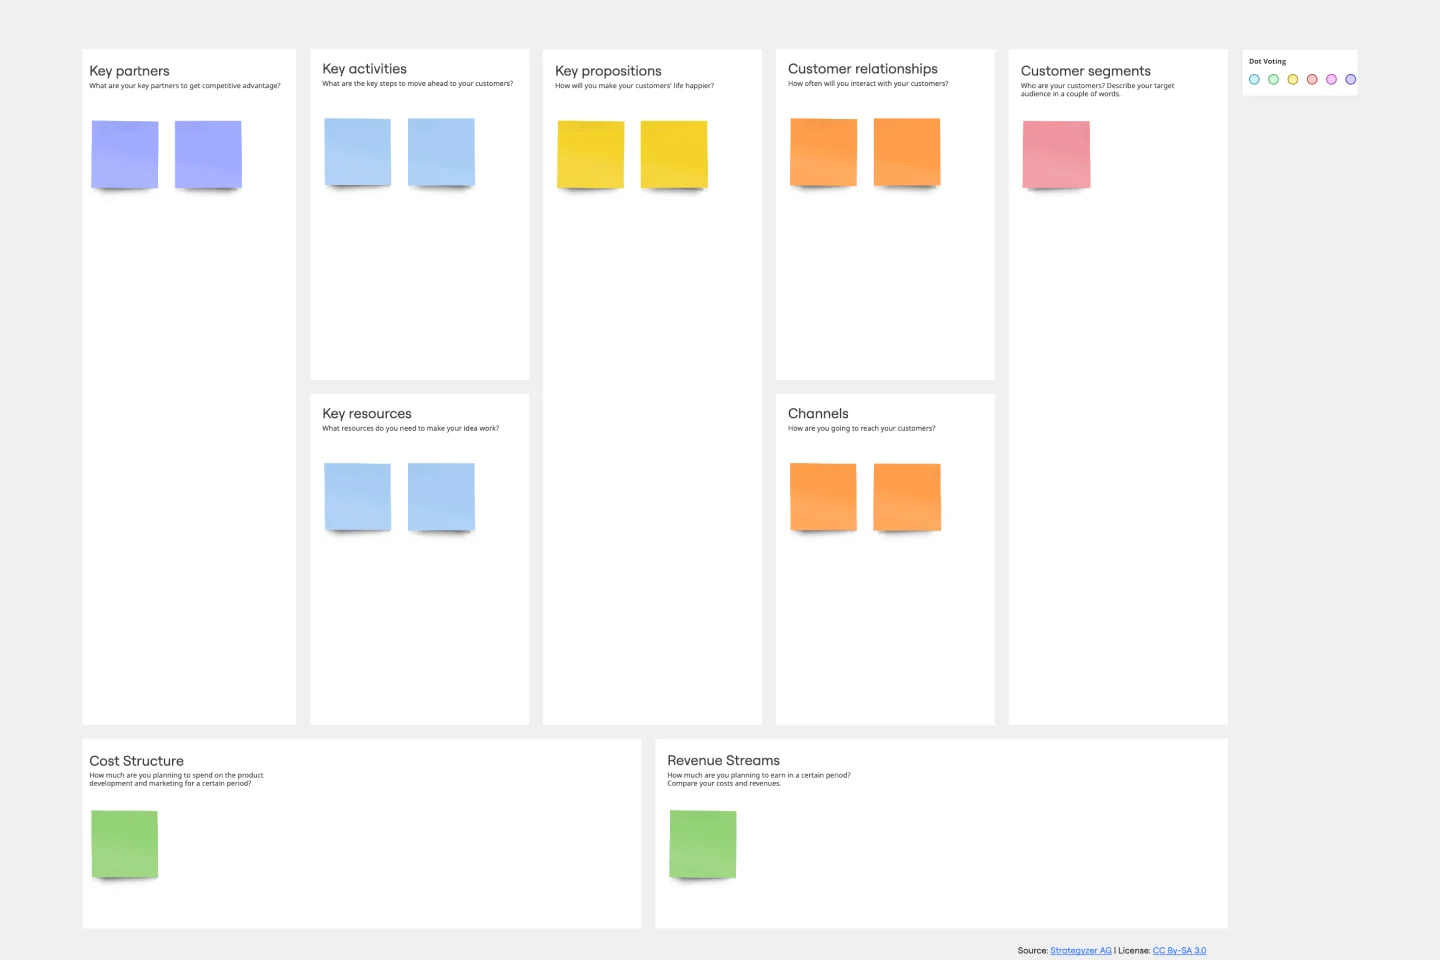
An Opportunity Canvas is a one-pager that helps facilitate discussion about a product’s features or capabilities. Much like the Business Model Canvas or Lean Canvas, the Opportunity Canvas helps you walk through how customers will use your solution, potential setbacks, strategies, challenges, and metrics. But unlike those other models, the Opportunity Canvas is designed for scenarios in which you have already built a product, so you don’t need to consider the operational or revenue model.
When should you use an Opportunity Canvas?
Use the Opportunity Canvas when you already have a product and you’d just like to examine new features or capabilities. If you don’t have a product or revenue model in place yet, you may find a Business Model Canvas or Lean Canvas more helpful.
How do you use the Opportunity Canvas template?
The pre-made Miro Opportunity Canvas is completely customizable—make any changes you’d like and invite your teammates to collaborate. Any changes they make will be reflected in real-time. Encourage people to add sticky notes (which can be color-coded so it’s easy to organize your ideas) and mention others to get their feedback. You can also have a video chat to work through the activities on the canvas with a distributed team.
How do you create an opportunity canvas?
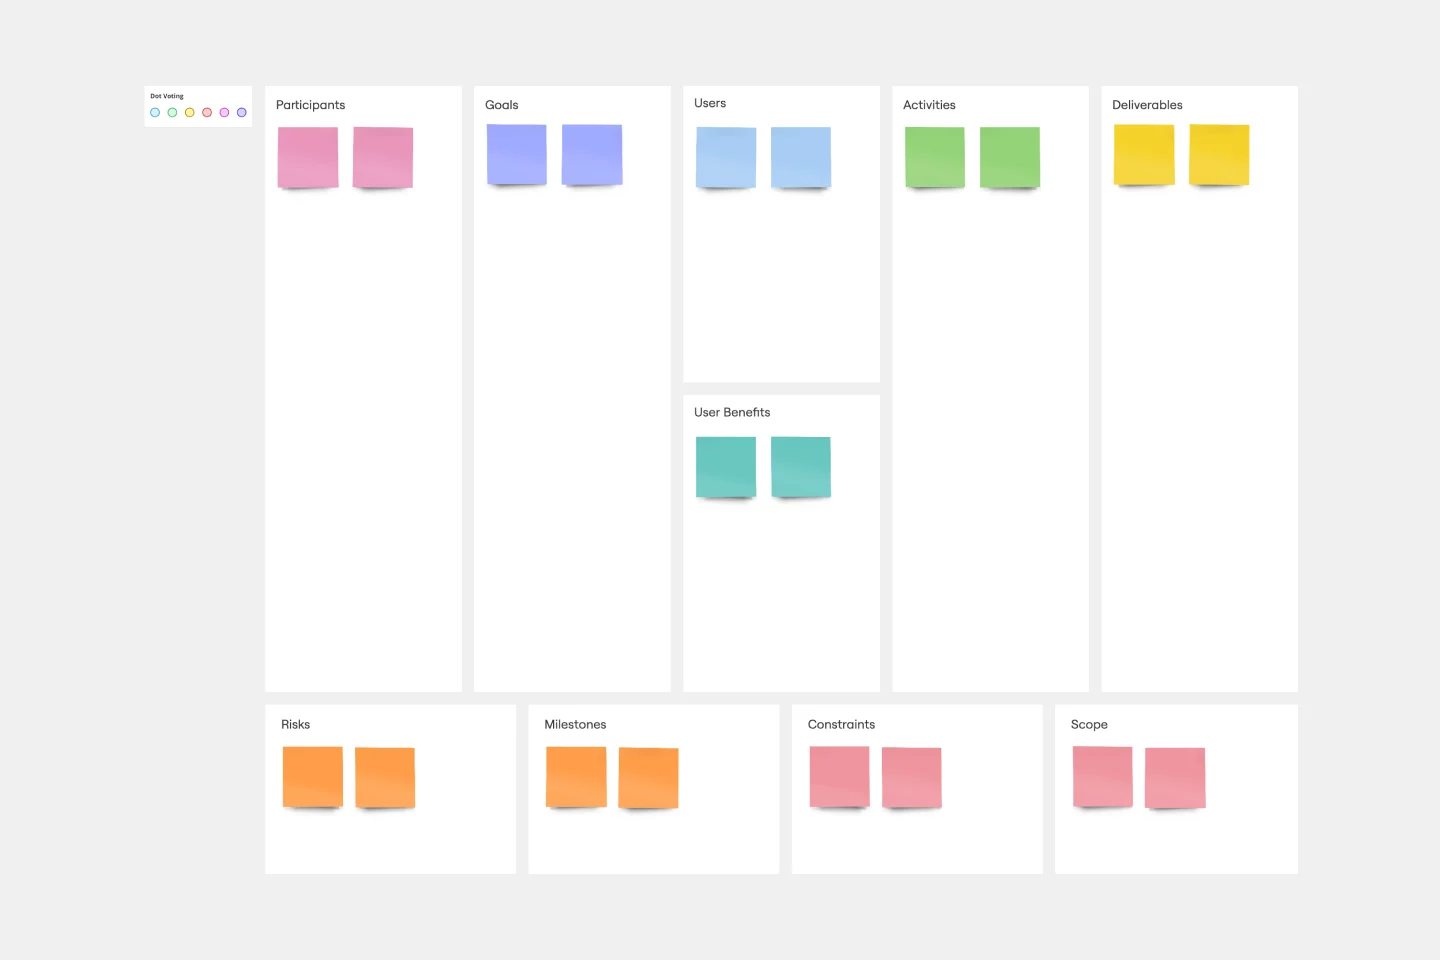
Step 1: Fill in your solution ideas. What product, features, or enhancements might solve a problem for your target audience?
Step 2: Consider your users and customers. What users or customers might have the problem that your solution seeks to address? What are their goals? Can you parse them into separate categories with various sub-goals?
Step 3: How are these users solving that problem today? Think about how they might use your product or service to do so, but also your competitors’.
Step 4: Consider the way in which these users’ challenges impact your business. If you don’t solve these problems for your customers, how will it hurt your business?
Step 5: If your customers already have your solution, then think about how and whether they are using it. What are they doing differently? How does it benefit them?
Step 6: Now brainstorm metrics. How can you tell whether your users are benefiting from your product or service? What measures might indicate that your business is succeeding?
Step 7: How will users adopt your product or service? Think about your adoption strategy: what you’re doing right and what you might do better.
Step 8: With that information in hand, it’s time to consider success. How will success move the needle for your business?
Step 9: Finally, think about your budget. What will it cost your organization if you are successful? What about if you are not?
Get started with this template right now.
Project Status Report Template
Works best for:
Project Management, Documentation, Project Planning
When a project is in motion, the project manager must keep clients and shareholders updated on the project’s progress. Rather than waste time with constant meetings, leaders can send out weekly or daily project status reports to keep everyone informed. You can use the Project Status Report Template to streamline the report creation and distribution process.
Random Words Template
Works best for:
Ideation, Brainstorming, Mind Mapping
Random word brainstorming is a simple, creative technique using random words to generate new ideas and creative solutions to your problems. Using random word prompts allows you to step beyond traditional boundaries and address challenges from a different direction. Random word brainstorming allows your team to unlock their creativity to solve business problems, create new inventions, improve existing ideas, or just think about problems in a new way.
Value Chain Template
Works best for:
Leadership, Strategic Planning, Workflows
First coined by Harvard Business School professor Michael Porter, the value chain analysis helps your team evaluate your business activities so you can find ways to improve your competitive advantage. A value chain is a set of activities that a company performs in order to deliver a valuable product from start to finish. The analysis itself allows your team to visualize all the business activities involved in creating the product—and helps you identify inefficiencies, bottlenecks, and miscommunication within the process.
Corrective Action Plan Template
Works best for:
Project Management, Operations, Strategic Planning
For a manager or HR leader, it’s the least fun part of the job: Documenting an employee’s performance issues and talking about them directly to that employee. A corrective action plan makes that tough task a little easier by putting issues into a professional, written framework. That way the process, next steps, and details of the conversations are all clearly documented. This template will enable you to eliminate murky communication, align on expectations, and provide step-by-step instructions for your employee.
Bull's Eye Diagram Template
Works best for:
Diagrams, Project Management, Prioritization
When you’re a growing organization, every decision can feel like it has make-or-break consequences—which can lead to decision paralysis, an inability to prioritize, inefficient meetings, and even low morale. If that sounds like you, put a Bull’s Eye Diagram to work. True to its name, a Bull’s Eye Diagram uses a model of concentric circles to help companies establish priorities, make critical decisions, or discuss how to remove or overcome obstacles.
Company Organizational Chart
Works best for:
Org Charts, Operations, Mapping
An org chart is a visual guide that sums up a company’s structure at a glance—who reports to whom and who manages what teams. But it does more than just display the chain of command. It also showcases the structure of different departments and informs employees who to reach out to with issues and concerns. That makes it an especially valuable tool for new hires who are getting familiar with the company. Our templates make it easy for you to add your entire team and customize the chart with colors and shapes.