Ansoff Matrix Template
Explore opportunities for growing your business with the Ansoff Matrix Template.
About the Ansoff Matrix template
When your business is doing well, it can be easy to slip into complacency. But if your organization is to keep growing and scaling, you’ll have to look for new ways to boost your bottom line and reach new customers. The Ansoff Matrix, also known as the product or market expansion grid, can help you do just that.
An Ansoff Matrix is a strategic tool that allows you to evaluate numerous options for growing your business. It helps you evaluate the potential risks of each option and to devise a plan that fits your specific organization. Igor Ansoff developed the matrix in 1957, and since then, numerous business leaders have used it to jumpstart their business’s growth.
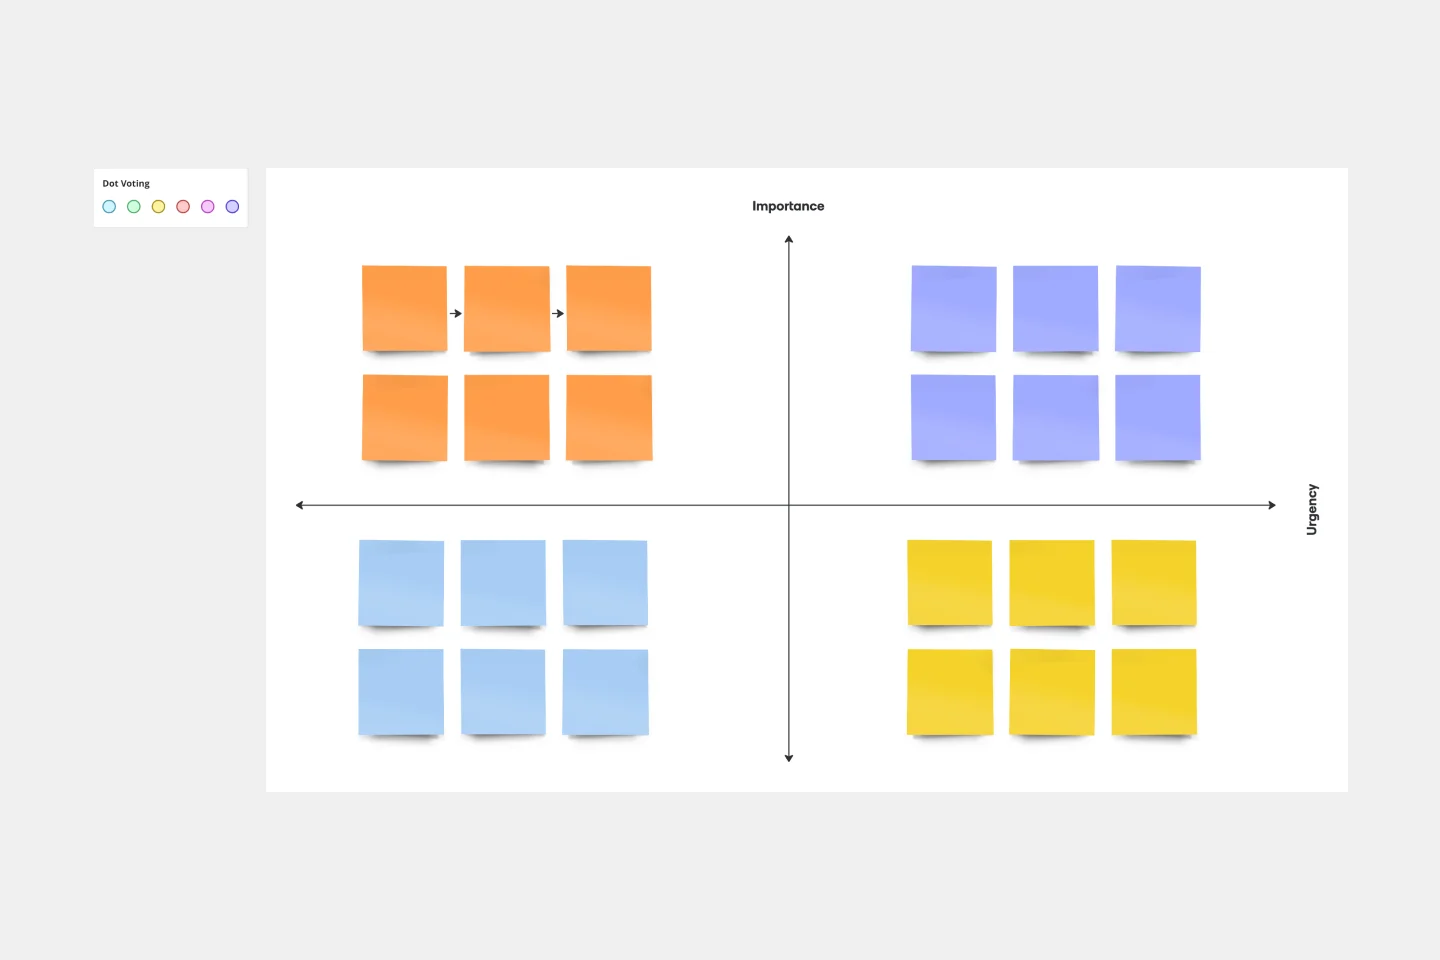
While there are some variations, the typical Ansoff Grid contains four quadrants. Each quadrant contains a potential growth strategy. Whenever you move into a new quadrant, either horizontally or vertically, your risk increases.
How do you use the Ansoff Matrix?
The Ansoff Matrix is divided into four sections that place markets and products/services depending on whether they already exist or represent a future opportunity. The four sections are market penetration, market development, product development, and diversification. Market penetration refers to selling more of your products and services to existing customers, market development refers to entering new markets, product development refers to developing your existing products or services, and diversification refers to moving into new markets with new products and services, increasing sales with your existing customer base, and acquisition. Go through each section with your team and determine where there are areas for making changes or improvements.
When should you use the Ansoff Matrix?
You should use the Ansoff Matrix whenever you do strategic planning for your marketing organization. You may find it beneficial to fill out the matrix at least once a year, though potentially more frequently if conditions are changing rapidly in your industry.
What factors go into an Ansoff Matrix?
Factor 1 - Market penetration. The lower left quadrant contains the safest of the four options. Market penetration focuses on boosting sales of your product in your existing market. This is a low-risk option because you already know the market and you’re aware of your product’s strengths and weaknesses relative to your competitors.
Factor 2 - Product development. The lower right quadrant is slightly more risky. In this approach, you’re introducing a new product into your existing market.
Factor 3 - Market development. The upper left quadrant is even riskier. In this case, you’re launching an existing product in a new market. This strategy involves either finding a new use case for your product or adding features so that it meets a different customer need.
Factor 4 - Diversification. The upper right quadrant contains the riskiest option. You’re introducing a new product into a new market.
Get started with this template right now.
PDCA Template
Works best for:
Planning
The PDCA template provides a visually compelling representation of the Plan-Do-Check-Act cycle, a foundational management methodology. Structured around four primary segments, this template helps teams systematically address challenges, test solutions, assess outcomes, and make necessary refinements. Using the PDCA template fosters continuous improvement. By cycling through each phase repeatedly, organizations can perpetually refine their strategies, ensuring they always move towards optimal solutions and processes.
Corrective Action Plan Template
Works best for:
Project Management, Operations, Strategic Planning
For a manager or HR leader, it’s the least fun part of the job: Documenting an employee’s performance issues and talking about them directly to that employee. A corrective action plan makes that tough task a little easier by putting issues into a professional, written framework. That way the process, next steps, and details of the conversations are all clearly documented. This template will enable you to eliminate murky communication, align on expectations, and provide step-by-step instructions for your employee.
Kaizen Report Template
Works best for:
Agile Methodology, Operations, Documentation
What makes a great company great? They know that greatness needs to be fostered and maintained — meaning they never stop working to improve. If you’re one of those companies (or aspire to be), a kaizen report is an ideal tool. It creates a simple visual guide to continuous improvement activities on a team, departmental, and organizational level. Using a kaizen report approach, every employee in an organization audits their own processes and understands what they might have overlooked, making this a powerful tool for increasing accountability at all levels.
Entity–Relationship Diagram (ERD) HR Management System Template
Works best for:
ERD
The Entity–Relationship Diagram (ERD) HR Management System Template in Miro is designed to streamline the management of employee-related information and processes within an organization. This template allows for the visualization and organization of complex HR systems, making it easier to understand relationships and processes. It enables users to map out departments, positions, and employee details, including attendance records, payroll, and performance reviews.
Incident Management Process Flowchart Template
The Incident Management Process Flowchart Template in Miro is designed to streamline and clarify the process of managing incidents within an organization. This template serves as a visual guide that outlines the steps involved in incident management, from the initial declaration to the final review. It is a living document, continuously evolving based on feedback and lessons learned from past incidents, ensuring that the process remains up-to-date with best practices. By defining incidents as disruptions requiring a coordinated response to restore service levels, the template emphasizes the importance of a structured, organized, and timely approach. It covers various phases such as Incident Declaration, Assessment, Response, Communication, and Review, providing a clear framework for teams to follow.
Fishbone Diagram for Marketing
Works best for:
Fishbone Diagram
Optimizing marketing strategies requires identifying underlying issues. The Fishbone Diagram Marketing template helps you systematically explore factors affecting your campaigns. Categorize potential causes into areas such as market research, product positioning, promotional strategies, and distribution channels. This structured analysis enables your team to pinpoint and address issues, enhancing marketing effectiveness and achieving better results.