
Concept map templates
Visualize ideas and connections effortlessly with our concept map templates. Provide teams with the tools they need to organize thoughts, explore relationships, and bring complex concepts to life with clarity and creativity.

Venn Diagram for Learning and Education
Works best for:
Venn Diagram
Enhance learning and teaching with the Venn Diagram for Learning and Education template. Use it to compare concepts, illustrate relationships, and facilitate discussions. This template helps students and educators organize information visually, making complex ideas easier to understand and retain. It's an excellent tool for classrooms, study groups, and professional training sessions, promoting deeper understanding and active learning.
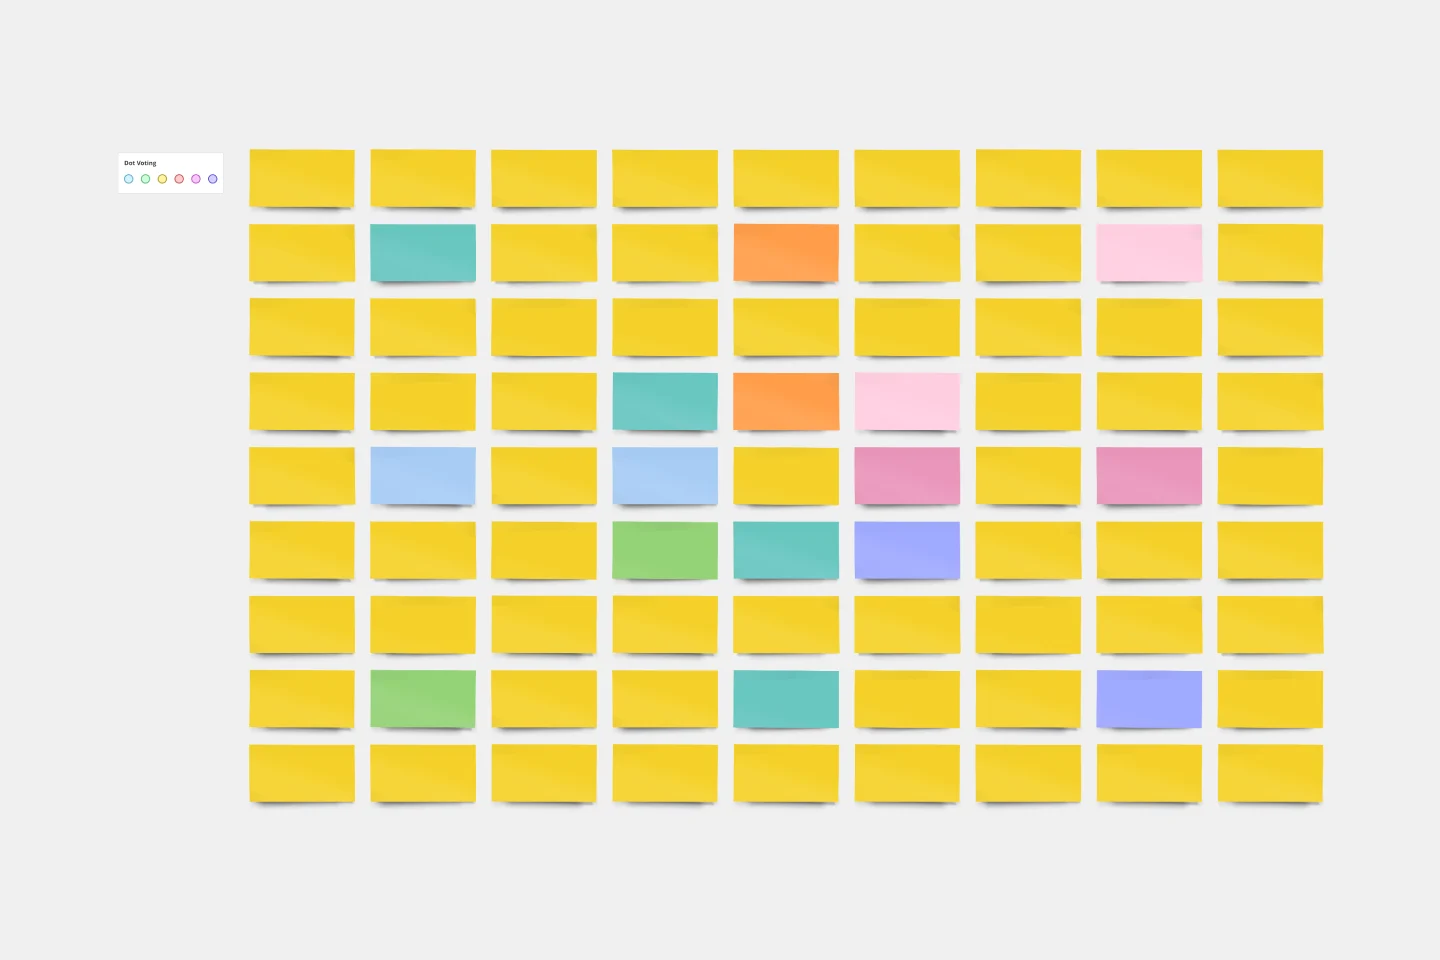
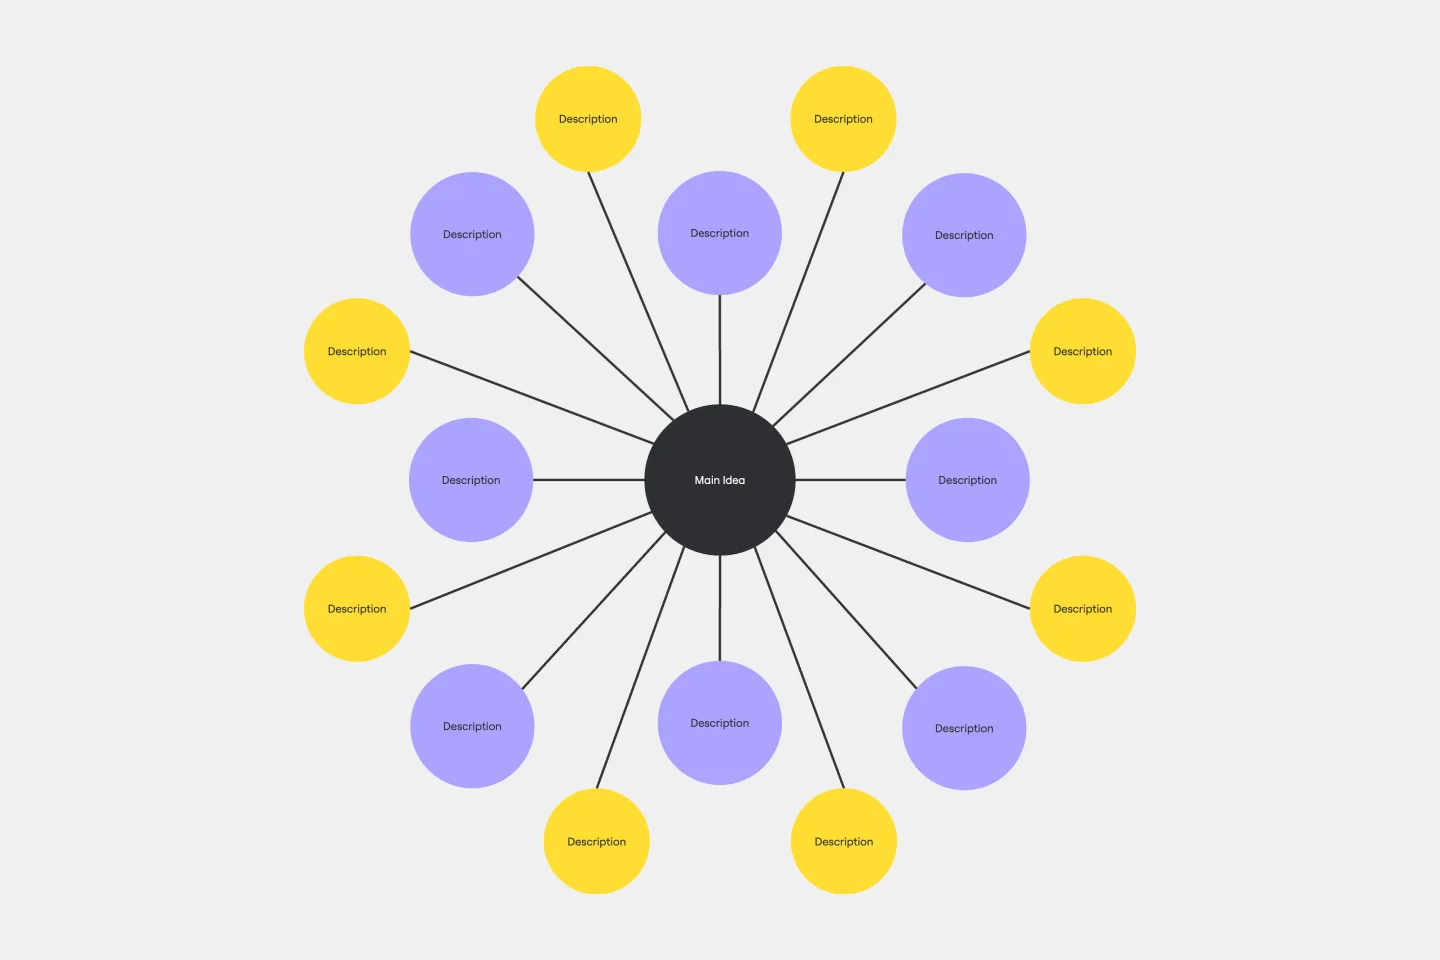
Lotus Diagram Template
Works best for:
UX Design, Ideation, Diagrams
Even creative thinkers occasionally need help getting their creative juices flowing. That's where a lotus diagram comes in. It'll empower you to run smoother, more effective brainstorming sessions. This creative-thinking technique explores ideas by putting the main idea at the diagram center and ancillary concepts in the surrounding boxes. This template gives you an easy way to create Lotus Diagrams for brainstorms, as well as an infinite canvas for the endless ideas generated.
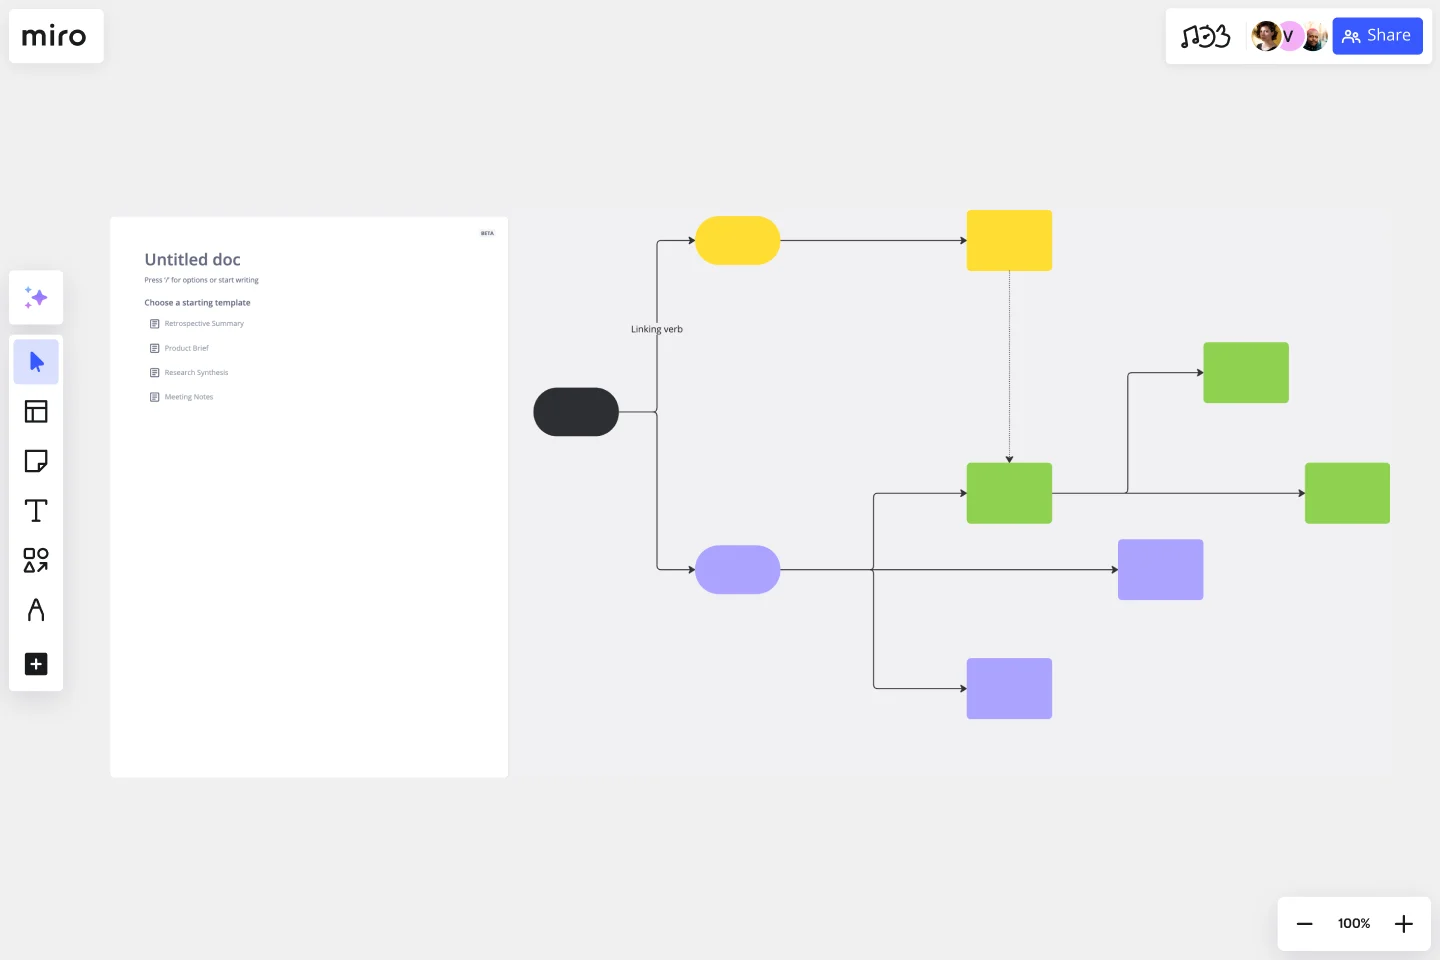
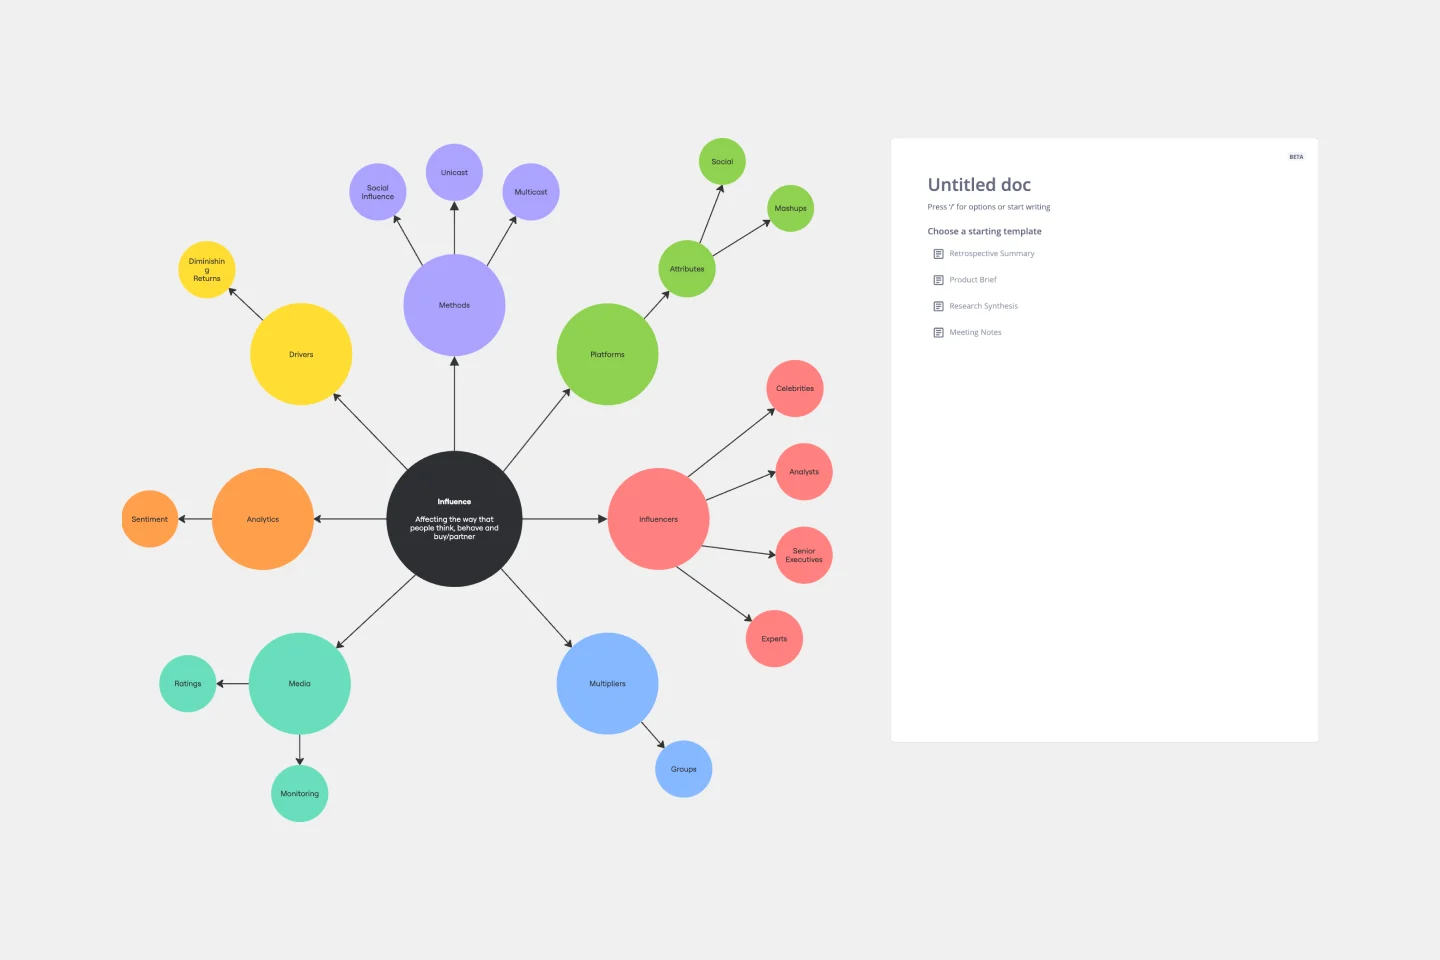
Concept Map Template
Works best for:
Education, Mapping, Brainstorming
Use the concept map template to create new ideas, structure your thoughts, and bring your innovations to life. It allows you to explore connections between concepts and let your creativity flow in an organized format. As a result, you’re able to visualize how to bring your new ideas to reality and how various concepts relate to each other.
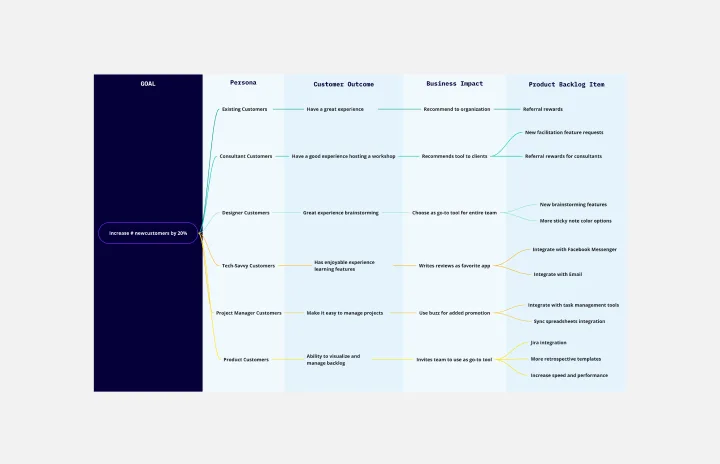
Outcome Mapping Template
Works best for:
Diagrams, Mapping, Project Management
Use Miro’s outcome mapping template to improve your operational efficiency. Outcome mapping will help you visualize all the possible strategic outcomes for your upcoming project, allowing you to see into the black box to identify any potential challenges along the way.
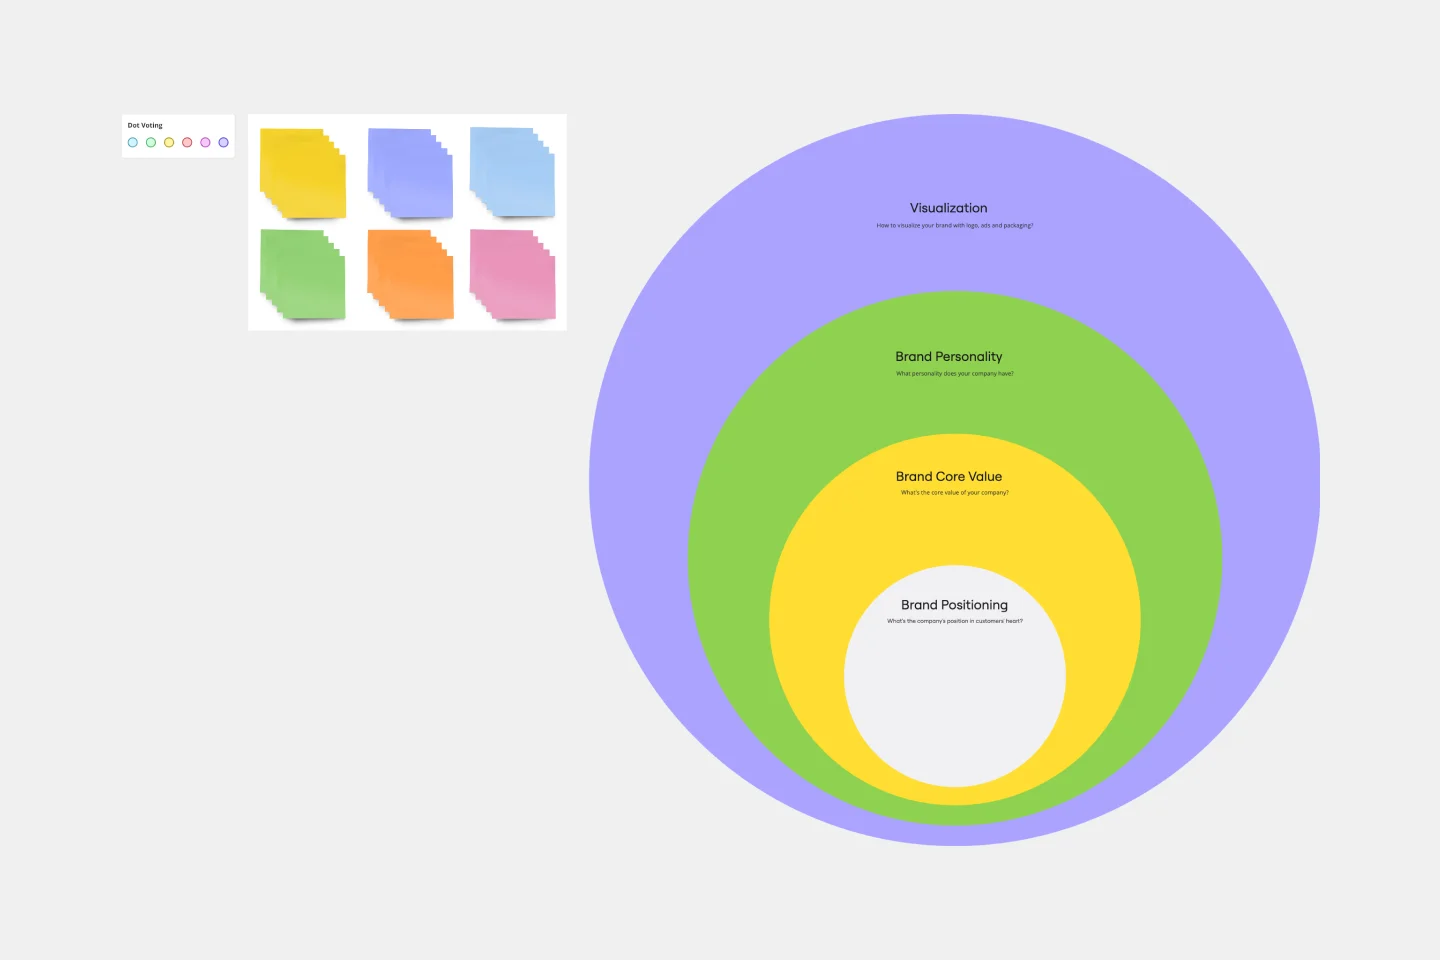
Onion Diagram Template
Works best for:
Diagramming, Mapping and Diagramming
The Onion Diagram Template is a distinct tool designed to visually represent layers of a specific concept, system, or process, akin to the layers of an onion. Each concentric layer of the diagram provides insights into a different aspect or phase of the topic at hand, moving from the core foundational element outwards to more peripheral components. One of the prime benefits of this template is its ability to offer hierarchical clarity. Users can immediately discern the importance, sequence, or interrelation of different elements within a system, facilitating enhanced comprehension and efficient decision-making.
Cluster Diagram Template
Works best for:
Diagramming
The Cluster Diagram Template is a valuable tool for organizing and connecting ideas, concepts, and information in a visually compelling and coherent manner. The template's design centers on grouping related ideas around a core concept, creating a transparent and hierarchical structure. This clustering not only aids in breaking down complex information into manageable segments but also significantly enhances the process of idea generation and brainstorming. A structured yet flexible visual framework encourages deeper engagement and more precise understanding, making it an essential asset for teams and people looking to bring order to their creative and analytical processes.
Bubble Map Template
Works best for:
Diagramming, Mapping, Brainstorming
A Bubble Map Template is a visual organization tool that uses bubbles or circles to represent various ideas or data points. These bubbles are linked together, displaying their relationships and creating a network of interconnected thoughts. Use a Bubble Map Template to streamline complex information, enhancing comprehension and promoting efficient decision-making.
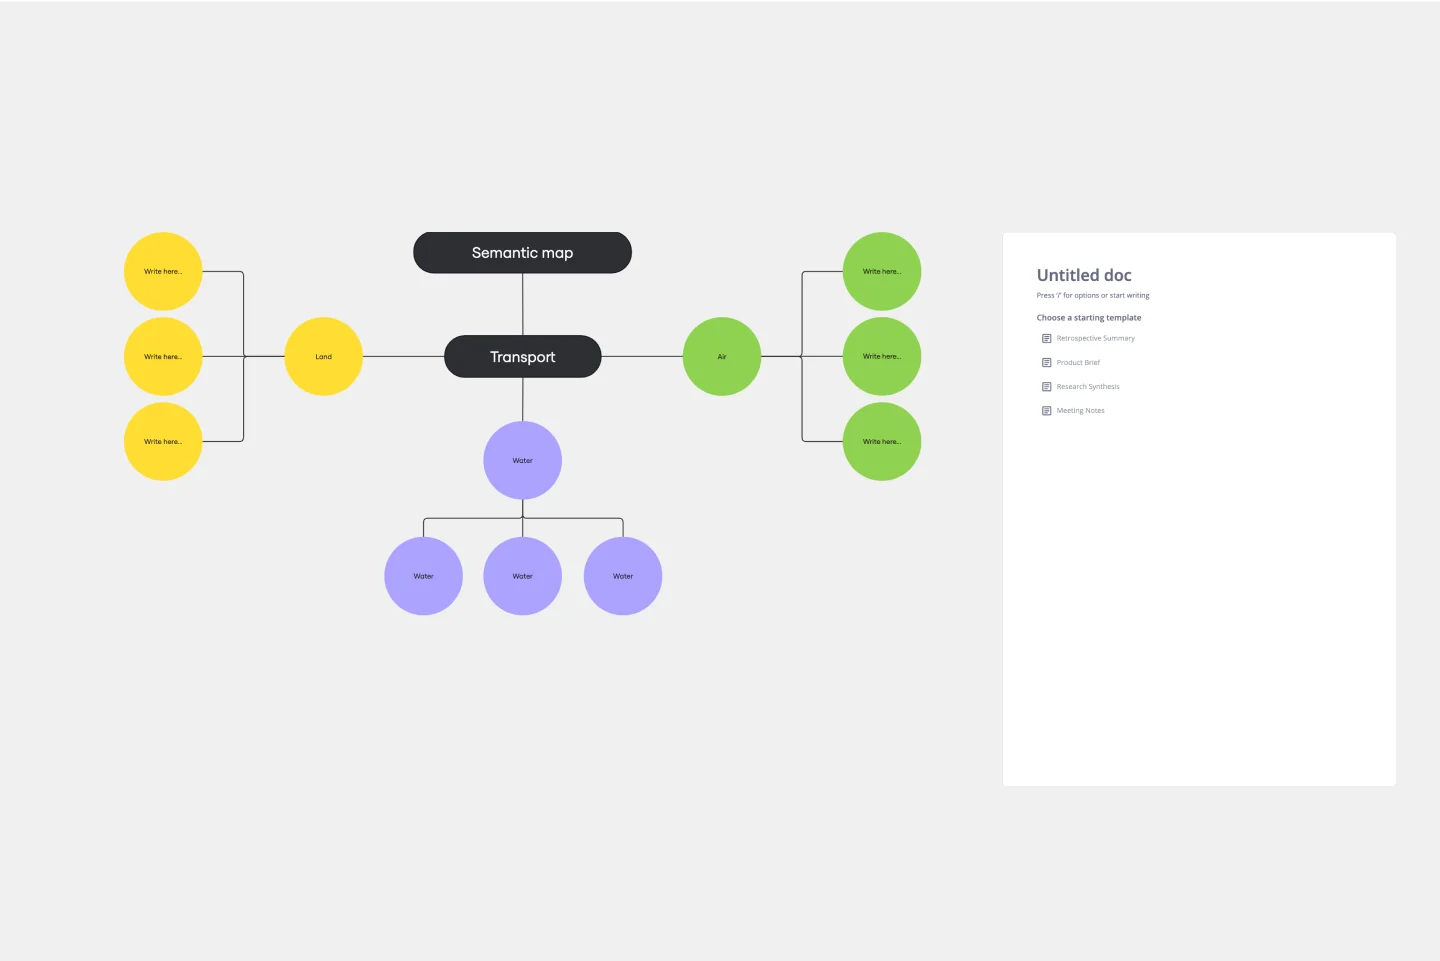
Semantic Map Template
Works best for:
Brainstorming
The Semantic Map Template is a helpful tool that helps teams efficiently process and structure complex information. Its intuitive design promotes shared understanding, allowing multiple users to contribute and refine ideas simultaneously. This collaborative approach streamlines brainstorming sessions and creates a synergistic environment where collective intelligence thrives. By visually mapping out concepts and their interconnections, the template ensures that every team member is on the same page, which improves group dynamics and leads to more cohesive and comprehensive outcomes. The Semantic Map Template is a valuable tool for team-based project management and learning, thanks to its ability to foster collaboration and enhance productivity.
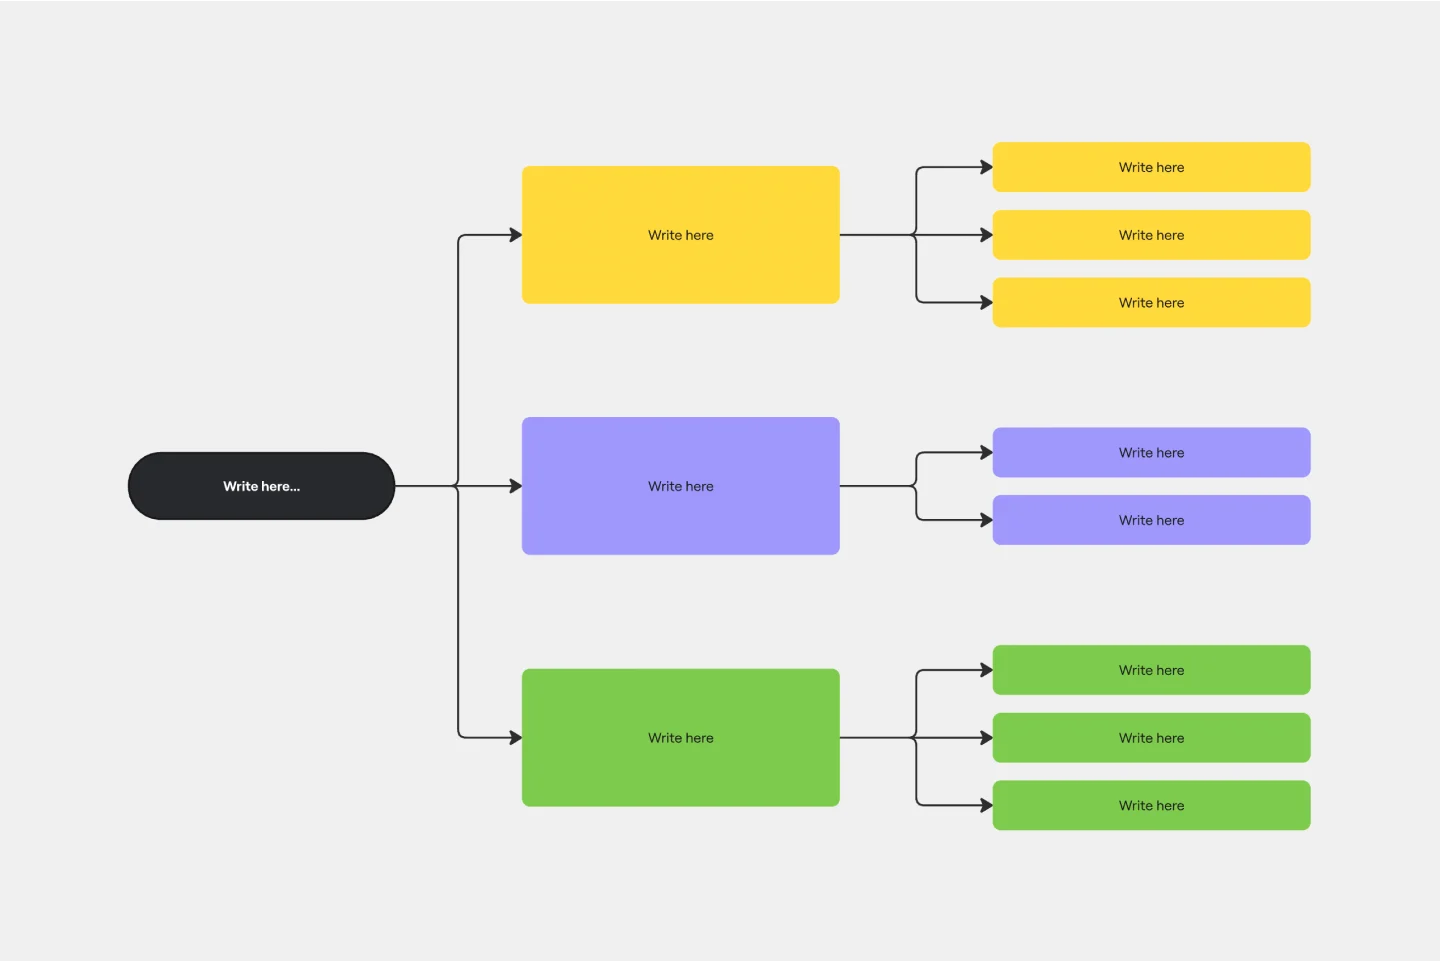
Brace Map Template
Works best for:
Diagramming, Planning
Transform your brainstorming and planning tasks with Miro's Brace Map Template. This powerful visual thinking tool clarifies complex concepts by creating a visual hierarchy that organizes each element precisely. The central idea connects seamlessly to sub-elements through intuitive braces, providing an easily understandable framework. This clarity enhances individual understanding and fosters collaborative efforts, allowing teams to navigate complex ideas with precision and coherence. The Brace Map Template will enable you to organize your thoughts efficiently and solve complexities visually.
Join thousands of teams collaborating and doing their best work on Miro.
Sign up freeAbout the Concept Map Templates Collection
Concept maps are powerful for visualizing relationships between ideas, concepts, or pieces of information. Our concept map templates collection offers a variety of editable concept map templates designed to help your team brainstorm, plan, and organize their projects effectively. These templates are adaptable and can be customized to fit the specific needs of any project, making them an essential resource for anyone looking to improve their collaborative efforts.
What are concept maps used for?
Teams use concept maps for everything, from brainstorming new product ideas to organizing complex research projects. Think of them as visual roadmaps for your thoughts. They're especially handy when you're dealing with a lot of information and need a clear way to see the connections between different ideas. Whether you're planning a marketing campaign, mapping out a software feature, or just trying to get your thoughts in order, concept maps can be a game-changer. They help with:
Brainstorming: A blank concept map template can be a fantastic springboard for generating new ideas. Start with a central topic and branch out with related concepts, allowing your thinking to flow freely.
Knowledge management: Concept mapping is a powerful way to organize and visualize information. It helps you see the big picture and understand how different pieces of knowledge fit together.
Problem-solving: When facing a complex problem, a concept chart template can help you break it down into smaller, more manageable parts. This makes it easier to identify the root causes and find effective solutions.
Project planning: Teams use concept maps to plan projects, define tasks, and track progress. It helps everyone stay on the same page and understand their roles.
Gaining insights: Concept mapping helps identify patterns, trends, and connections that might not be obvious otherwise. This can lead to valuable insights and better decision-making.
By using concept maps, teams clarify thinking and foster collaboration. They use concept map tools to visualize and organize complex ideas, making them ideal for knowledge mapping and idea visualization. Whether starting with a blank concept map template or using conceptual map templates, teams find these visual aids invaluable for creative thinking techniques. This helps them improve communication, gain insights, and plan projects more effectively. Concept maps help teams break down complex information, fostering a shared understanding and facilitating better decision-making.
Why you'll love our concept map templates
Using our concept map templates can significantly improve your project planning and idea generation processes. Here are some detailed benefits:
Enhanced visualization: Concept maps provide a clear visual representation of complex ideas, making it easier to understand and communicate relationships between different concepts.
Improved collaboration: Miro's editable concept map templates allow multiple team members to contribute and edit in real time, fostering a collaborative environment.
Time efficiency: Pre-designed templates save time by providing a structured starting point, allowing teams to focus on content rather than design.
Flexibility: The templates are fully customizable, enabling users to adjust them according to their specific project requirements.
Accessibility: Miro's platform is accessible from anywhere, making it easy for remote teams to work together seamlessly.
Free resources: Miro offers a free concept map template, allowing users to explore the benefits without any initial investment.
How to use the concept map templates in Miro
Using Miro's concept map templates is straightforward. Follow these steps to get started:
Select a template: Browse through Miro's collection of concept map templates and choose one that best fits your project needs.
Customize the template: Use Miro's intuitive editing tools to customize the template. Add, remove, or change nodes and connections to reflect your ideas accurately.
Collaborate with your team: Invite team members to join the board. They can add their input, make edits, and provide feedback in real time.
Organize information: Arrange the concepts logically, ensuring that the relationships between them are clear and easy to follow.
Review and refine: Regularly review the concept map with your team to ensure it remains aligned with your project goals. Make adjustments as necessary.
Share and present: Once the concept map is complete, share it with stakeholders or use it as a visual aid in presentations to communicate your ideas effectively.
By following these steps, you can use Miro's concept map templates to streamline your project planning and idea generation processes, ultimately helping your team to thrive.