
Gantt Chart for Project Scheduling
A Gantt chart is a project management tool that helps in planning, scheduling, and monitoring a project.
A Gantt chart is a project management tool that helps in planning, scheduling, and monitoring a project.
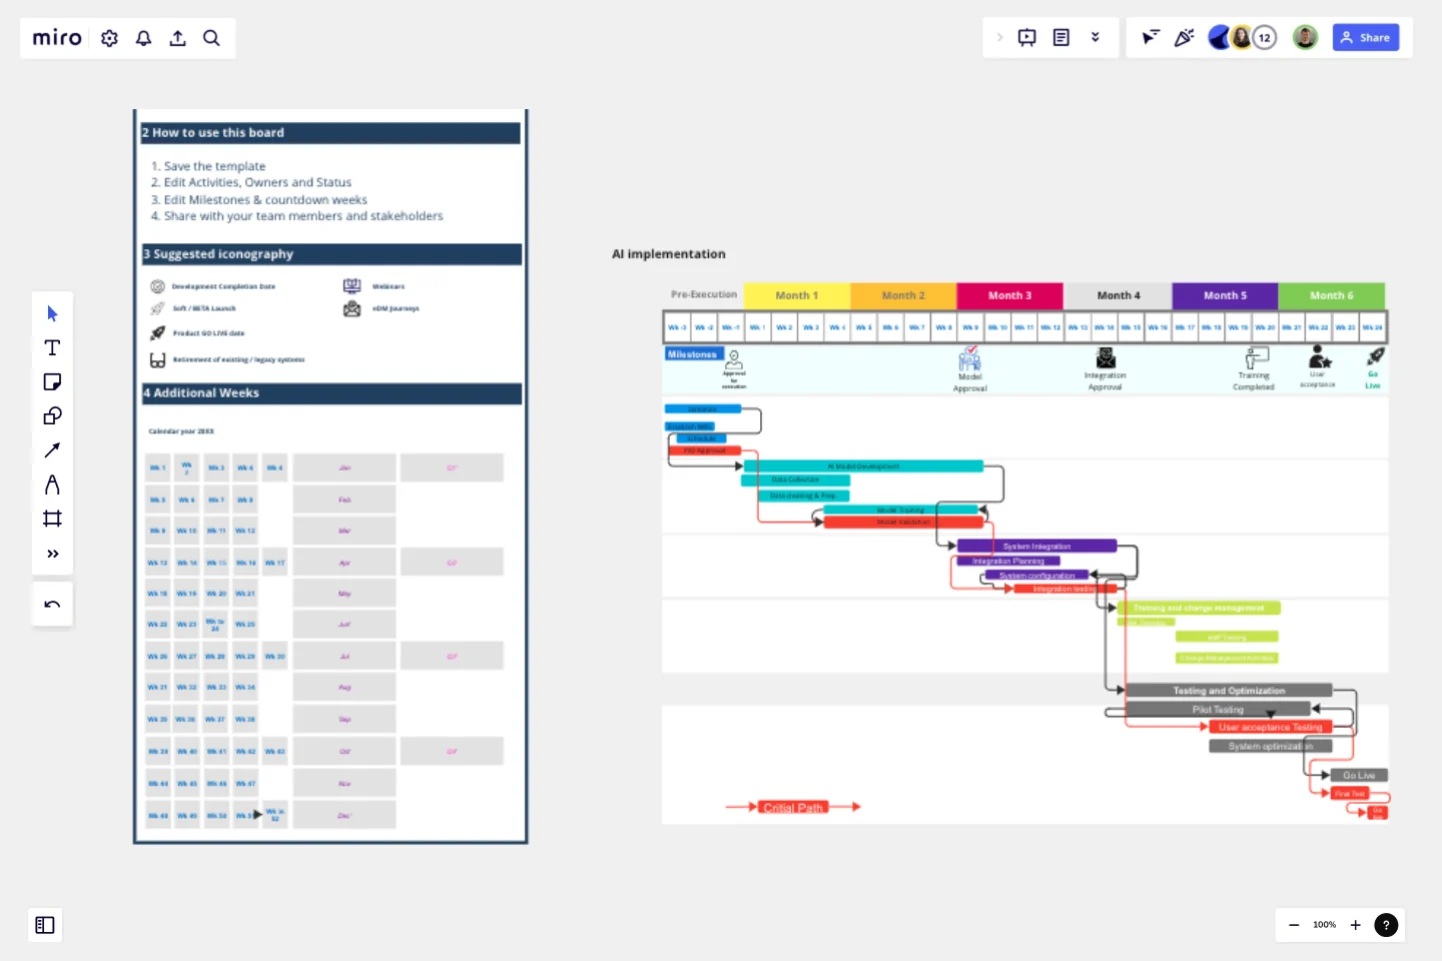
A Gantt chart is a horizontal bar chart used to display the start date and duration of each task that makes up a project.
It represents all information visually through a horizontal bar graph.
Project managers and team members can view the task schedules, dependencies, and progress by just glancing at the chart.
Components:
Y-axis: Represents the tasks in the project.
X-axis: Represents the duration of each task.
Bars: Each task is represented by a bar, and the length of the bar indicates its duration.
Overlapping Bars: If two bars overlap on the X-axis, they occur simultaneously.
Get started with this template right now.
Thematic Roadmapping (Vision & Strategy)
Works best for:
Roadmap, Planning, Mapping
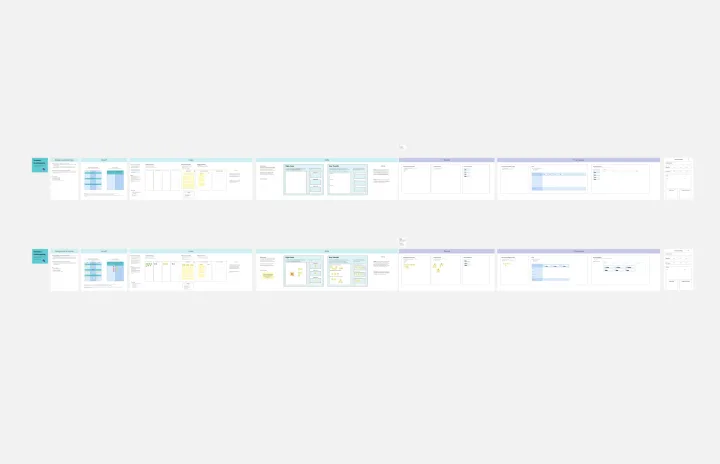
The Thematic Roadmapping (Vision & Strategy) template empowers organizations to align their vision with actionable strategies. By identifying key themes and strategic objectives, teams can develop a roadmap that guides decision-making and resource allocation. This template facilitates cross-functional collaboration and ensures that initiatives are aligned with overarching goals, leading to more focused and impactful execution.
Brand Strategy Workshop
Works best for:
Marketing
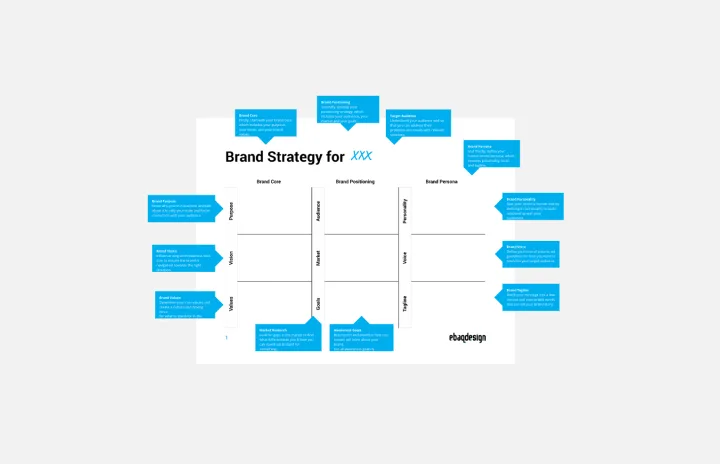
Develop a brand strategy for new and existing brands with this fully guided Brand Strategy Template. Find new ways to build your brand and set your business up for success.
Event Brief Template
Works best for:
Meetings, Workshops, Project Planning
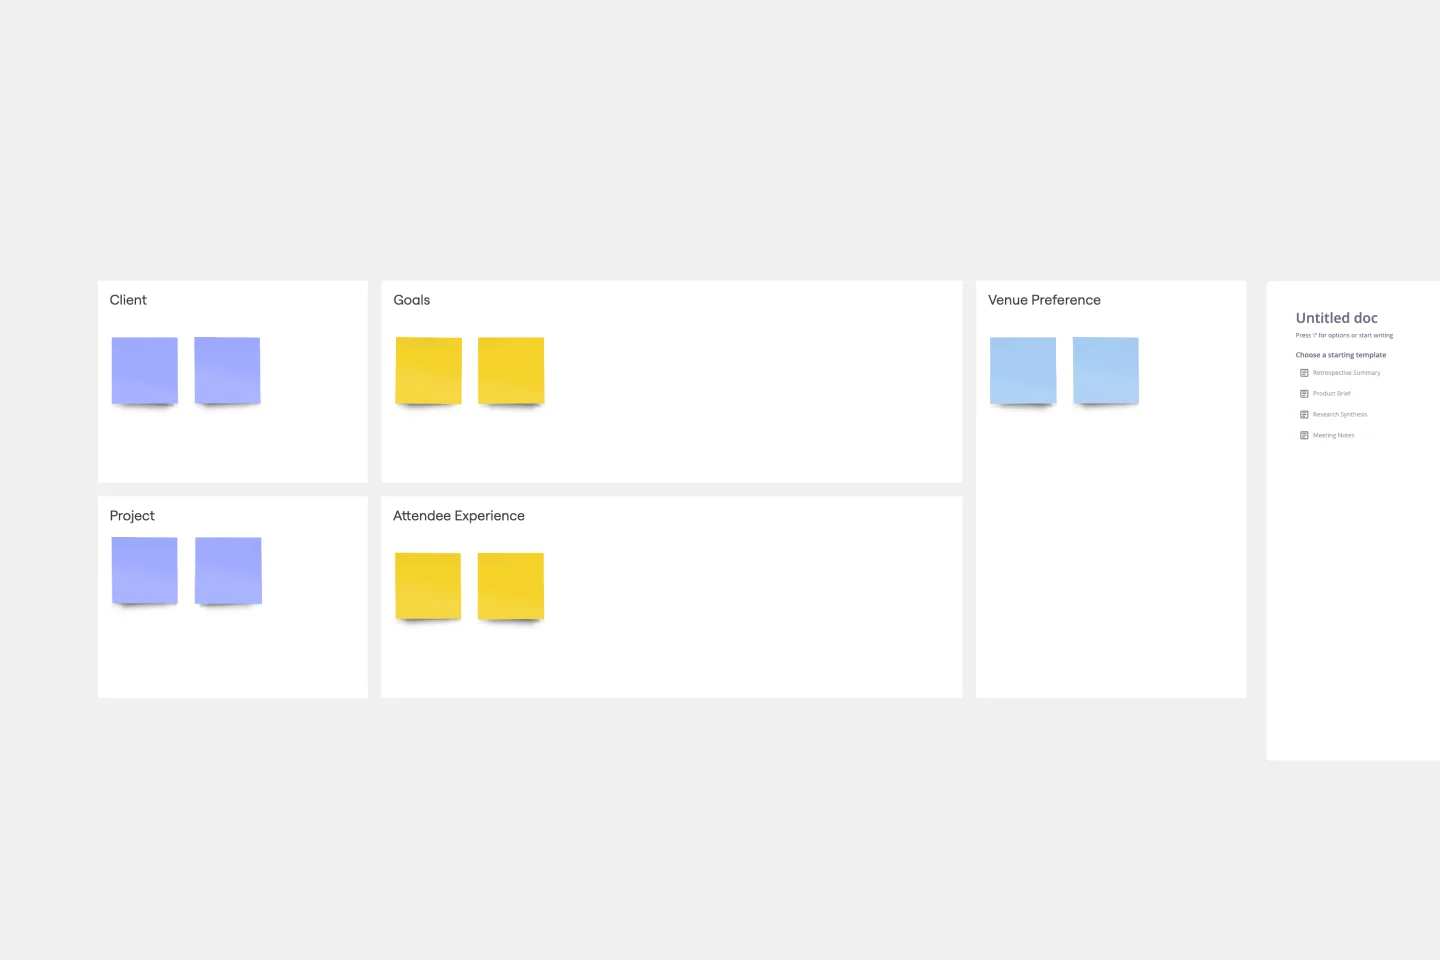
For most any organization, throwing a big deal event is…a big deal. An event can bring in publicity, new clients, and revenue. And planning it can require a substantial chunk of your overall resources. That’s why you’ll want to approach it like a high-stakes project, with clearly outlined goals, stakeholders, timelines, and budget. An event brief combines all of that information in a single source of truth that guides the events team, coordinator, or agency—and ensures the event is well-planned and well-executed.
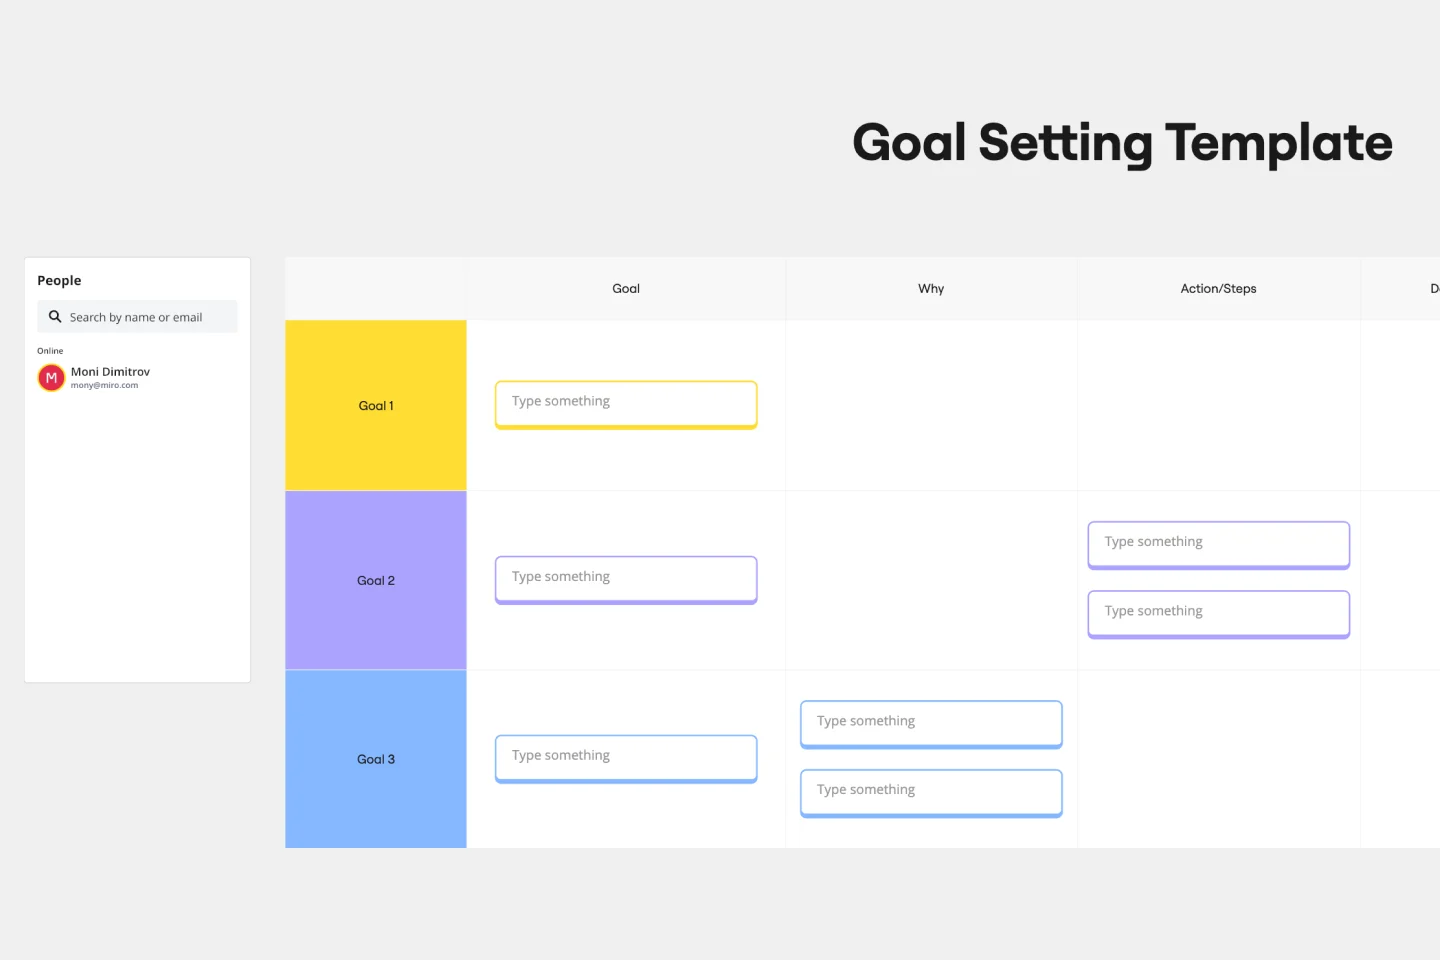
Goal Setting Template
Works best for:
Strategic Planning
The Goal Setting Template simplifies the process and fosters strategic thinking. It includes key fields such as goal articulation, rationale, action steps, and blockers. This promotes accountability with a "Date Started" field and a clear deadline. The template turns aspirations into actionable plans with a heightened sense of accountability.
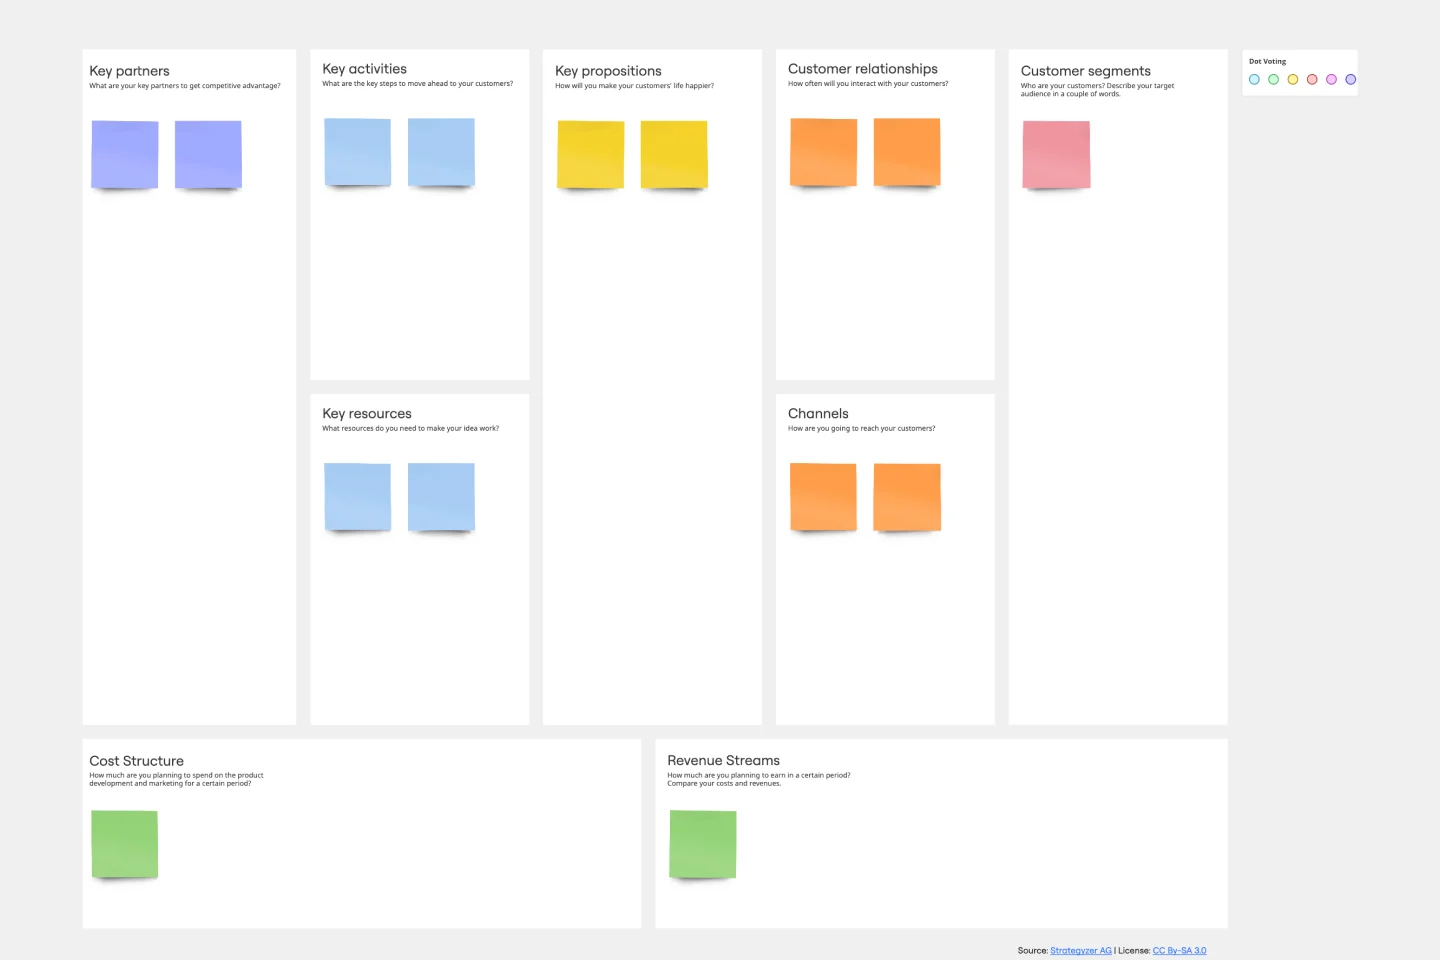
Business Model Canvas Template
Works best for:
Leadership, Agile Methodology, Strategic Planning
Your business model: Nothing is more fundamental to who you are, what you create and sell, or ultimately whether or not you succeed. Using nine key building blocks (representing nine core business elements), a BMC gives you a highly usable strategic tool to develop and display your business model. What makes this template great for your team? It’s quick and easy to use, it keeps your value proposition front and center, and it creates a space to inspire ideation.
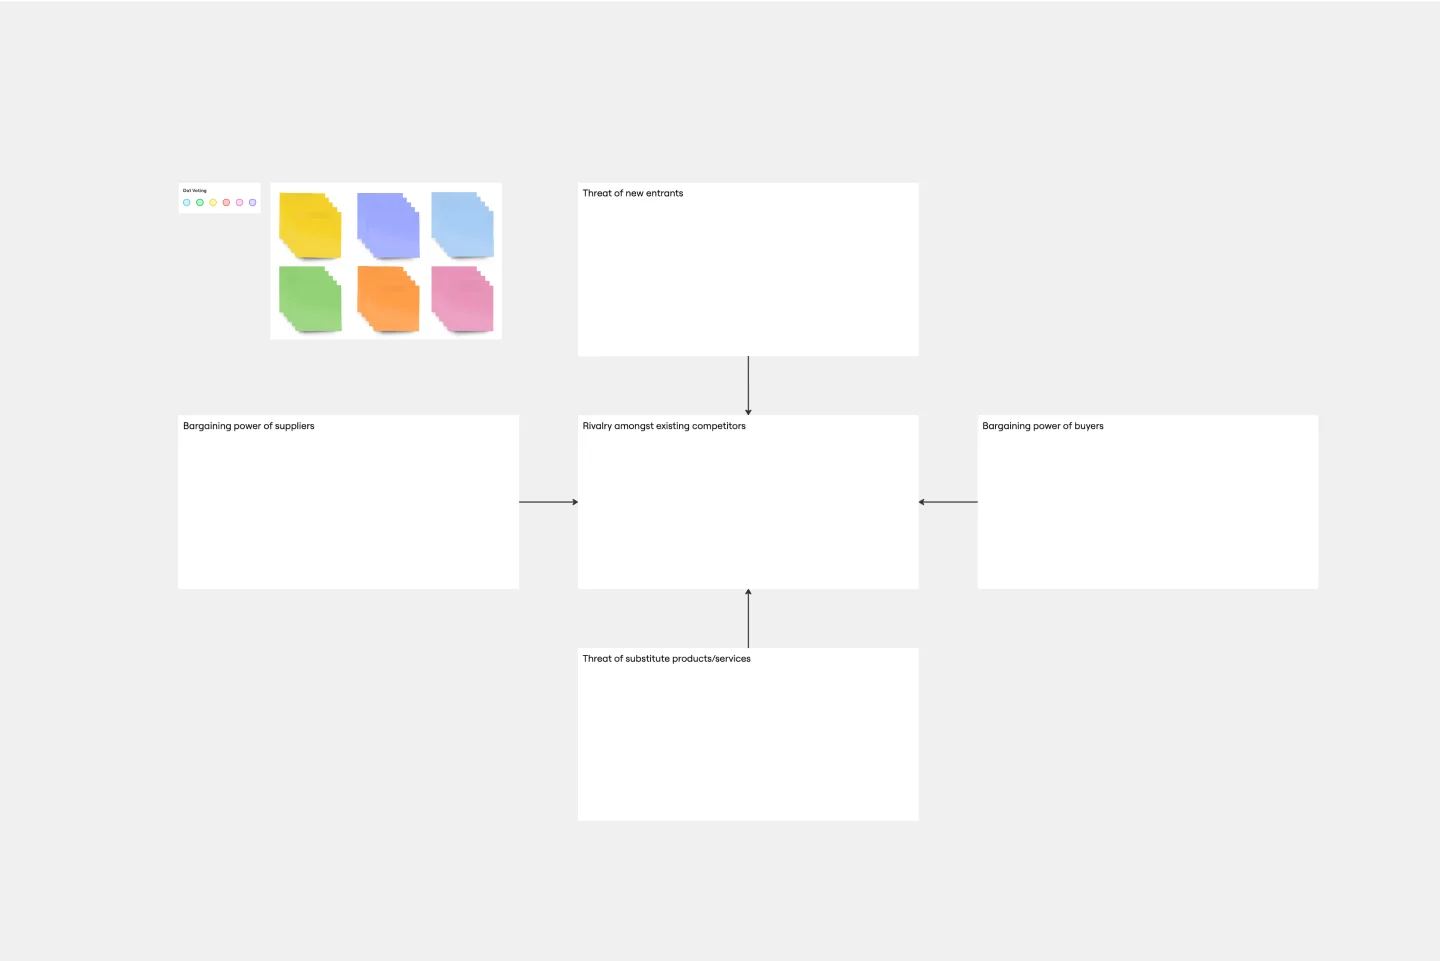
Porter's Five Forces Template
Works best for:
Leadership, Strategic Planning, Market Research
Developed by Harvard Business School professor Michael Porter, Porter’s Five Forces has become one of the most popular and highly regarded business strategy tools available for teams. Use Porter’s Five Forces to measure the strength of your current competition and decide which markets you might be able to move into. Porter’s Five Forces include: supplier power, buyer power, rivalry among existing competitors, the threat of substitute products or services, the threat of substitute products and services, and the threat of new entrants.