About the Communication Matrix Template
The communication matrix template is essential for streamlining and optimizing communication processes within projects or teams. Its design enables teams to delineate and plan communication strategies, ensuring everyone is informed and engaged.
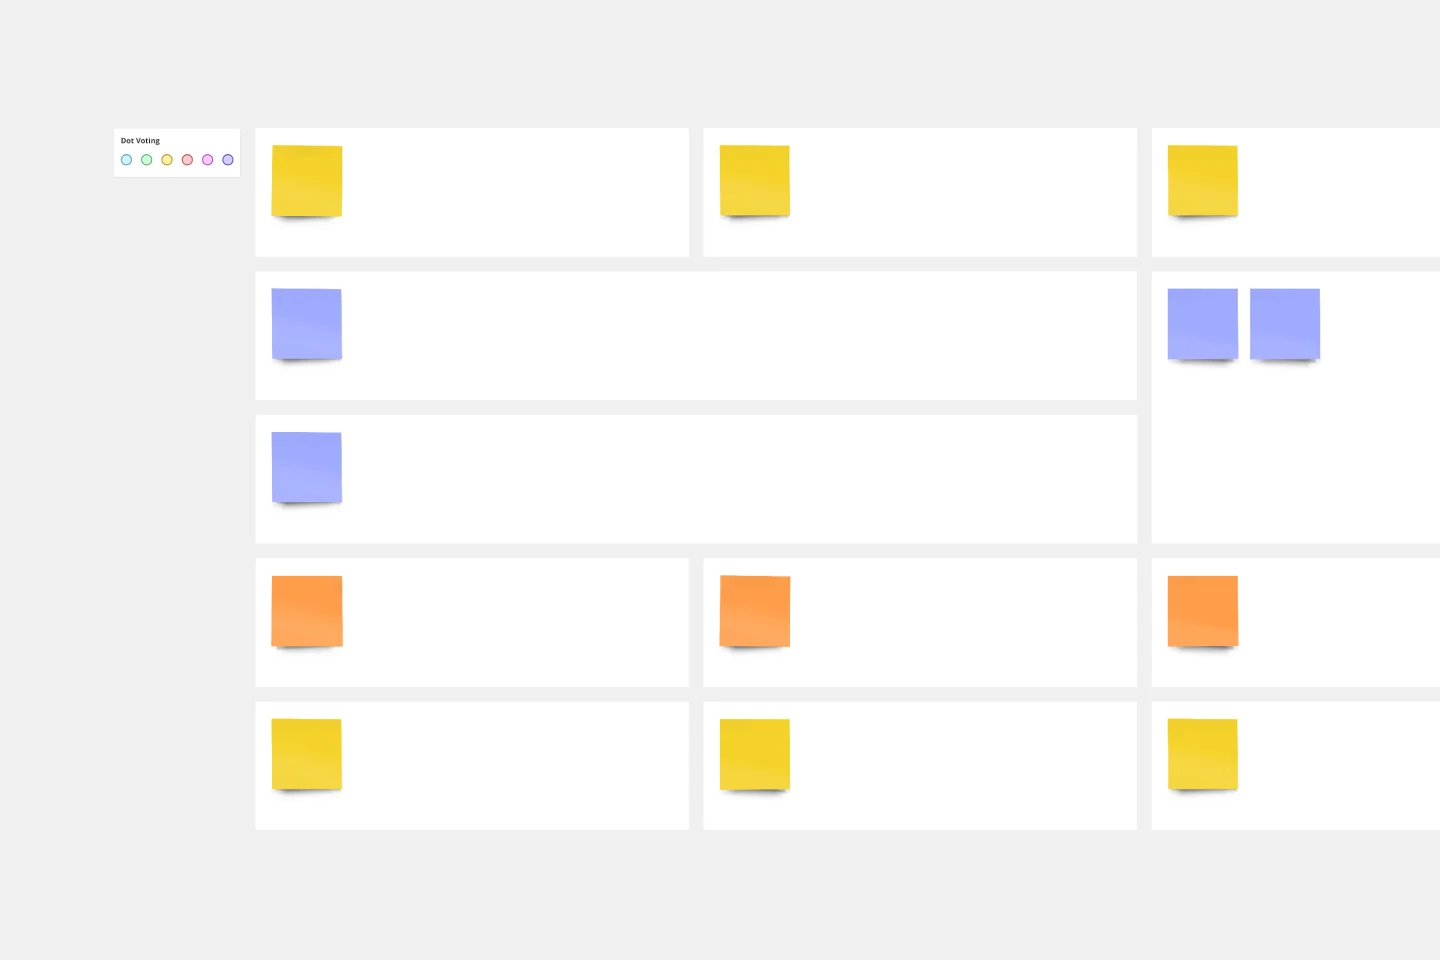
The template consists of a structured framework designed to outline and manage various communication events, mediums, frequencies, and audiences associated with a project. Here's a breakdown of each section:
Communication: This column lists the different types of communication events, such as "Kickoff Meeting" or "Project Status Reports."
Purpose: Articulate the primary intent or objective behind each communication event. For instance, a "Kickoff Meeting" might be "to align team members and set project expectations".
Medium: Specifies the channel through which the communication will occur, e.g., email, face-to-face, video conference, etc.
Frequency: Indicates how often the communication event will happen. It could be once, daily, weekly, monthly, or based on project milestones.
Audience: Determines who should be a part of the communication. This ensures the right stakeholders receive pertinent information.
How to use the communication matrix template
Add your plan: List the types of communications you foresee, such as “Kickoff Meeting” or “Project Status Reports.”
Define the purpose: For each communication type, clarify its purpose. This could range from “setting project goals” to “updating stakeholders on progress.”
Choose a medium: Decide if the communication will be through email, in-person meetings, video calls, or another medium.
Set the frequency: Define how often this communication will occur: daily, weekly, monthly, or as needed.
Identify the audience: Specify who should be present or informed. This could include project managers, team members, stakeholders, etc.
Customize: Expand the template with additional rows or columns as required. Add any artifacts or additional notes directly onto the board to have all project documents in one place.
Review and edit: With just a few clicks, any part of the matrix can be edited, ensuring that the matrix remains dynamic and can adjust to the project's evolving needs.
Why use a communication matrix template?
Clarity and alignment: The template ensures every team member understands their communication roles and responsibilities, promoting consistency.
Efficiency: By detailing communication types and their frequencies, teams can prevent over-communication and ensure timely information exchange.
Stakeholder engagement: Recognizing and listing stakeholders in the matrix ensures everyone relevant receives necessary project updates.
Risk mitigation: Regular and structured communication can identify potential issues early, reducing project risks.
Accountability: Clearly articulated communication channels and frequencies hold team members accountable for their respective communication roles.
Communication matrix FAQs
What is the main goal of the communication matrix template?
The primary aim is to provide clarity and structure in managing various project or business communication requirements. It ensures everyone knows what to expect, when, and through which medium.
Can I add more columns or rows to the template if needed?
Absolutely! The template is designed for flexibility. You can easily add more rows for communication types or columns for specific details.
Is the matrix only for large teams or projects?
No, the communication matrix template is adaptable. Whether you're managing a small team project or overseeing a large organization's communication strategy, the matrix can be scaled and adjusted to fit your needs.
How often should the communication matrix be reviewed or updated?
Regular matrix reviews are recommended, especially at the beginning of a new project phase or when there's a significant change in the team or project. This ensures the matrix remains relevant and effective.

Miro
The AI Innovation Workspace
Miro brings teams and AI together to plan, co-create, and build the next big thing, faster. Miro empowers 100M+ product managers, designers, engineers, and more, to flow from early discovery through final delivery on a shared, AI-first canvas. By embedding AI where teamwork happens, Miro breaks down silos, improves alignment, and accelerates innovation. With the canvas as the prompt, Miro's collaborative AI workflows keep teams in the flow of work, scale shifts in ways of working, and drive organization-wide transformation.
Categories
Similar templates

Project Canvas Template
A project canvas is a management tool that helps you summarize, visualize, and share all necessary information about your project. It can be used by all team members—from facilitators to project management professionals—at every stage of project development. The project canvas template allows you to keep all stakeholders in the project development process in the loop. By using a single platform for all project-related discussions, you can build a clear project overview and improve collaboration.

UX Project Canvas Template
Inspired by Alexander Osterwalder's 2005 business model canvas, the project canvas will help your team visualize the big picture of your UX and design projects, providing a convenient structure that holds all of your important data. This innovative tool enables you to transform an idea into a project plan, stimulating collaboration and communication between collaborators. Unlike alternative models, the project canvas is a simple interface. There are few startup costs, and employees can easily be brought up to speed to start using the canvas quickly.

RACI Matrix Template
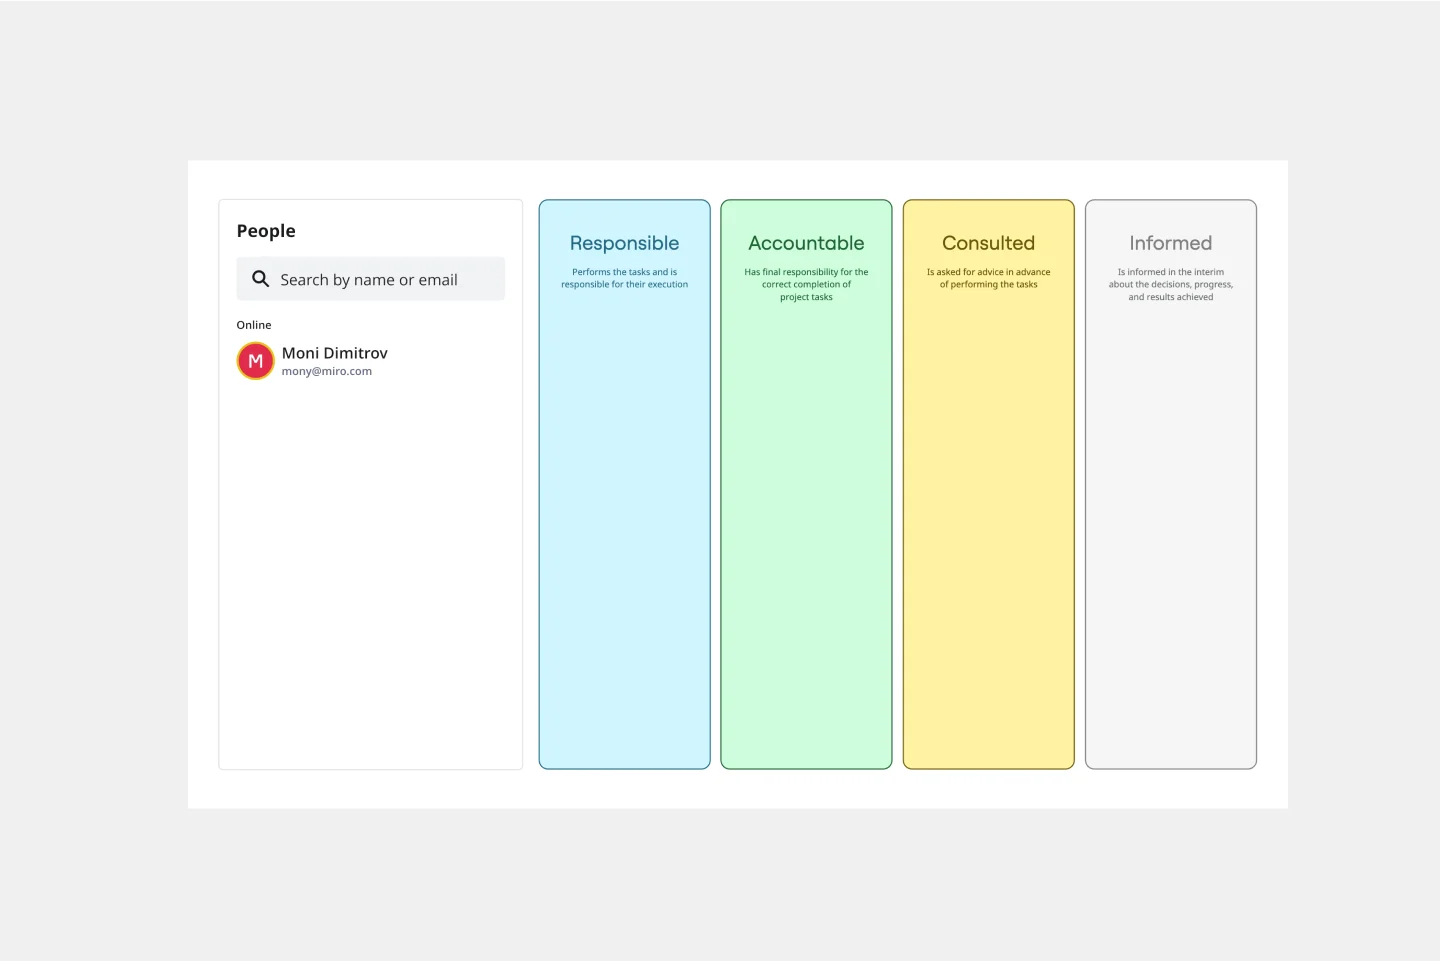
The RACI Matrix is an essential management tool that helps teams keep track of roles and responsibilities and can avoid confusion during projects. The acronym RACI stands for Responsible (the person who does the work to achieve the task and is responsible for getting the work done or decision made); Accountable (the person who is accountable for the correct and thorough completion of the task); Consulted (the people who provide information for the project and with whom there is two-way communication); Informed (the people who are kept informed of progress and with whom there is one-way communication).

Communications Plan Template
You saw the opportunity. You developed the product. Now comes an important step: Find your audience and speak to them in a way that’s clear, memorable, and inspiring. You need a communications plan—a strategy for controlling your narrative at every stage of your business—and this template will help you create a good one. No need to build a new strategy every time you have something to communicate. Here, you can simplify the process, streamline your messaging, and empower you to communicate in ways that grow with your business.

Process Map Template
Process mapping allows you to assess, document, and strategize around any plan or approach your team has put in place. It’s a useful tool for eliminating or preventing blockers. Organized by stages, a process map enables your team to divide up a process or system and record deliverables and action items at each stage of the process. By breaking down the objectives, activities and deliverables at any stage of a project, you can gain insight into whether you are on track or effectively working through a problem.

Project Canvas Template
A project canvas is a management tool that helps you summarize, visualize, and share all necessary information about your project. It can be used by all team members—from facilitators to project management professionals—at every stage of project development. The project canvas template allows you to keep all stakeholders in the project development process in the loop. By using a single platform for all project-related discussions, you can build a clear project overview and improve collaboration.

UX Project Canvas Template
Inspired by Alexander Osterwalder's 2005 business model canvas, the project canvas will help your team visualize the big picture of your UX and design projects, providing a convenient structure that holds all of your important data. This innovative tool enables you to transform an idea into a project plan, stimulating collaboration and communication between collaborators. Unlike alternative models, the project canvas is a simple interface. There are few startup costs, and employees can easily be brought up to speed to start using the canvas quickly.

RACI Matrix Template
The RACI Matrix is an essential management tool that helps teams keep track of roles and responsibilities and can avoid confusion during projects. The acronym RACI stands for Responsible (the person who does the work to achieve the task and is responsible for getting the work done or decision made); Accountable (the person who is accountable for the correct and thorough completion of the task); Consulted (the people who provide information for the project and with whom there is two-way communication); Informed (the people who are kept informed of progress and with whom there is one-way communication).

Communications Plan Template
You saw the opportunity. You developed the product. Now comes an important step: Find your audience and speak to them in a way that’s clear, memorable, and inspiring. You need a communications plan—a strategy for controlling your narrative at every stage of your business—and this template will help you create a good one. No need to build a new strategy every time you have something to communicate. Here, you can simplify the process, streamline your messaging, and empower you to communicate in ways that grow with your business.

Process Map Template
Process mapping allows you to assess, document, and strategize around any plan or approach your team has put in place. It’s a useful tool for eliminating or preventing blockers. Organized by stages, a process map enables your team to divide up a process or system and record deliverables and action items at each stage of the process. By breaking down the objectives, activities and deliverables at any stage of a project, you can gain insight into whether you are on track or effectively working through a problem.