
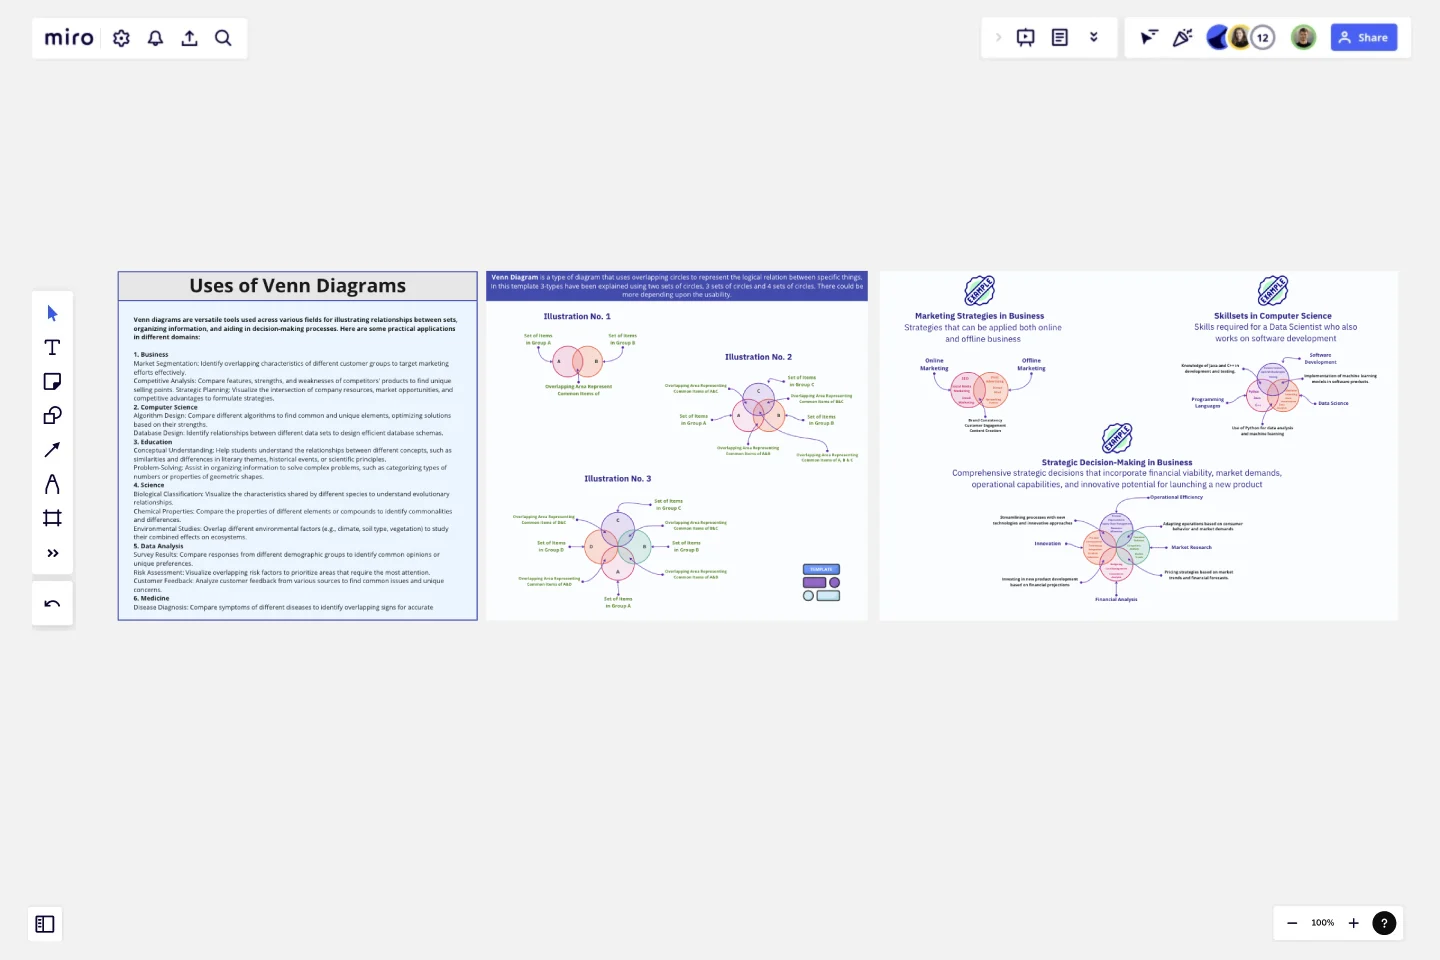
Venn Diagram Practical Applications
The "Venn Diagram Practical Applications" template is designed to help users visualize and analyze the relationships between different sets of data using Venn diagrams.
Overview:
The "Venn Diagram Practical Applications" template is designed to help users visualize and analyze the relationships between different sets of data using Venn diagrams. This template is ideal for professionals, educators, and students across various fields such as business, computer science, and strategic planning. It provides a clear and effective way to compare and contrast different elements, identify commonalities, and uncover unique attributes.
Key Features:
Versatile Use Cases: Demonstrates practical applications of Venn diagrams in real-life scenarios across multiple domains.
Different Diagram Configurations: Includes examples with two-circle, three-circle, and four-circle Venn diagrams to cater to varying levels of complexity.
Interactive Elements: Allows users to add, edit, and customize the diagram content based on their specific needs and data sets.
Visual Clarity: Uses distinct colors and overlapping areas to clearly depict intersections and differences between sets.
How to Use:
Two-Circle Venn Diagram:
Description: Ideal for comparing two different sets or groups.
Example: Comparing the features of two competing products in the market.
Set A: Product X features (e.g., Price, User Interface)
Set B: Product Y features (e.g., Battery Life, Customer Support)
Intersection: Common features (e.g., Availability, Warranty)
Three-Circle Venn Diagram:
Description: Useful for comparing three different sets or groups to find commonalities and unique characteristics.
Example: Overlapping skill sets in a project team.
Set A: Skills of Team Member A (e.g., Coding, Design)
Set B: Skills of Team Member B (e.g., Marketing, Design)
Set C: Skills of Team Member C (e.g., Coding, Project Management)
Intersections: Areas where two or three members share skills.
Four-Circle Venn Diagram:
Description: Best for complex comparisons involving four different sets or groups.
Example: Market segmentation analysis for a new product launch.
Set A: Segment 1 (e.g., Age Group 18-25)
Set B: Segment 2 (e.g., Income Level High)
Set C: Segment 3 (e.g., Geographical Region A)
Set D: Segment 4 (e.g., Interest in Technology)
Intersections: Identifying the core target audience that falls into multiple segments.
Practical Applications:
Business: Analyzing market segments, comparing product features, and identifying strategic opportunities.
Computer Science: Visualizing algorithm performance, comparing programming languages, and mapping software functionalities.
Strategies: Developing strategic plans, understanding competitive landscapes, and aligning organizational goals.
Benefits:
Enhanced Understanding: Simplifies the comparison and analysis of multiple sets of data.
Improved Decision Making: Helps identify commonalities and differences that can inform strategic decisions.
Versatile Tool: Applicable across various fields and scenarios, making it a valuable tool for diverse users.
Regards
Khawaja Rizwan
Get started with this template right now.

Venn Diagram for Learning and Education
Works best for:
Venn Diagram
Enhance learning and teaching with the Venn Diagram for Learning and Education template. Use it to compare concepts, illustrate relationships, and facilitate discussions. This template helps students and educators organize information visually, making complex ideas easier to understand and retain. It's an excellent tool for classrooms, study groups, and professional training sessions, promoting deeper understanding and active learning.

Fishbone Diagram for Service Improvement
Works best for:
Fishbone diagram
The Basic Fishbone Diagram, also known as the Ishikawa or cause-and-effect diagram, is a powerful tool for identifying the root causes of problems. Use this template to systematically explore and document potential causes of an issue, categorizing them into key areas such as people, processes, equipment, and materials. This visual approach helps teams collaborate on problem-solving, ensuring all factors are considered and addressed effectively.
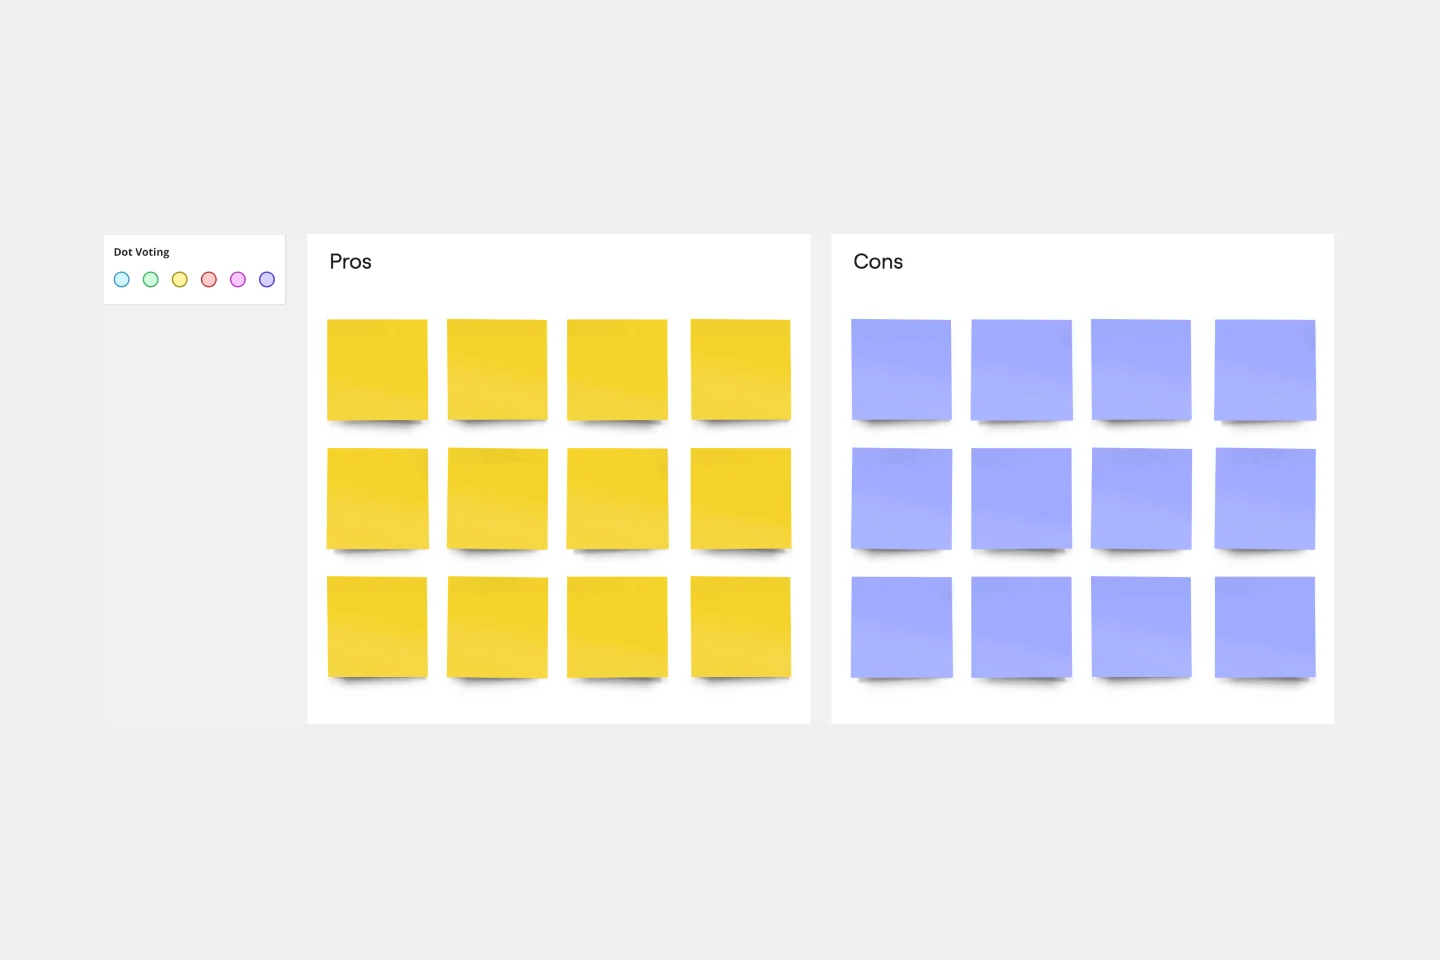
Pros and Cons List Template
Works best for:
Decision Making, Documentation, Strategic Planning
A pros and cons list is a simple but powerful decision-making tool used to help understand both sides of an argument. Pros are listed as arguments in favor of making a particular decision or action. Cons are listed arguments against it. By creating a list that details both sides of the argument, it becomes easier to visualize the potential impact of your decision. To make your pros and cons list even more objective, it can help to weight each pro and con against the others. You can then present your decision with confidence, making a strong argument for why it’s the right one.
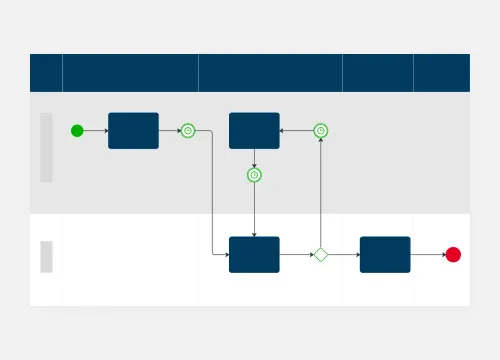
BPM
Works best for:
Diagramming
The BPM (Business Process Management) template is a visual tool for modeling, analyzing, and optimizing business processes. It provides a structured framework for documenting process flows, identifying bottlenecks, and improving efficiency. This template enables organizations to streamline operations, enhance productivity, and drive business performance. By promoting process transparency and agility, the BPM template empowers teams to achieve operational excellence and deliver value to stakeholders.
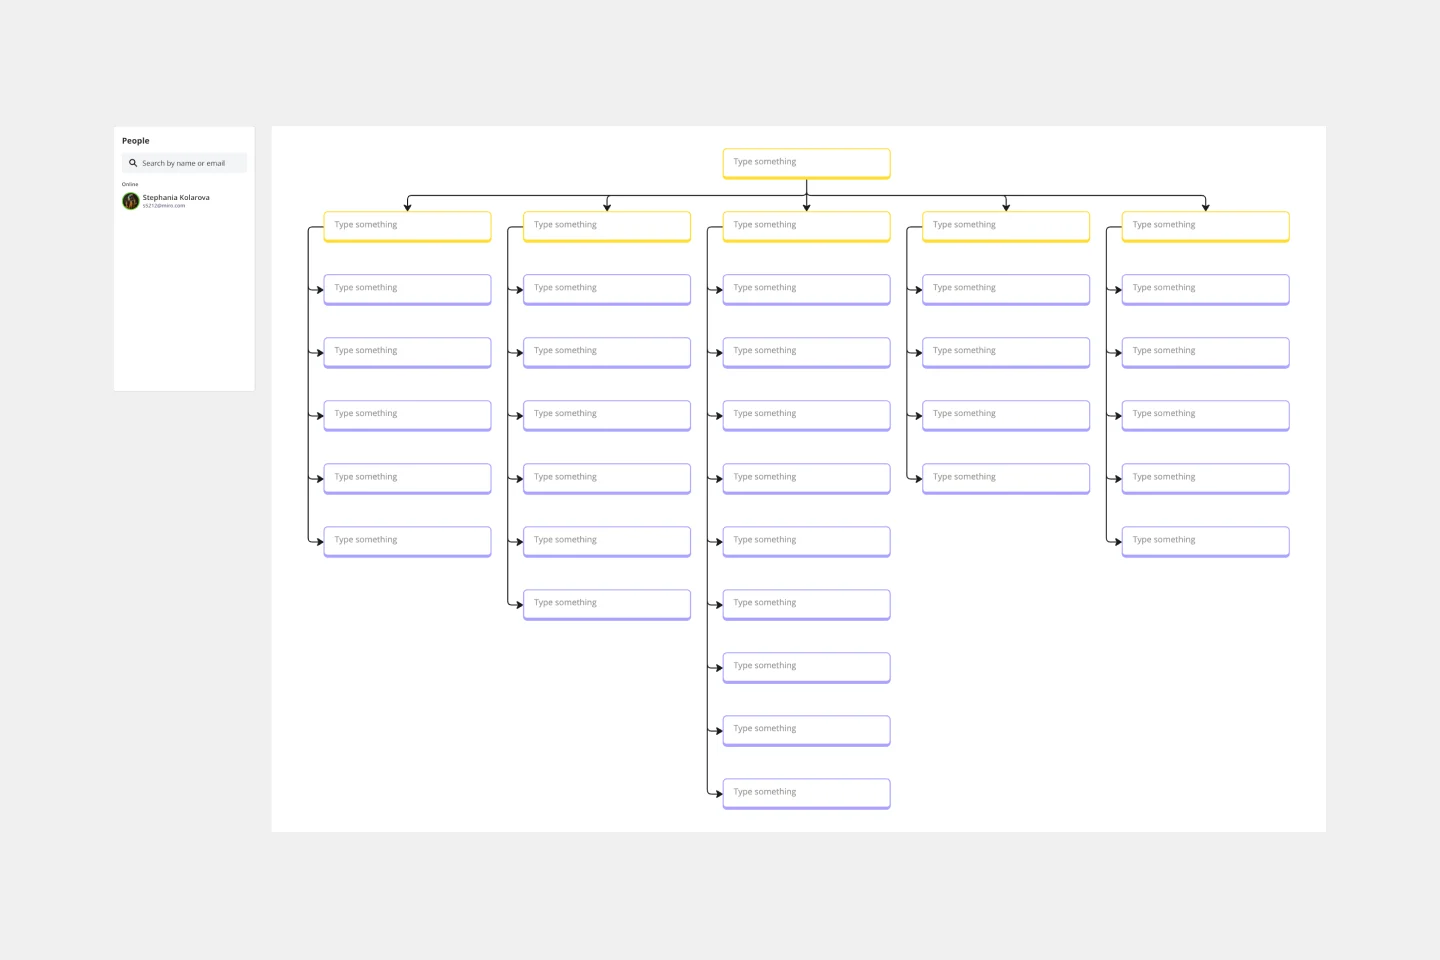
Work Breakdown Structure Template
Works best for:
Project Management, Mapping, Workflows
A work breakdown is a project management tool that lays out everything you must accomplish to complete a project. It organizes these tasks into multiple levels and displays each element graphically. Creating a work breakdown is a deliverable-based approach, meaning you’ll end up with a detailed project plan of the deliverables you must create to finish the job. Create a Work Breakdown Structure when you need to deconstruct your team's work into smaller, well-defined elements to make it more manageable.
Customer Journey Map
Works best for:
Customer Journey Map
Customer journey mapping is a method that visualizes and narrates how users navigate a site or app to achieve their objectives.