About the Root Cause Analysis Templates Collection
Root cause analysis (RCA) templates in Miro are designed to help teams identify, analyze, and solve problems at their source. These templates provide a structured approach to uncovering the underlying causes of issues, ensuring that solutions are effective and long-lasting. Whether you're dealing with a recurring problem or a one-time incident, Miro's root cause analysis templates can guide you through the process, making it easier to collaborate and communicate with your team.
Key Components of a Root Cause Analysis Template
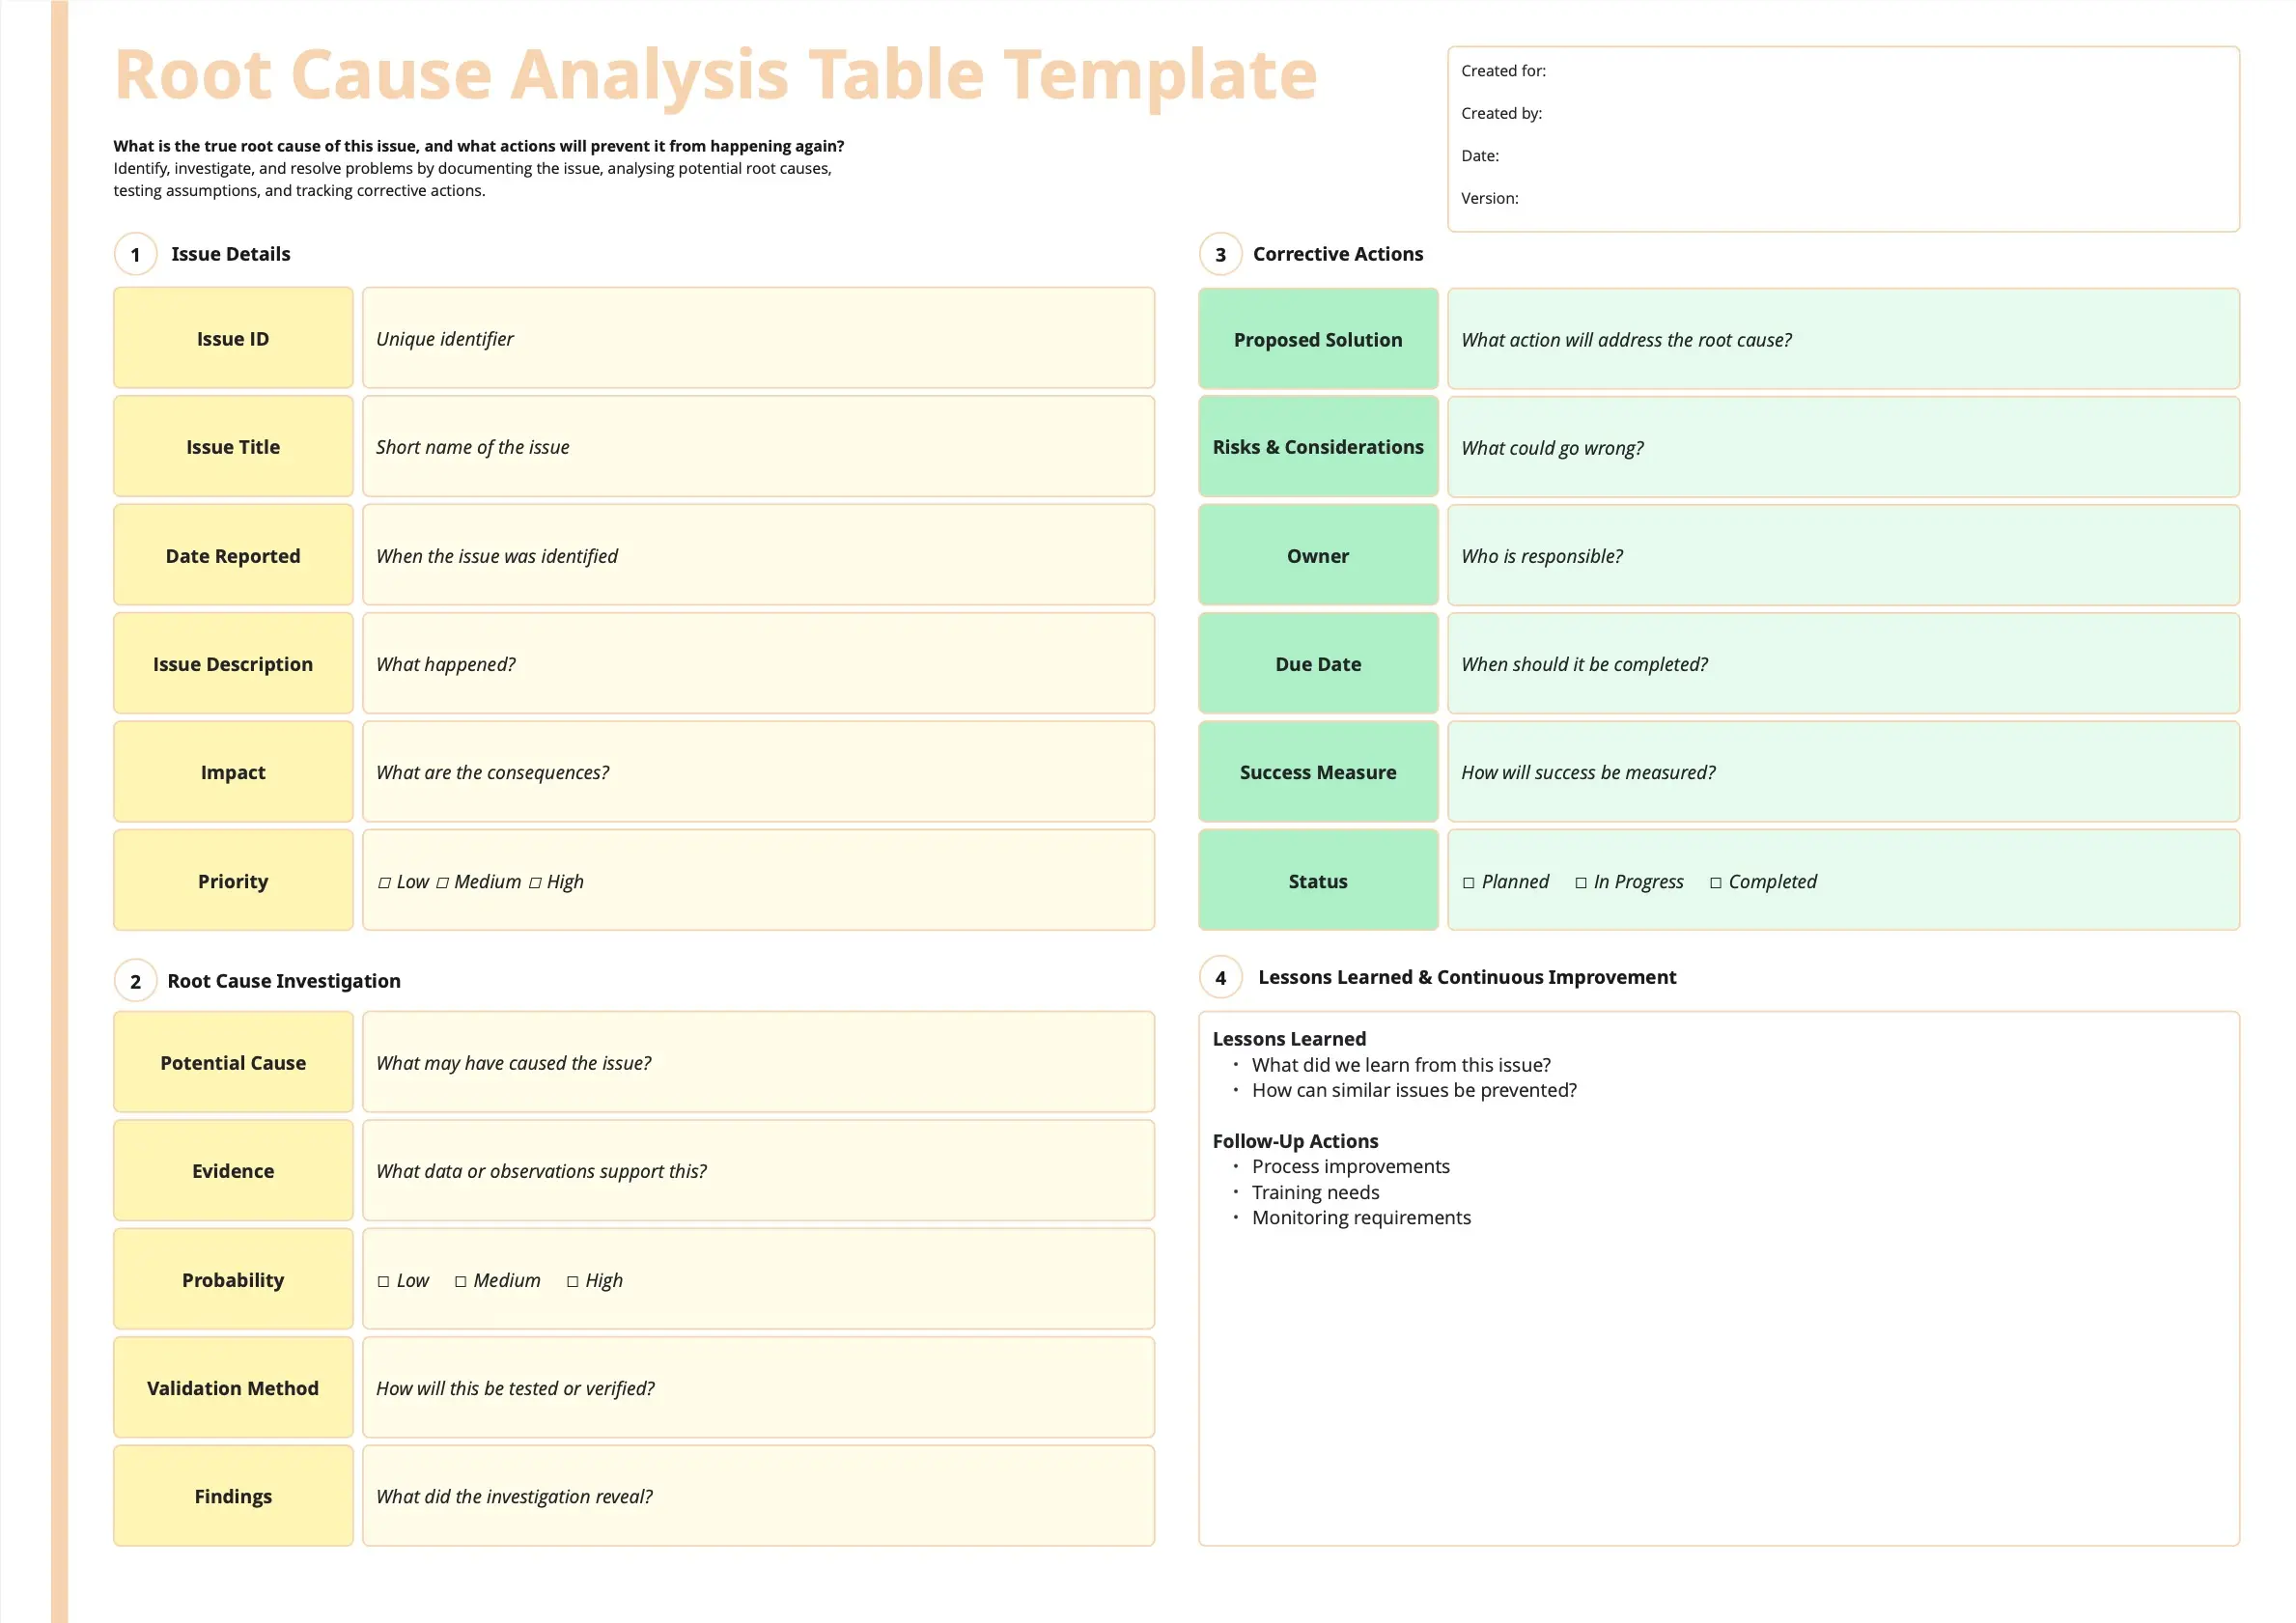
A professional RCA template acts as a "Forensic Report." Every high-performance Miro board should include these five elements:
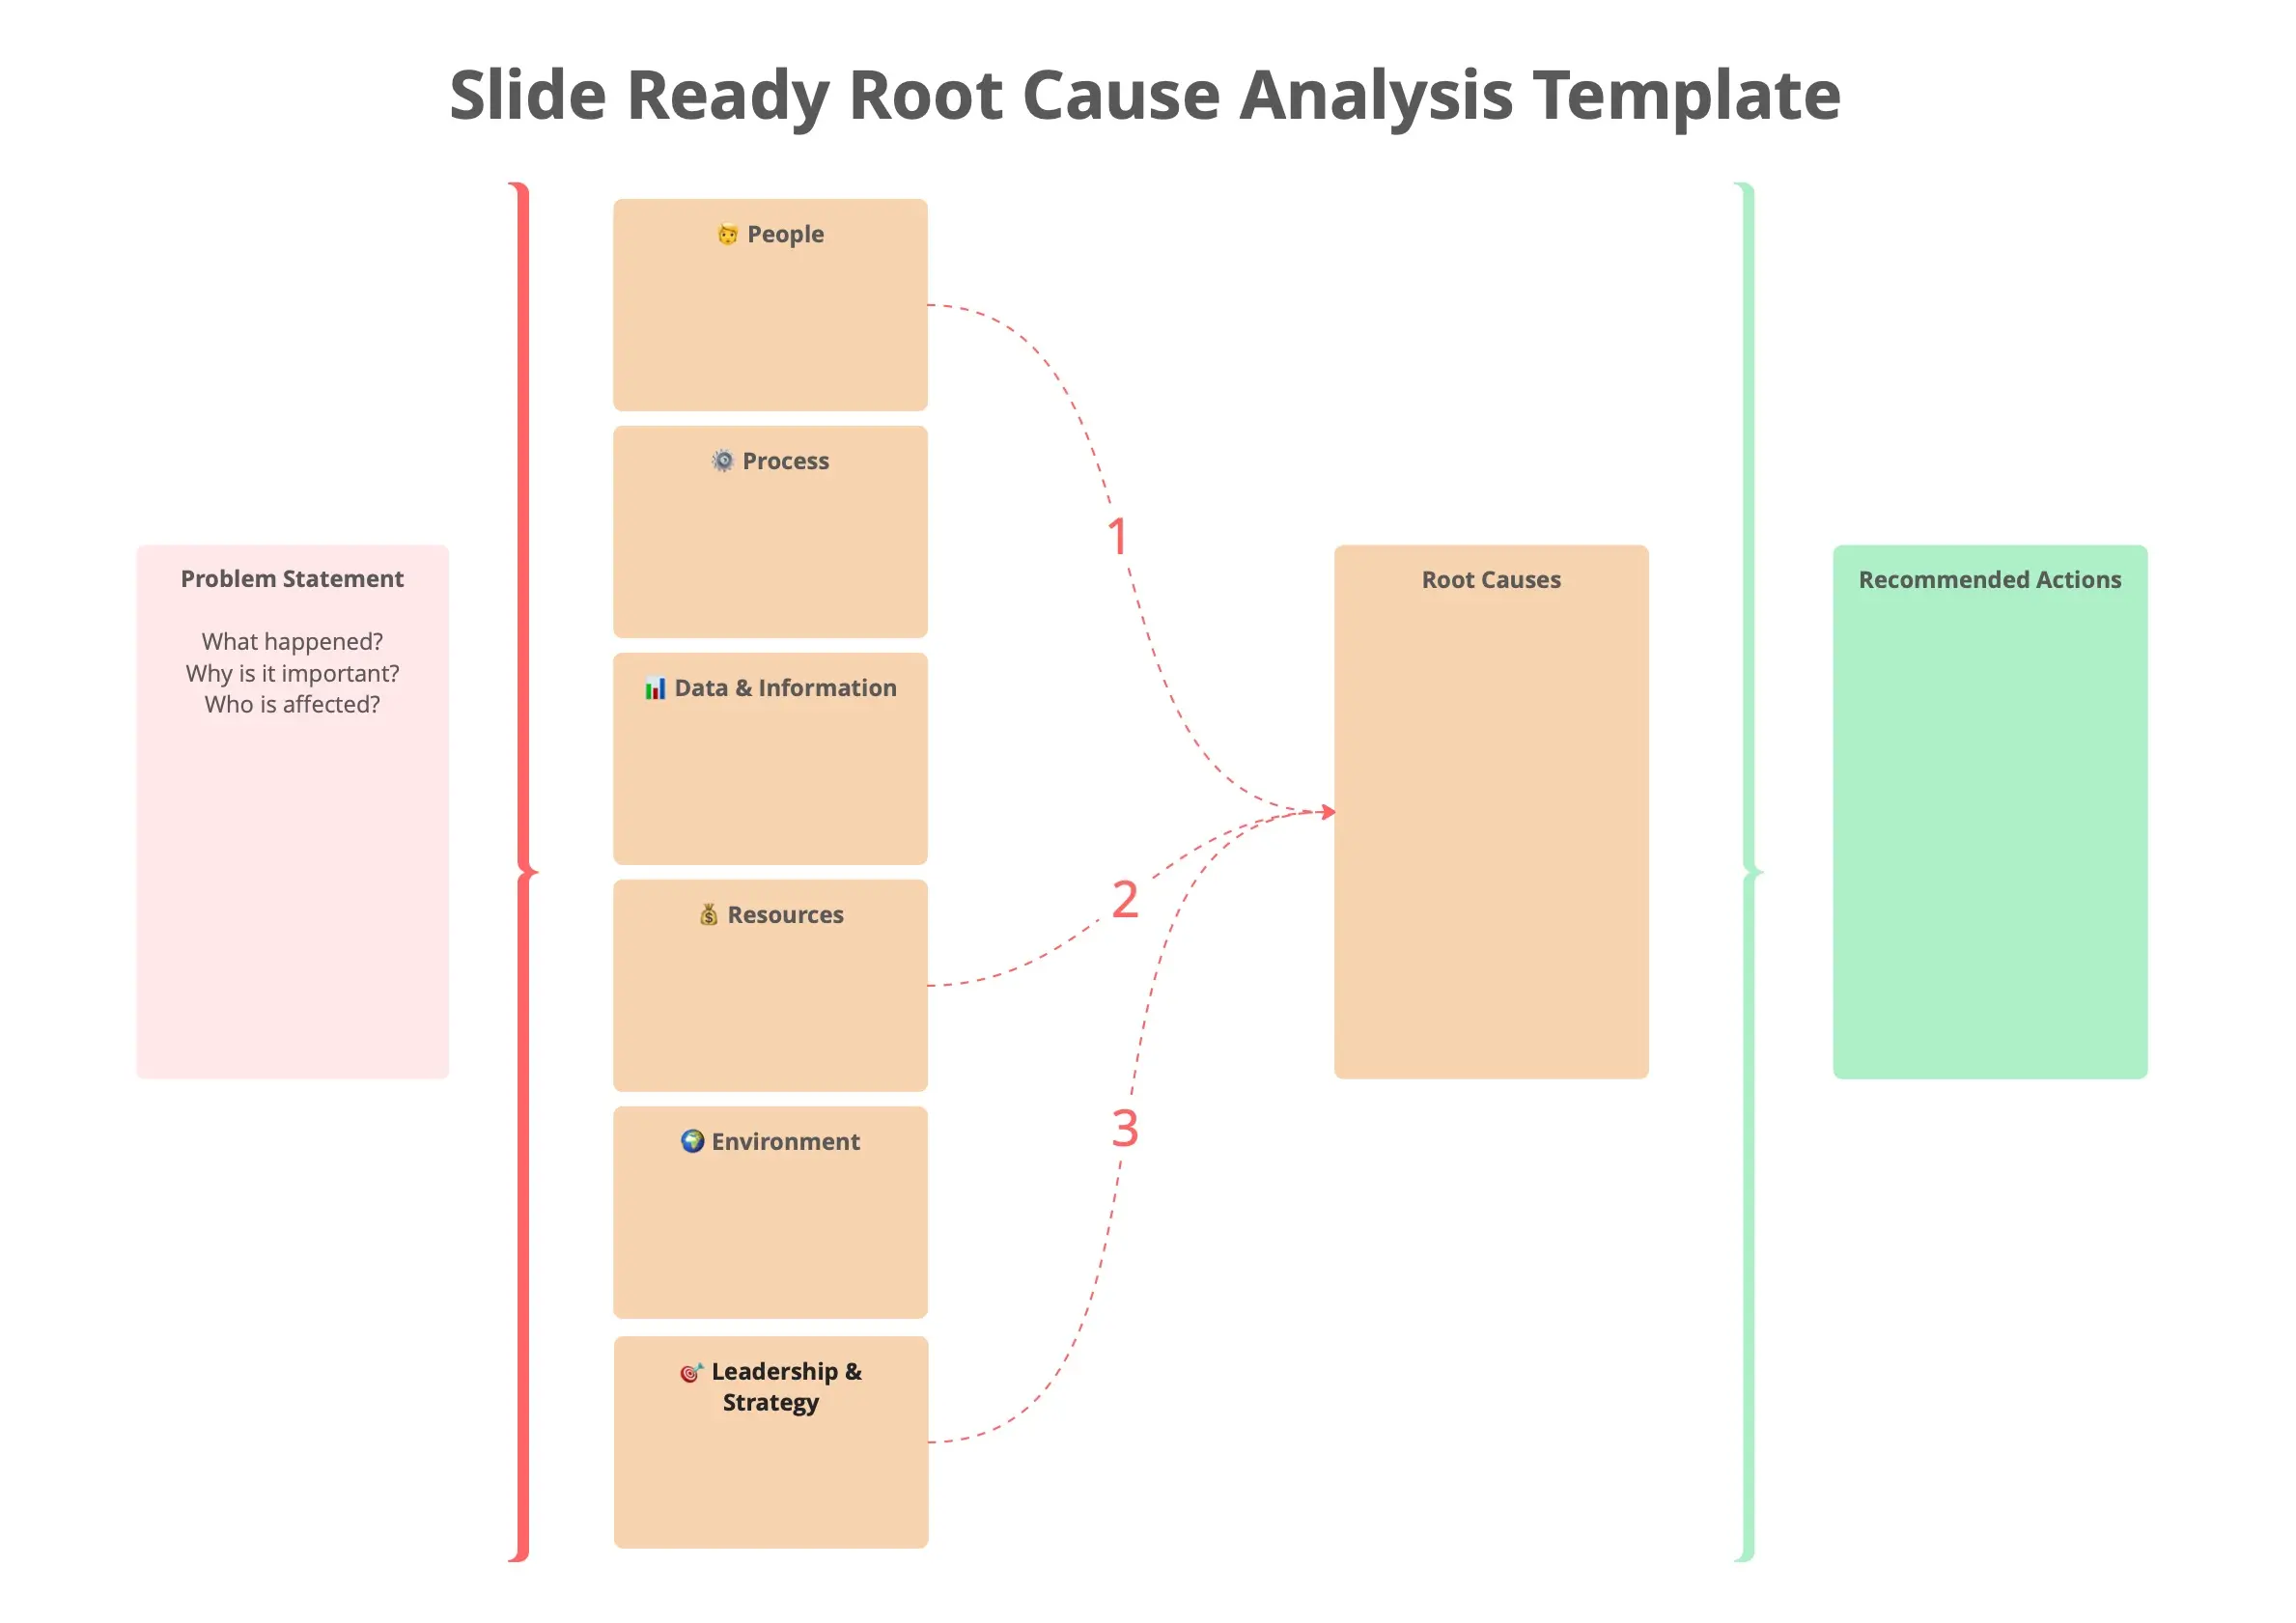
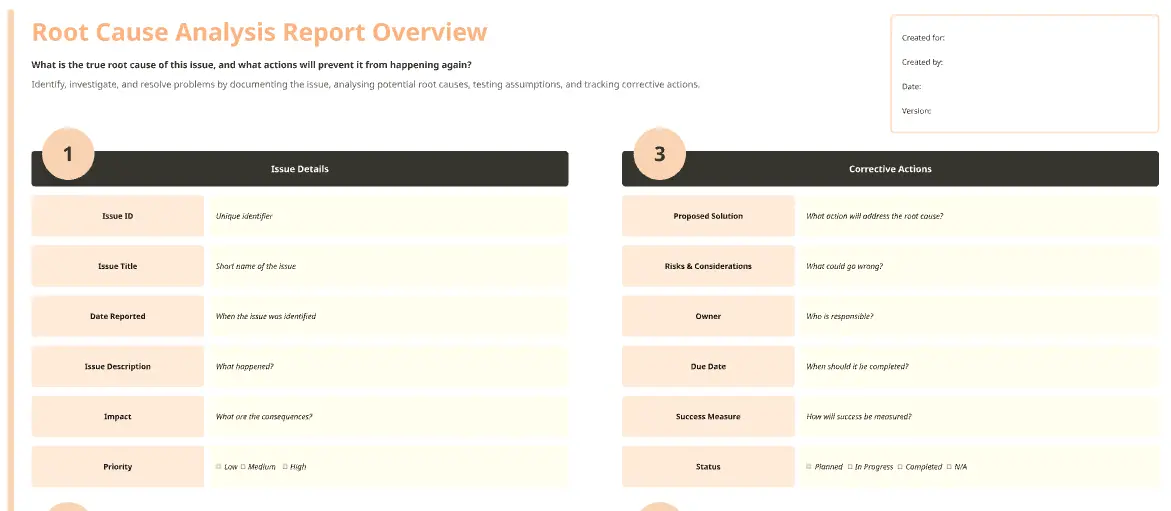
The Problem Statement: A factual, data-driven description of what happened (The "What," "Where," and "When").
The Timeline of Events: A chronological sequence of the lead-up to the failure.
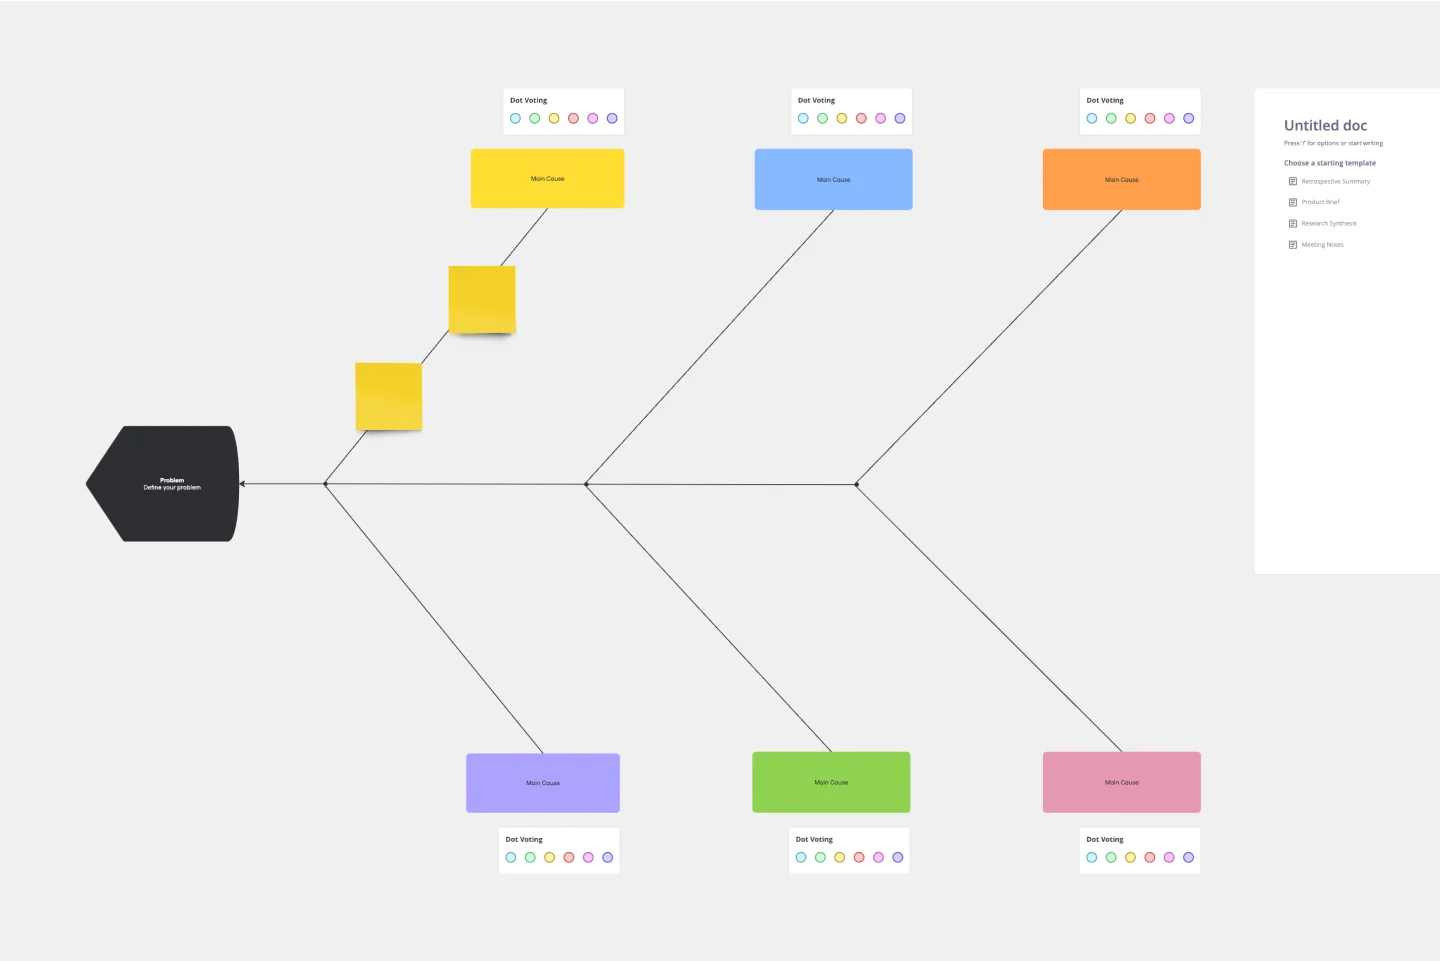
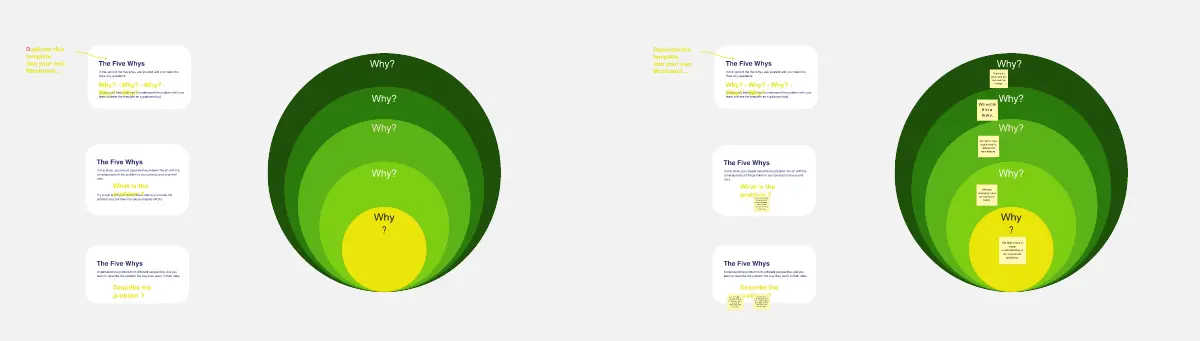
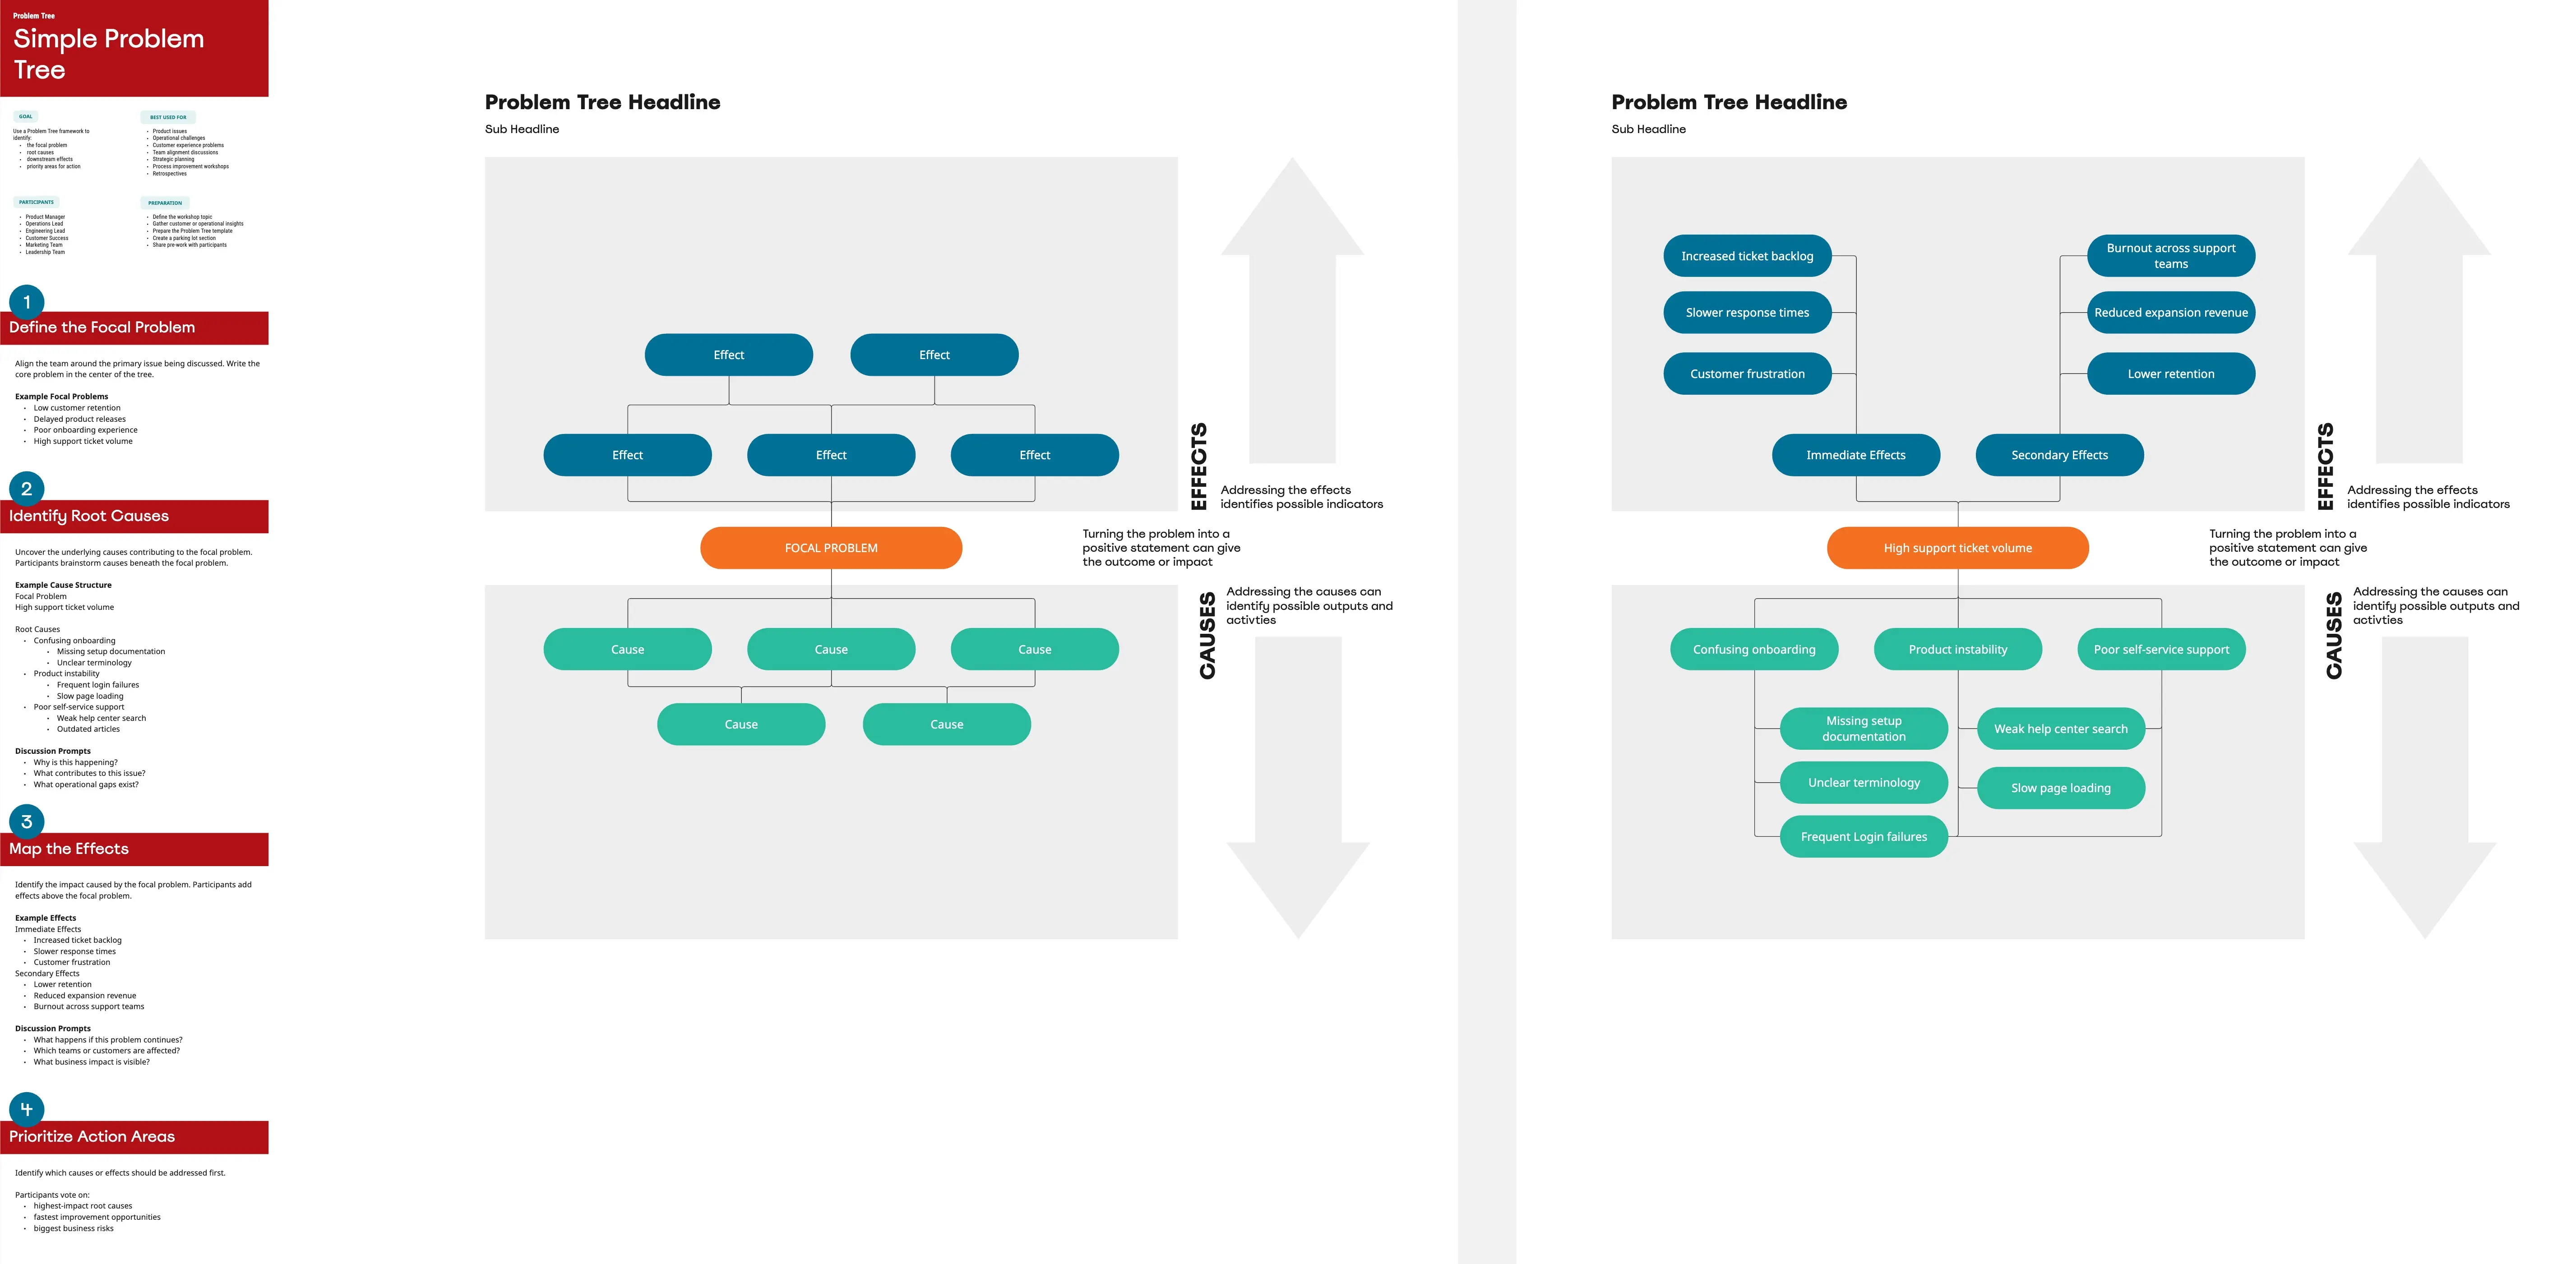
The "Causal Chain": The visual map (Whys or Fishbone) showing the link between the event and the root.
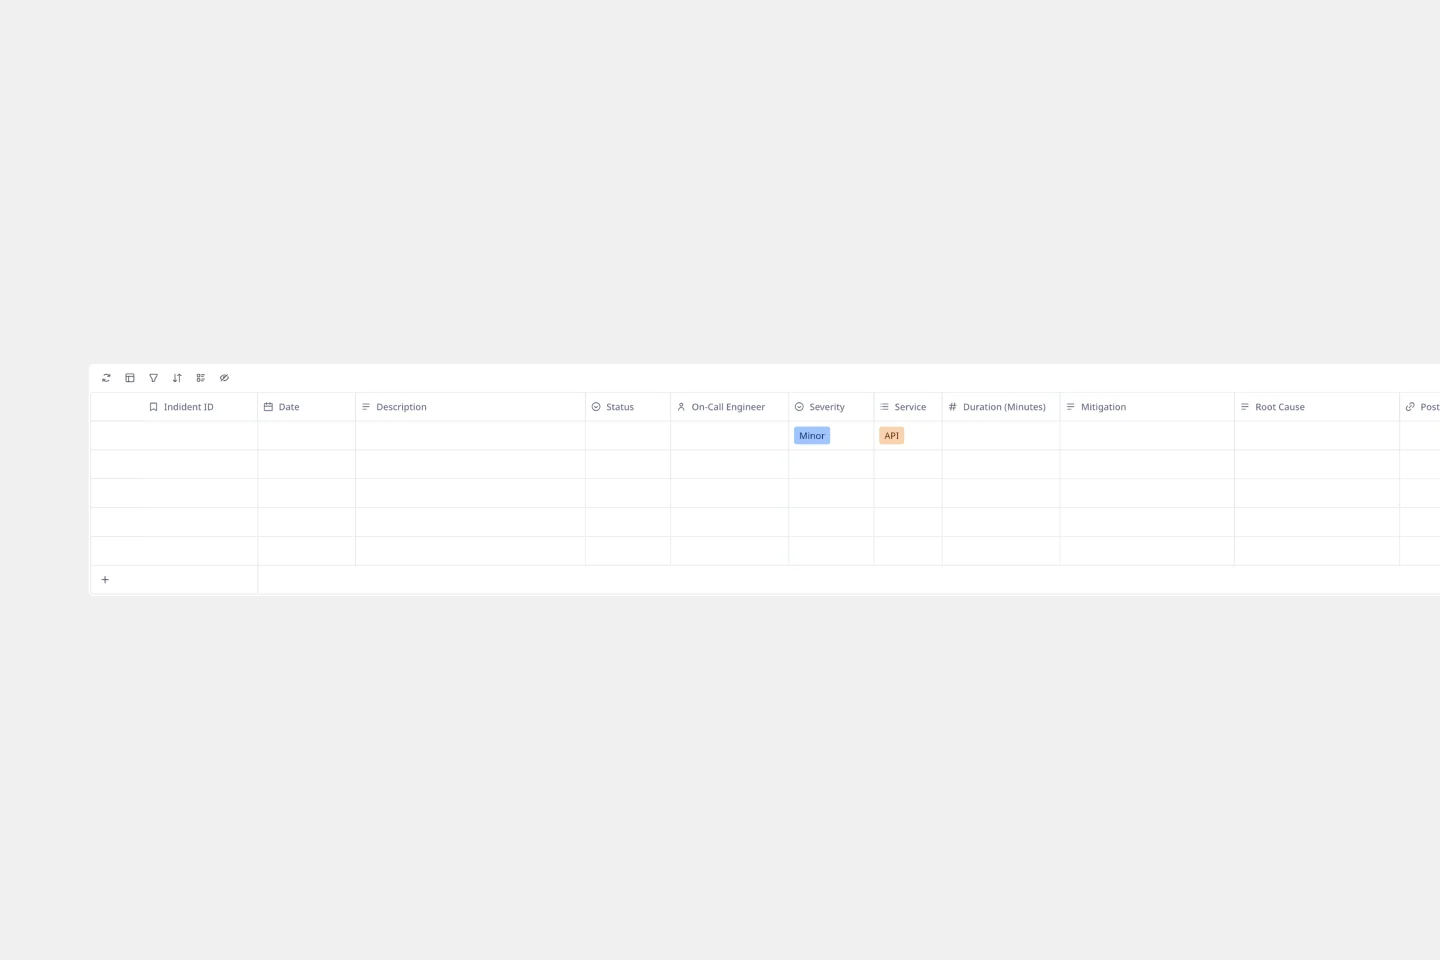
Evidence & Data Points: Links to logs, photos, or witness statements that prove your theory.
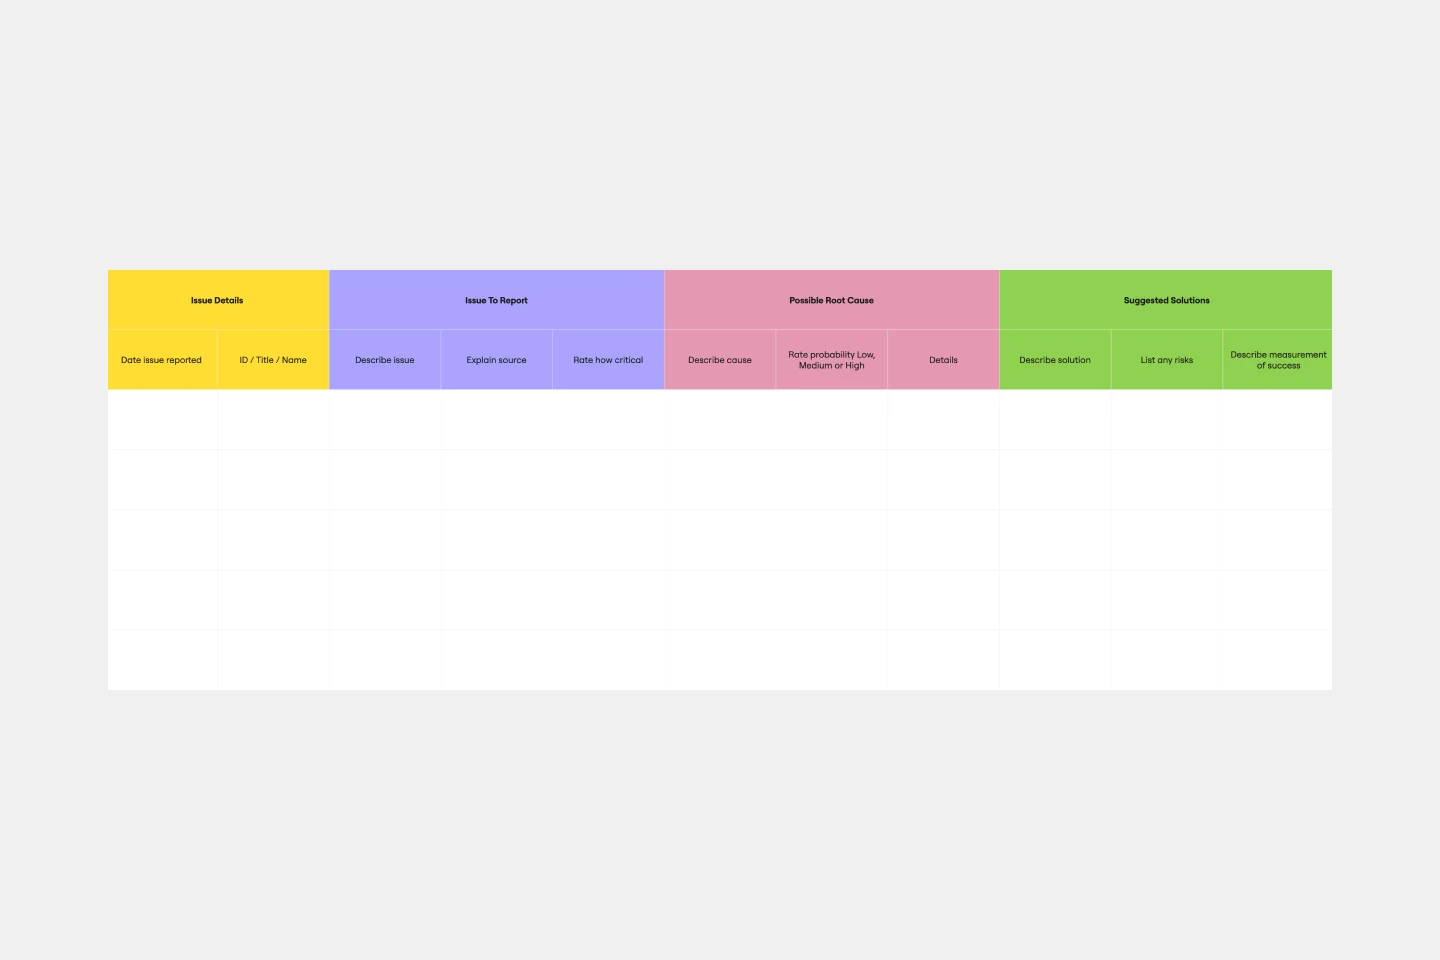
The Corrective Action Plan (CAP): A table defining the specific steps, owners, and deadlines to ensure the root cause is killed.
Which RCA Template Do You Need?
Select the Miro template that matches the complexity of your incident:
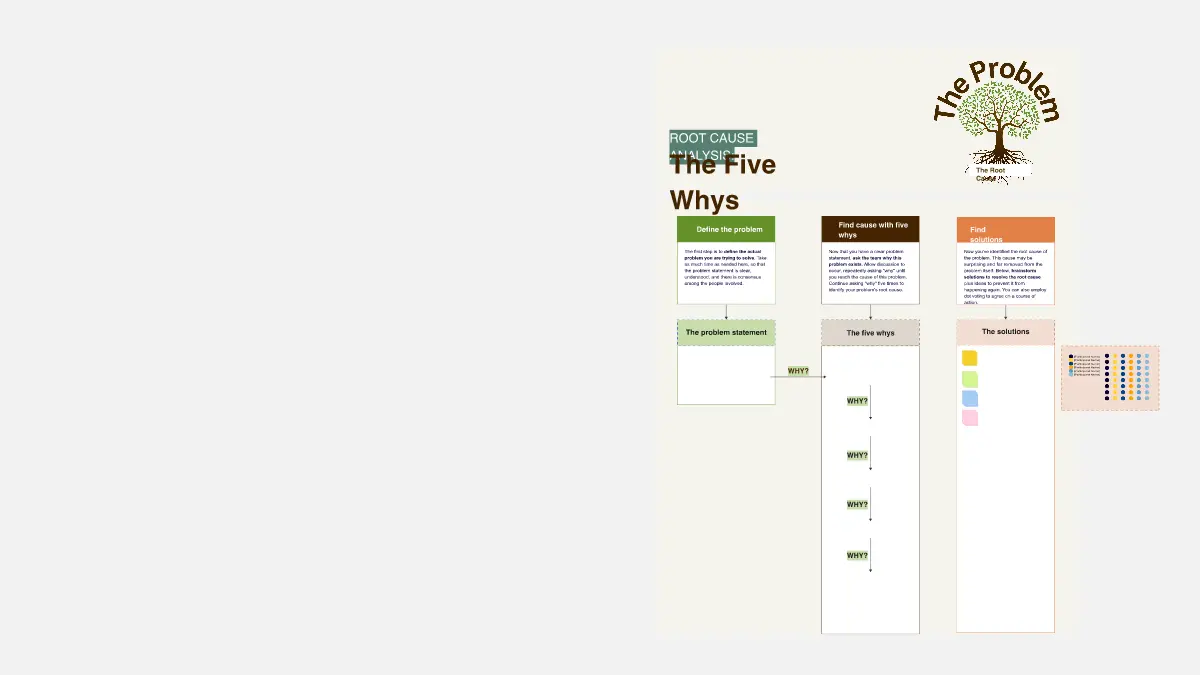
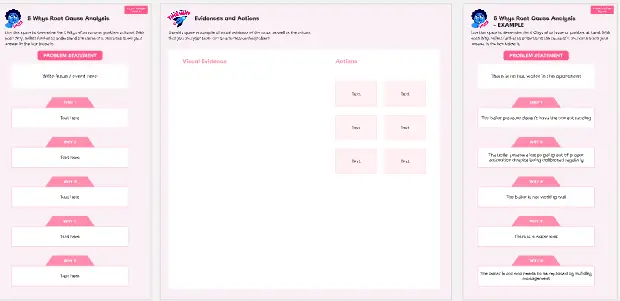
The 5 Whys (The "Rapid" Framework):
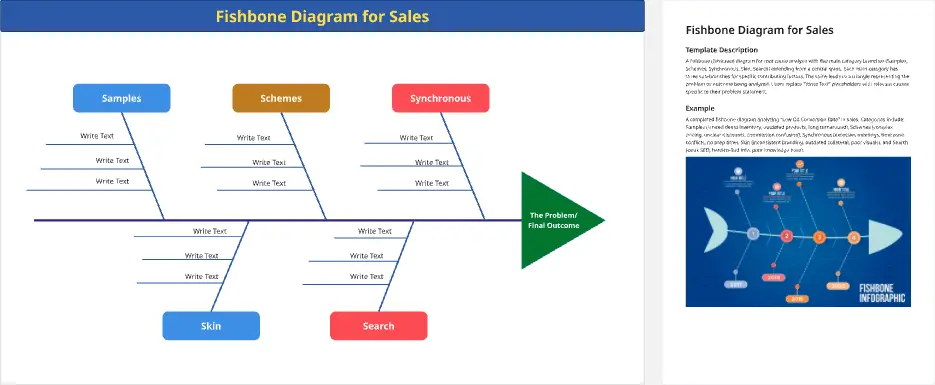
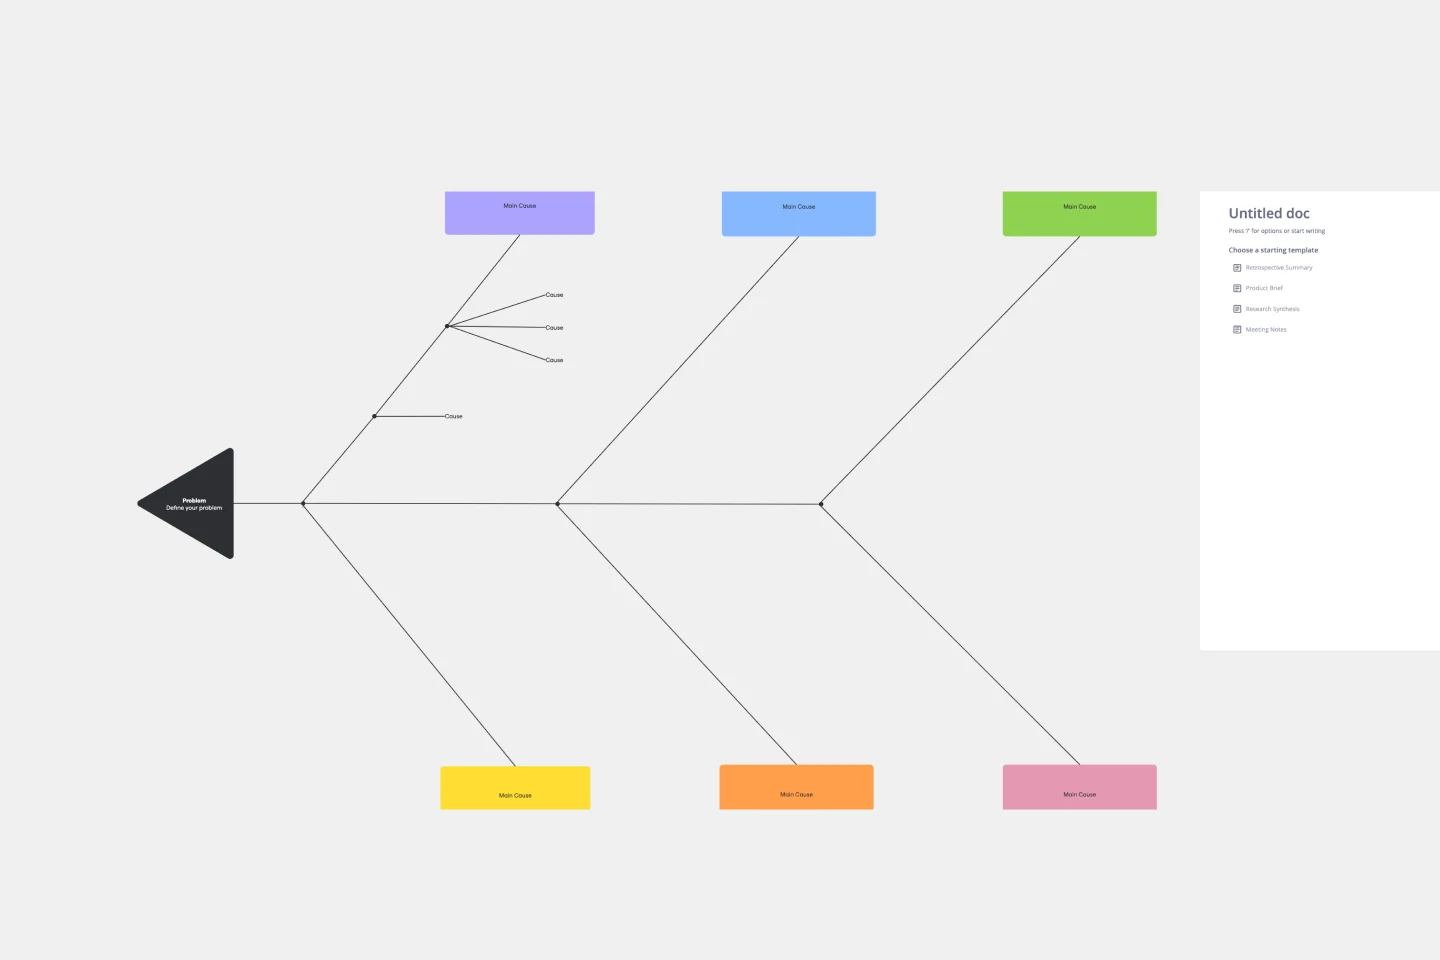
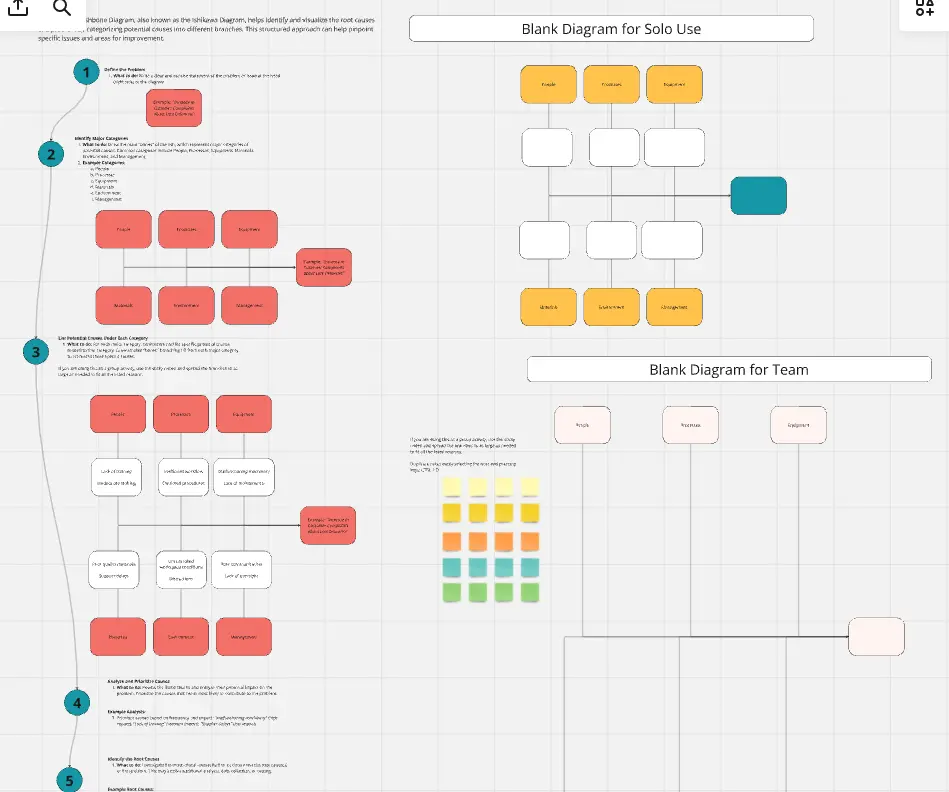
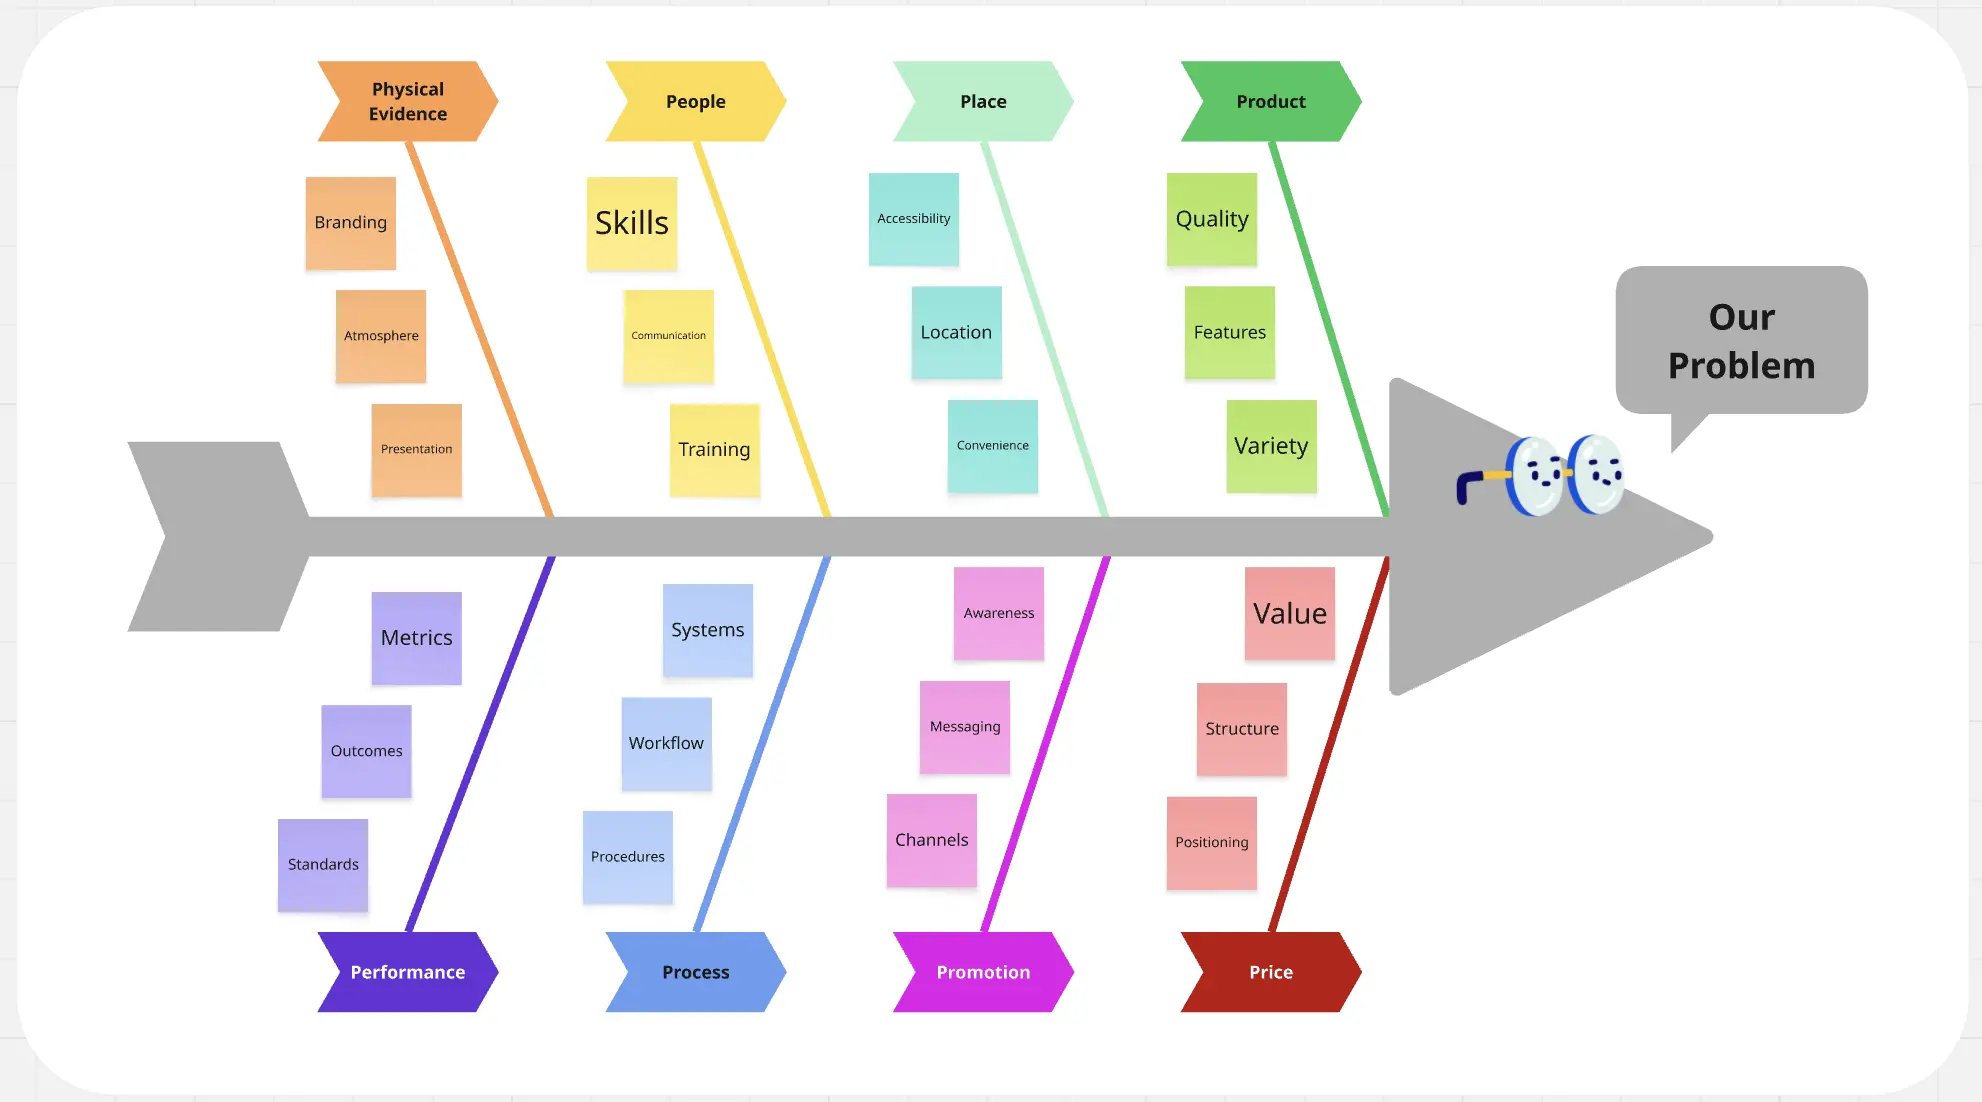
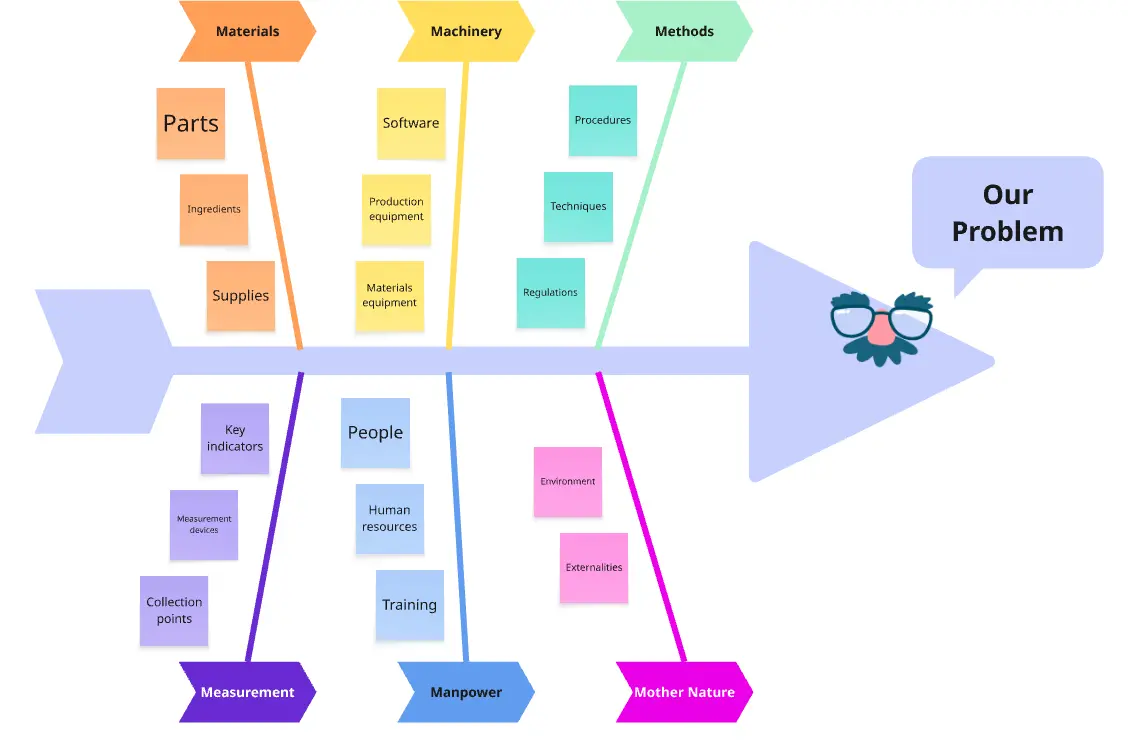
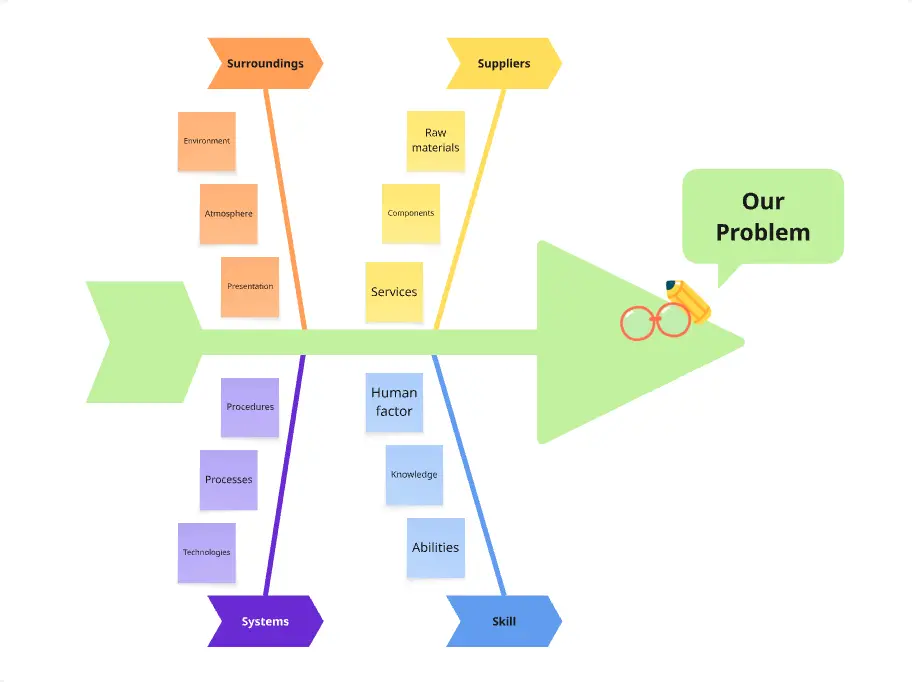
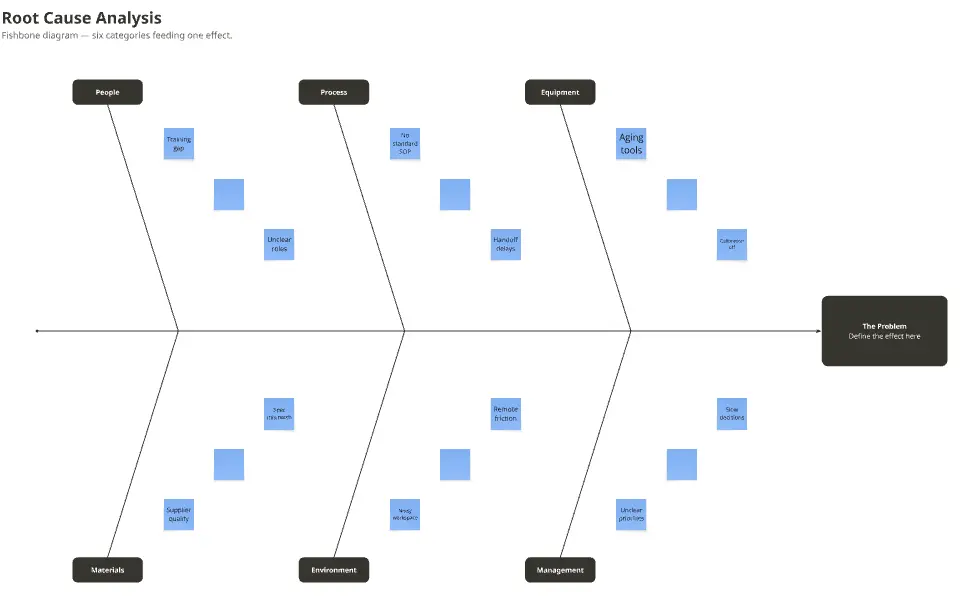
The Ishikawa (Fishbone) Diagram:
Best For: Complex, multi-departmental failures (e.g., a manufacturing defect).
The Goal: To categorize potential causes into "Man, Machine, Method, Material, Measurement, and Mother Nature (Environment)."
Failure Mode and Effects Analysis (FMEA):
The "Causality" Audit: 3 Ways to Find the Real Fix
A root cause analysis is only successful if it leads to a permanent process change. Before finalizing your findings on your Miro board, apply these three expert "health checks":
1. The "Symptom vs. Source" Audit
The Audit: Is your identified "root cause" actually just another symptom (e.g., "Human Error")?
The Fix: Audit your logic for Depth. "Human error" is almost never a root cause; it is a symptom of a poor process, lack of training, or bad interface design. If your RCA ends with "The employee made a mistake," keep digging. Ask: "What in our system allowed this mistake to happen?"
2. The "Linear vs. Systemic" Audit
The Audit: Does your analysis show a single straight line of events, or a web of contributing factors?
The Fix: Audit your Complexity. Most major failures are "Perfect Storms" caused by multiple small triggers. Use your template to map Contributing Factors—secondary issues that didn't cause the failure but made it worse. If your Miro board only shows one path, you’re likely missing the systemic gaps that will cause the next "random" failure.
3. The "Actionability" Stress Test
The Audit: Is your proposed solution "Pay more attention next time"?
The Fix: Audit your Corrective Actions. A professional RCA results in a "Hard Control" (a physical or digital change that makes the error impossible) rather than a "Soft Control" (a memo or a meeting). If your solution doesn't change the system, the root cause is still alive.
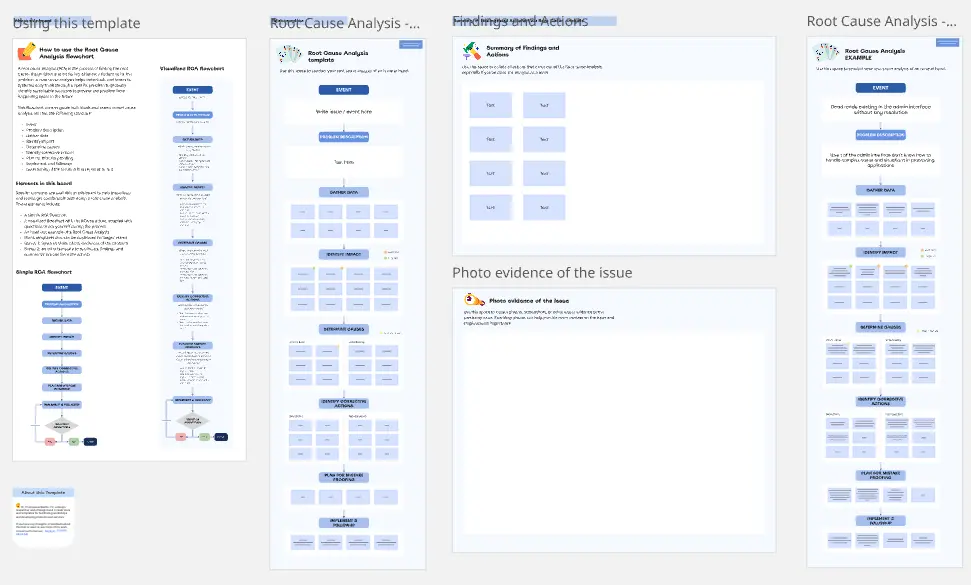
How to use the root cause analysis templates in Miro
Using Miro's free root cause analysis template is straightforward and can be broken down into a few simple steps:
Select a template: Start by choosing a root cause analysis template from Miro's template library. You can find templates for various RCA methods, such as the Fishbone Diagram, 5 Whys, and more.
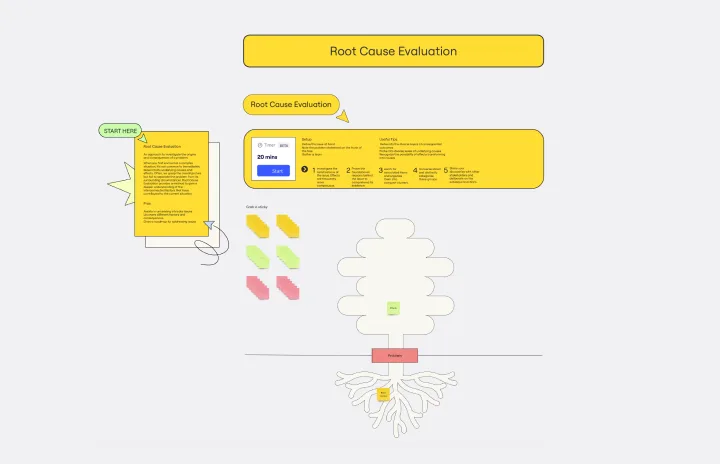
Define the problem: Clearly state the problem you are trying to solve. This will be the starting point for your analysis.
Gather data: Collect relevant data and information about the problem. This can include observations, reports, and input from team members.
Identify possible causes: Use the template to brainstorm and list all possible causes of the problem. Encourage team members to think broadly and consider all potential factors.
Analyze causes: Examine each potential cause in detail to determine its likelihood and impact. Use the template's structure to organize your findings and identify the most probable root causes.
Develop solutions: Once the root causes are identified, brainstorm potential solutions. Use the template to document these solutions and plan the steps needed to implement them.
Implement and monitor: Put your solutions into action and monitor their effectiveness. Use the template to track progress and make any necessary adjustments.
By following these steps, teams can effectively use Miro's root cause analysis templates to identify and solve problems, leading to improved processes and outcomes.