OODA Loop Template
Break down decisions systematically with the OODA Loop template.
About the OODA Loop Template
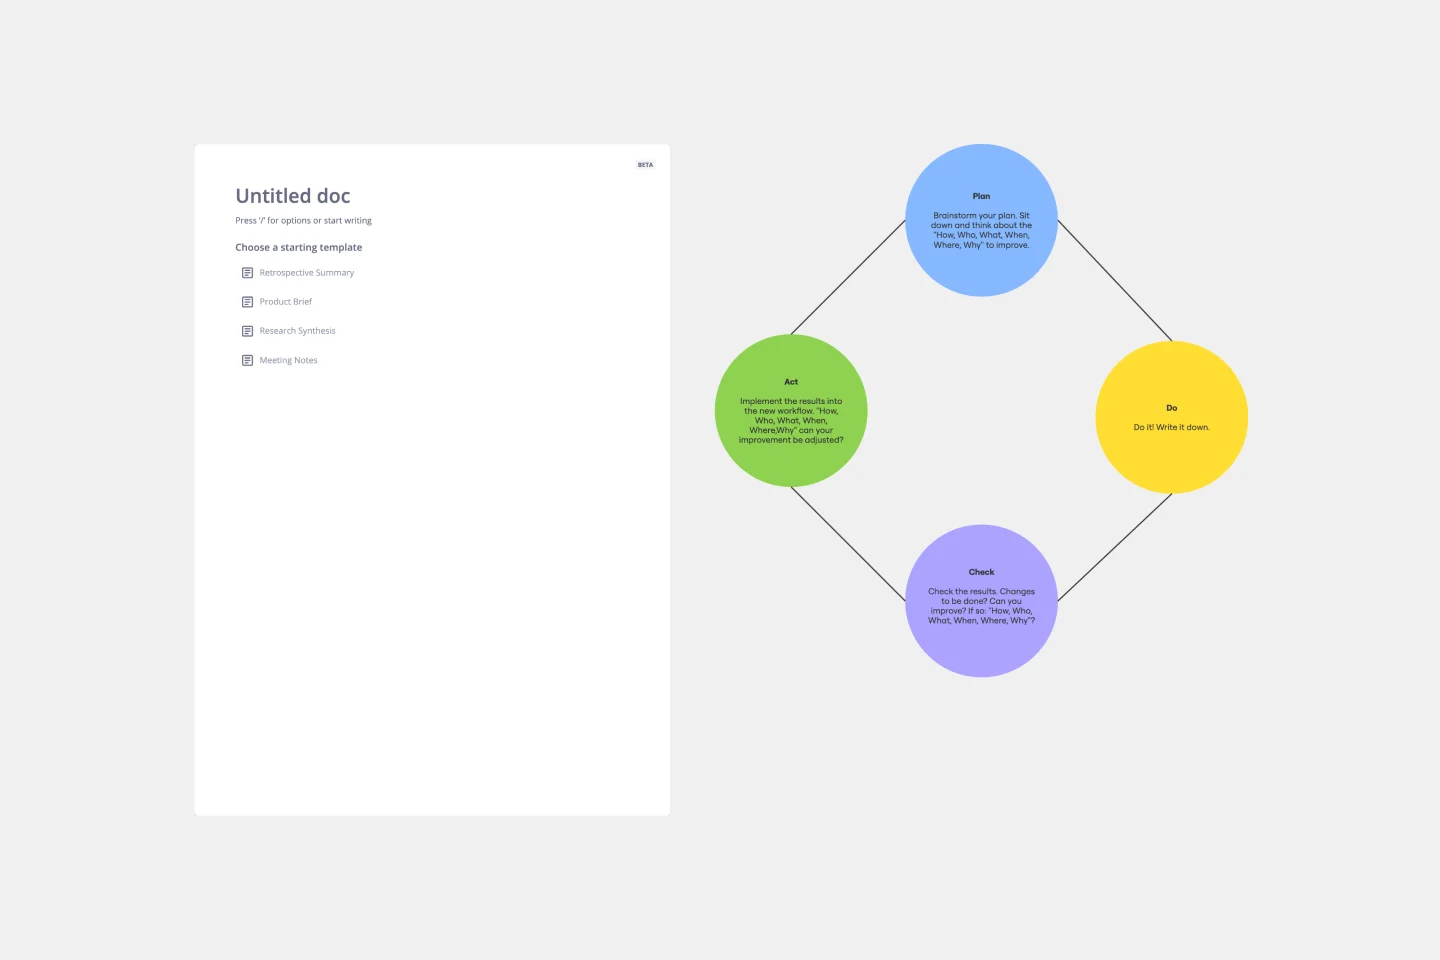
The OODA Loop template is a powerful tool to improve decision-making processes. It is inspired by the OODA Loop, a concept developed by military strategist Colonel John Boyd. The OODA Loop involves four steps that form a continuous cycle essential for quick and effective decision-making: Observe, Orient, Decide, and Act.
Let's take a closer look at each area:
Observe: Begin by gathering information and staying aware of your surroundings. This template section allows you to list key observations or data points.
Orient: Understand the context and analyze the information. In this area, you can outline the factors influencing your decision, including challenges, opportunities, and potential risks.
Decide: Make a well-informed decision based on your observations and orientation. The template provides space to document your chosen course of action and the rationale behind it.
Act: Execute your decision and implement the plan. This section helps you outline the steps to take and track progress.
How to use the OODA Loop template in Miro?
Edit with ease: Customize the template by clicking on any element to add text, shapes, or images that provide additional context.
Collaborate effortlessly: Invite team members to your board and collaborate in real time, ensuring everyone is on the same page throughout the decision-making process.
Why should you use an OODA Loop template?
Enhanced clarity: Visualizing the OODA Loop brings clarity to complex decision-making processes, making it easier to understand and communicate.
Faster decision-making: The structured approach of the OODA Loop template facilitates quicker decision-making by breaking down the process into manageable steps.
Improved collaboration: Collaborate seamlessly with team members using a shared visual representation of the decision-making cycle.
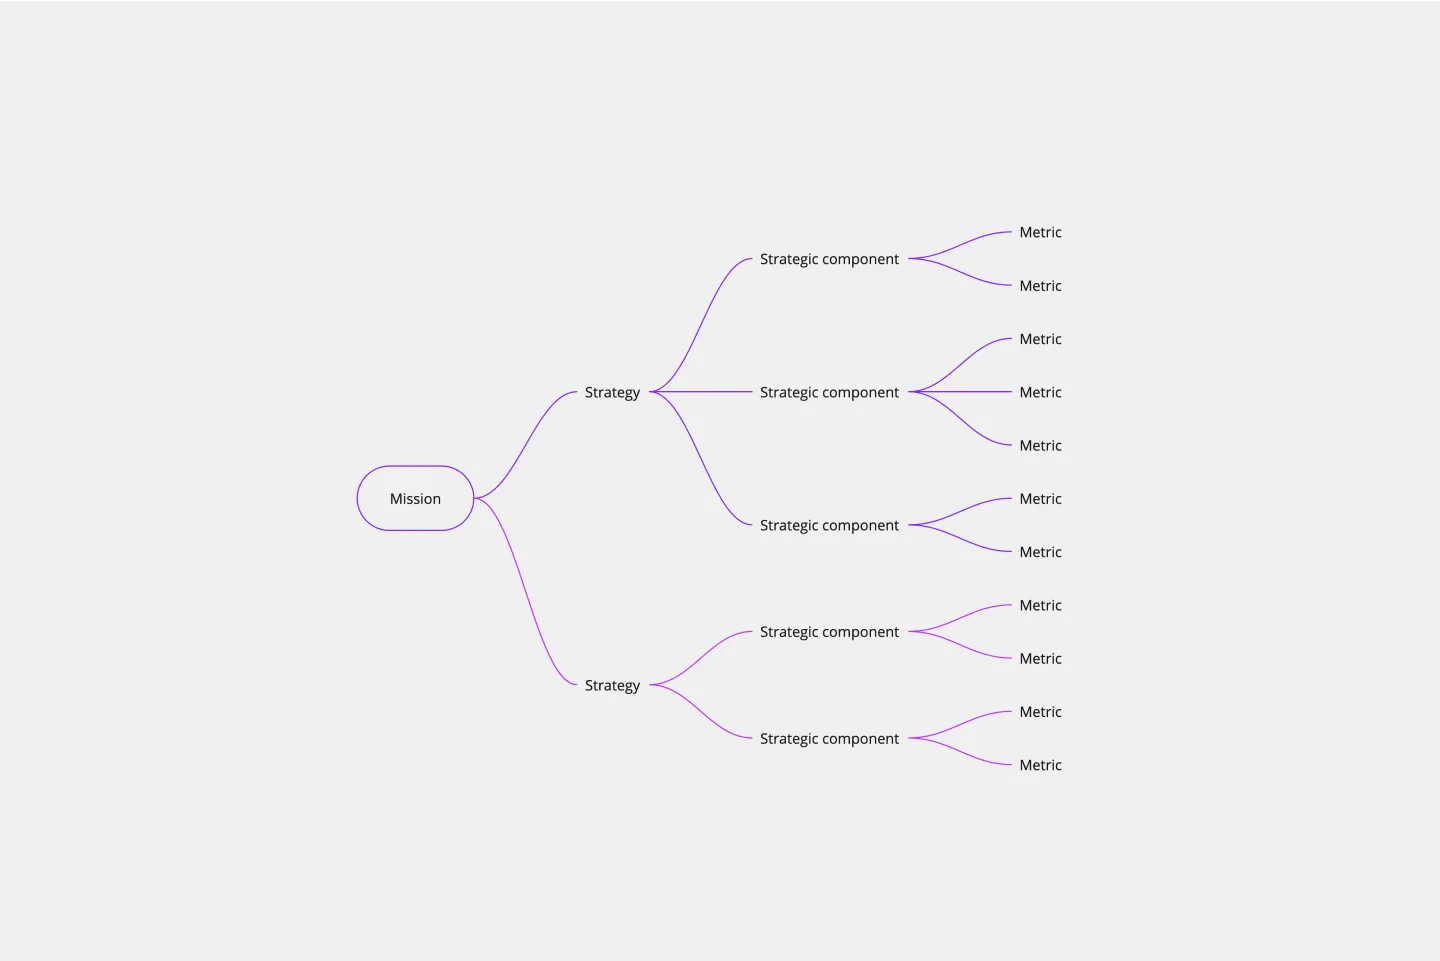
Strategic planning: The template aids in strategic planning by helping teams analyze and respond rapidly to changing situations.
Continuous improvement: Regularly revisiting and updating the OODA Loop Diagram fosters a culture of continuous improvement, ensuring your decision-making processes evolve with your team's needs.
Can I use the OODA Loop template for personal decision-making?
Absolutely! The template is versatile and can be adapted for personal decision-making, strategic planning, or any scenario where a systematic approach is beneficial.
How detailed should my observations be in the "Observe" section?
Provide enough detail to capture relevant information but focus on key observations to keep the process efficient. Adjust the level of detail based on the complexity of the decision.
Is the OODA Loop template suitable for small and large teams?
Yes, the template is scalable and can be effectively used by teams of any size. It promotes collaboration and aligns teams towards a shared decision-making process.
Can I export the OODA Loop Diagram to other formats for presentations or documentation?
Miro allows you to export your boards in various formats, making incorporating your OODA Loop into presentations, reports, or documentation easy.
Get started with this template right now.
Gantt Chart for Project Scheduling
Works best for:
Planning, Strategy
Gantt Chart for Project Scheduling helps you plan and visualize project timelines. It enables you to manage tasks, deadlines, and dependencies, ensuring efficient project execution. Ideal for project managers looking to streamline their scheduling process.
Strategy Diamond Template
Works best for:
Leadership, Operations, Strategic Planning
To achieve key objectives, every business assembles a series of strategies. But what elements should you consider when building a strategy? A strategy diamond is a collection of elements forming a coherent business strategy. These elements include: Arenas, Differentiators, Vehicles, Staging, and Economic Logic. Most strategic plans focus on just one or two of these elements, creating gaps that might cause problems for your business later on. A strategy diamond can help you stay focused and ensure you’re fulfilling all of your business’s needs rather than one or two.
Basic Venn Diagram
Works best for:
Venn Diagram
The Basic Venn Diagram template is a simple yet powerful tool for visualizing relationships between different sets. Use it to compare and contrast concepts, identify commonalities and differences, and organize information logically. This template is perfect for brainstorming, teaching, and presentations, making complex information more accessible and understandable. Ideal for educators, students, and professionals in various fields.
Cross Functional (Swimlane) Chart
Works best for:
Flowcharts, Mapping, Diagrams
The Cross Functional (Swimlane) Chart template offers a visual tool for mapping out processes or workflows with multiple stakeholders or functional areas. It provides swimlanes for organizing tasks and responsibilities by department or role. This template enables teams to visualize process flows, identify handoffs, and improve coordination and collaboration across functions. By promoting transparency and accountability, the Cross Functional (Swimlane) Chart empowers organizations to streamline workflows and drive cross-functional alignment effectively.
Target Audience Template
Works best for:
Marketing, Desk Research, Prioritization
Understanding your target audience is vital to business success. How can you market yourself effectively if you don’t know who you’re targeting? Using the Target Audience template, you can review valuable data about who your customers are and what they want from your product or service.
A3 Report Template
Works best for:
Product, Strategy and Planning
The A3 report template is a carefully designed tool that provides teams with a structured and visual methodology to tackle challenges. It divides the problem-solving process into background, current context, data analysis, and implementation plans, ensuring a comprehensive approach to each issue. One of the major advantages of this template is its "Data Analysis" section, which enables teams to delve deeply into concrete insights and trends. This data-driven approach ensures that all recommendations and actions are based on real, tangible evidence rather than just intuition, leading to more effective and strategic decision-making.