Force Field Analysis Template
Identify driving and restraining forces, prioritize actions, and build team consensus for effective decision-making with the force field analysis template.
About the Force Field Analysis Template
Force Field Analysis is a powerful tool that can help you identify and analyze the various factors that can impact the success of a project or initiative. The force field analysis template is a great way to get started with this technique, allowing you to quickly visualize and organize your thoughts in a collaborative and dynamic way.
What is the force field analysis template?
The force field analysis template is a simple yet effective way to understand and analyze the forces that can influence the success of your project. It consists of two main areas - driving forces and restraining forces - which can be broken down into more specific factors.
For example, driving forces might include factors such as increased revenue, improved customer satisfaction, or enhanced productivity, while restraining forces might include factors such as increased competition, budget constraints, or lack of resources.
How to use the force field analysis template in Miro
Here are the steps to use the Force Field Analysis template in Miro:
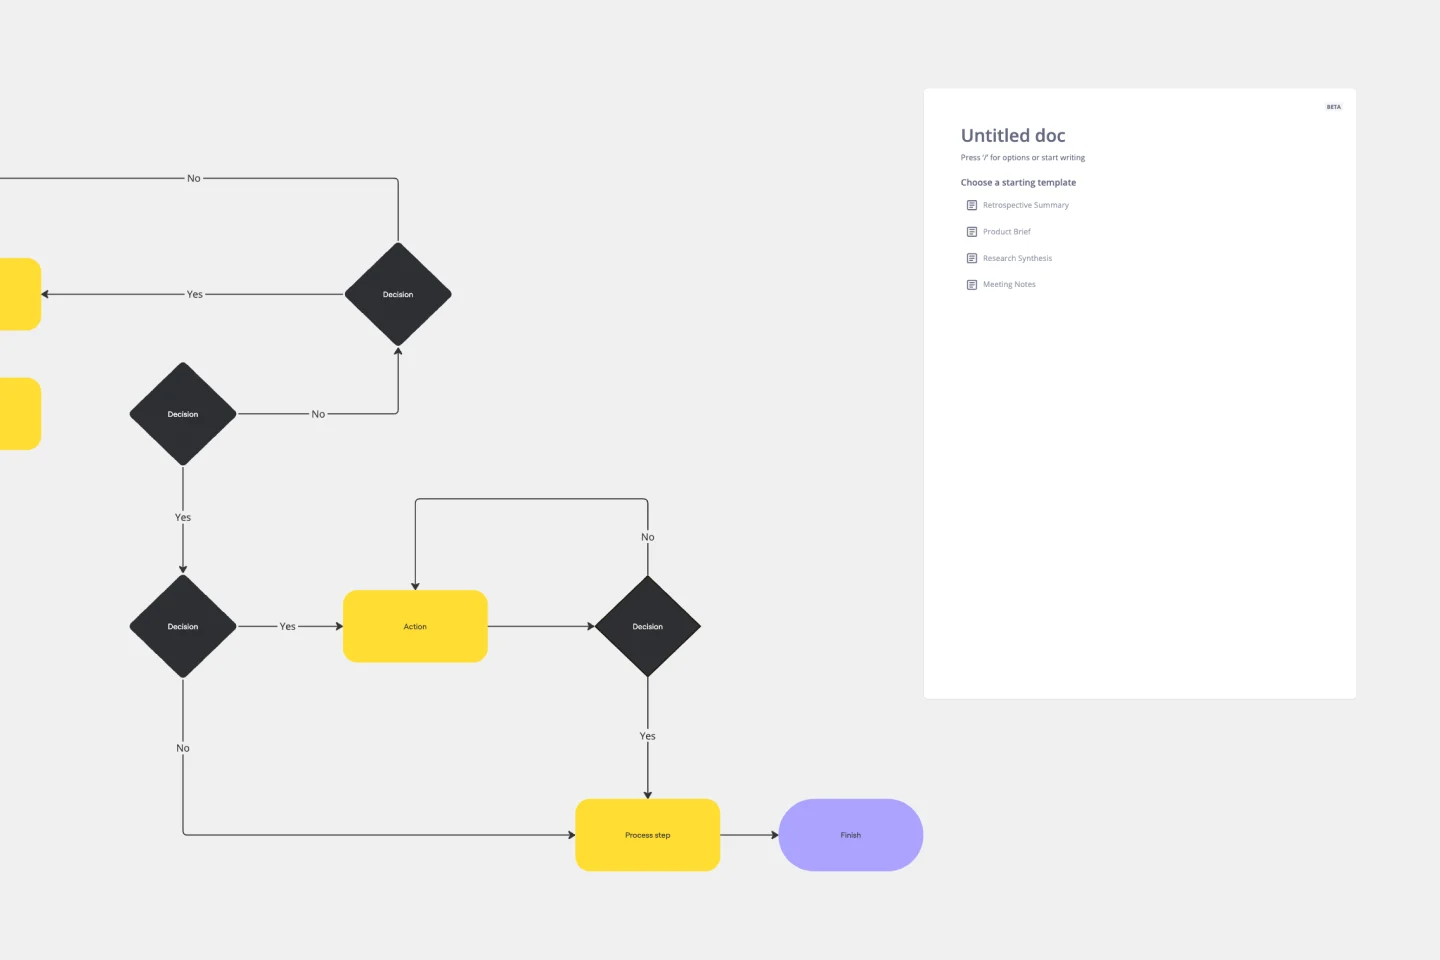
Open the template in your Miro board.
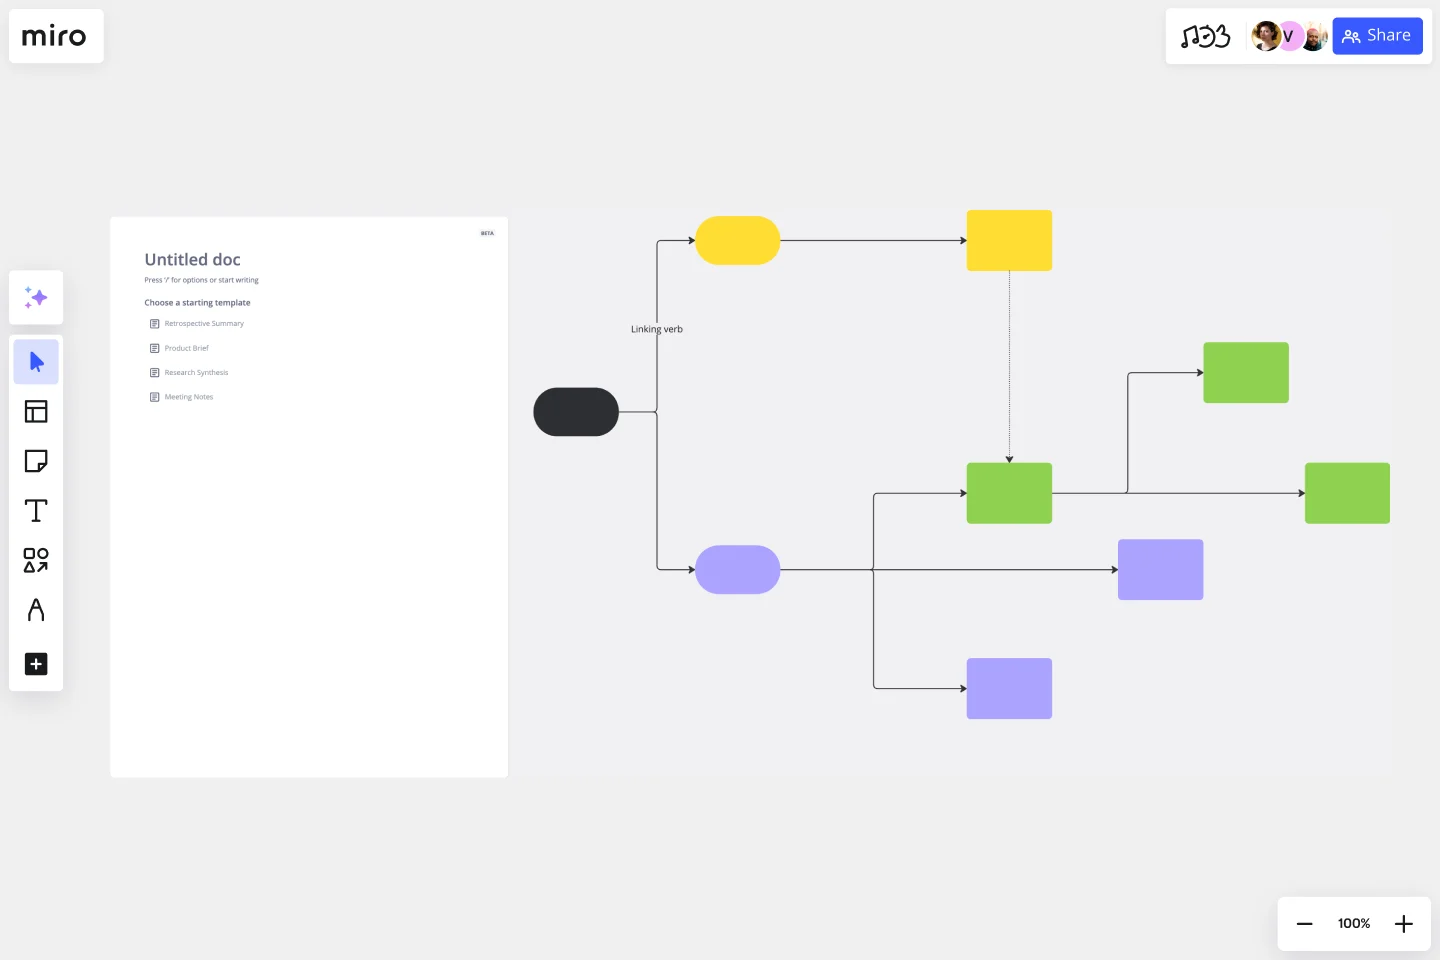
Start editing the template by adding or removing shapes and connector lines.
Use automated diagramming features to expand the template as needed.
Add any artifact on a Miro board to provide more context to your analysis.
Why should you use a force field analysis template?
There are many benefits to making a force field analysis, including:
Increased clarity: The template can help you identify the key factors that are driving or restraining your project, allowing you to focus on the most important areas.
Improved decision-making: By analyzing the various factors that impact your project, you can make more informed decisions about how to move forward.
Enhanced collaboration: The template allows you to work collaboratively with your team, fostering communication and collaboration.
Increased creativity: The force field analysis template helps you think outside the box and come up with innovative solutions to complex problems.
Better alignment: By identifying the key driving and restraining forces, you can ensure that your team is aligned around a common goal.
Do you need more advanced diagramming? Miro's extensive shape pack library, collaboration features, and technical diagramming capabilities provide robust solutions for teams.
Can I customize the template to fit my specific needs?
Absolutely! The template is fully customizable, allowing you to add or remove shapes and connector lines as needed.
How can I collaborate with my team on the template?
Miro allows for real-time collaboration, so you can work together with your team in real-time, no matter where you are.
Can I export the template to other platforms?
Yes, Miro allows you to export your templates to various formats, including PDF, PNG, and JPEG.
Get started with this template right now.
SIPOC Template
Works best for:
Agile Methodology, Strategic Planning, Mapping
A SIPOC diagram maps a process at a high level by identifying the potential gaps between suppliers and input specifications and between customers and output specifications. SIPOC identifies feedback and feed-forward loops between customers, suppliers, and the processes and jump-starts the team to think in terms of cause and effect.
Entity–Relationship Diagram (ERD) HR Management System Template
Works best for:
ERD
The Entity–Relationship Diagram (ERD) HR Management System Template in Miro is designed to streamline the management of employee-related information and processes within an organization. This template allows for the visualization and organization of complex HR systems, making it easier to understand relationships and processes. It enables users to map out departments, positions, and employee details, including attendance records, payroll, and performance reviews.
OutSystems Architecture Diagram
Works best for:
Diagramming
The OutSystems Architecture Diagram template offers a visual tool for designing and documenting software architectures using the OutSystems platform. It provides elements for modeling application components, data structures, and integration points. This template enables teams to visualize and communicate the architecture of their OutSystems applications, facilitating collaboration and alignment among developers and stakeholders. By promoting clarity and understanding of system architecture, the OutSystems Architecture Diagram empowers teams to build scalable, maintainable, and high-performance applications effectively.
Cycle Diagram Template
Works best for:
Diagramming
The cycle diagram template empowers professionals to visually represent complex cycles with precision and clarity. This template maps out cyclical processes, relationships, or events, ensuring that complex concepts are communicated seamlessly. One key benefit that sets this template apart is its ability to streamline communication and enhance understanding. By crafting visually appealing cycle diagrams, professionals can distill complex information into a clear visual language, making it easier for teams and stakeholders to grasp complex relationships. This ultimately fosters more effective collaboration and decision-making.
Data Flow Diagram Template
Works best for:
Flowcharts, Software Development, Diagrams
Any process can get pretty complex, especially when it has multiple components. Get a better grasp of your process through a data flow diagram (DFD). DFDs create a simple visual representation of all components in the flow of data and requirements in an entire system. They’re most often used by growth teams, data analysts, and product teams, and they’re created with one of three levels of complexity—0, 1, or 2. This template will help you easily build the best DFD for your process.
Cross Functional (Swimlane) Chart
Works best for:
Flowcharts, Mapping, Diagrams
The Cross Functional (Swimlane) Chart template offers a visual tool for mapping out processes or workflows with multiple stakeholders or functional areas. It provides swimlanes for organizing tasks and responsibilities by department or role. This template enables teams to visualize process flows, identify handoffs, and improve coordination and collaboration across functions. By promoting transparency and accountability, the Cross Functional (Swimlane) Chart empowers organizations to streamline workflows and drive cross-functional alignment effectively.