Journey Map To Plot the Customer Experience
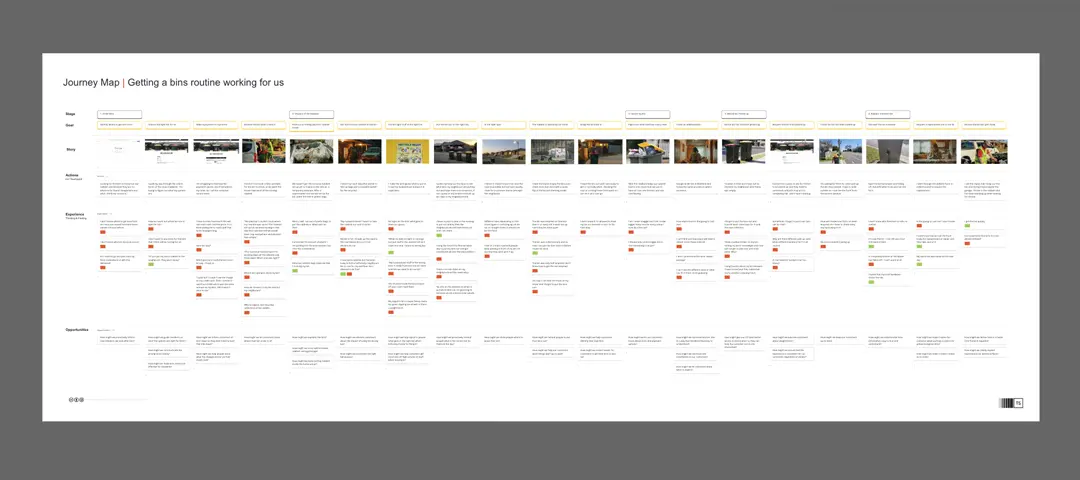
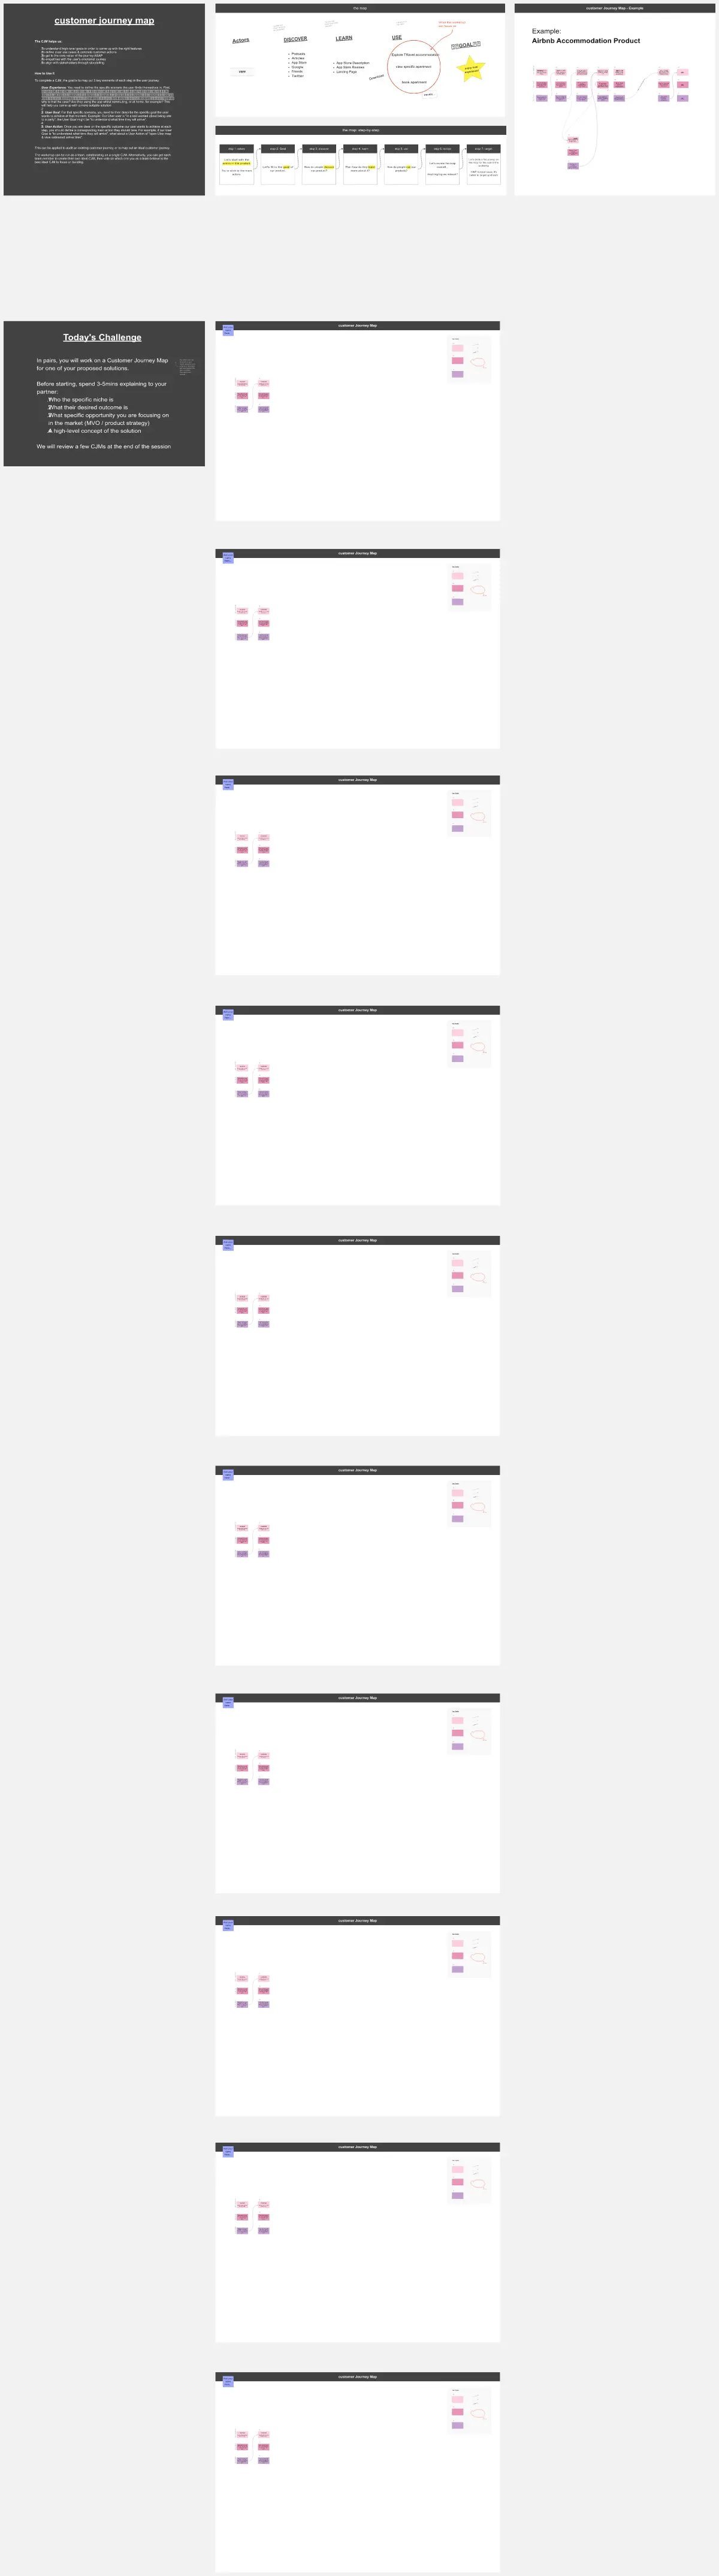
A journey is a tool to map out the customer experience of (a part of) your product/service in a visual way.
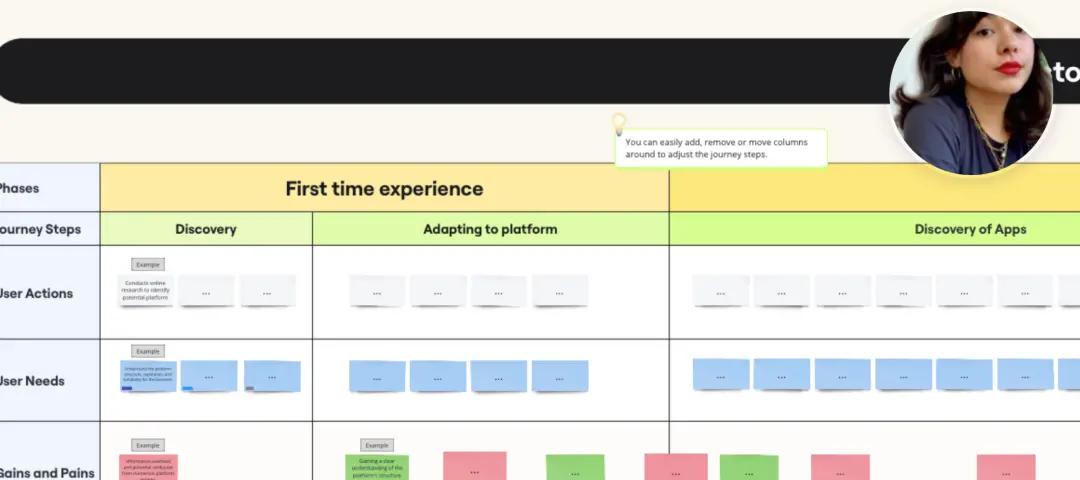
Suppose your organization provides a product or service, for example, mobile phone subscriptions. On your Journey Map, you will find a customer who goes through the process of selecting and purchasing a subscription (scenario), how the customer perceives each step (experience), what you learned about the overall needs of your customers (insights), and what can still be improved (opportunities). A journey map will serve your organization in understanding how your customers interact with your product/service and it helps see opportunities to improve the customer experience.This sounds more difficult than it is, but use this template and you will be guided step-by-step in making your own journey map.From our experience as a service design agency, we also provide you with tips and examples for how you can use a Journey Map for empathizing with your customer and improving your customer experience. Additionally, a Journey Map can be used to gain a complete overview of your services and improve collaboration between your departments.Our instructions for making your own Journey Map:
The scenario: Determine the scenario and profile. With this scenario, sketch a first draft of what this journey could look like from the perspective of your customer. You can enrich the scenario by adding drawings or pictures.
The research insights: collect and plot existing data on the journey map (reviews, earlier research, and personas). Look for knowledge gaps and assumptions that need validation. Execute user research to collect additional insights about the customer experience (i.e. interviews or observations). Analyze this data and cluster corresponding findings, quotes and insights and plot these on your journey map.
The customer experience: Define the customer experience based on the research and insights collected, and draw the emotion curve. Here you emphasize where things go well and where improvement is needed. Determine which steps make or break the overall experience and where to focus first.
The opportunities: Together with key stakeholders, analyze the journey to spot opportunities that can improve your customer experience. The journey might contain a lot of information and opportunities, so summarise the key takeaways to make the journey actionable, and determine what the next steps will be.
This template was created by Essense.
Get started with this template right now.
PEST Analysis Template
Works best for:
Ideation, Strategic Planning, Business Management
No business operates inside a vacuum, so if you want to succeed, you have to successfully deal with local laws, government regulating bodies, the health of the local economy, social factors like the unemployment rate, average household income, and more. Use the PEST Analysis Template to help you explore how the world impacts your business and how you can work around it.
Plant Care App Wireframe Template
Works best for:
Wireframe, UX, Design
The Plant Care App Wireframe template provides a multi-screen app wireframe along with all the necessary design pages to get started. You can easily customize the wireframe to meet the specific needs of your client or personal project. Add, remove, or adjust screens to create a smooth user flow, and personalize the design by modifying colors, typography, and layouts. Leverage our AI-powered features to further enhance your app design.
ICS Org Chart Template
Our carefully crafted ICS Org Chart Template is an invaluable tool designed to clearly represent the hierarchical structure of the Incident Command System (ICS). It simplifies the complex web of roles, responsibilities, and chains of command within the ICS, providing a structured blueprint for both experienced professionals and those new to the system. The template's most notable benefit is its ability to foster immediate understanding, bridging the gap between intricate organizational structures and the teams navigating them. Teams that use this template can ensure that everyone is aligned, understands their role, and collaborates efficiently, thereby reducing potential bottlenecks and misunderstandings.
Driver Diagram Template
Works best for:
Diagramming
The driver diagram template is a strategic visual tool that helps teams map out their primary objectives and break them down into actionable components. It presents goals, drivers, and specific change ideas in a coherent and interconnected format, ensuring clarity of objective. By doing so, every team member is aligned towards a common endpoint, fostering unified efforts. The visual nature of the template simplifies complex objectives, making it easier for teams to stay on track and measure their progress effectively.
Bubble Map Template
Works best for:
Diagramming, Mapping, Brainstorming
A Bubble Map Template is a visual organization tool that uses bubbles or circles to represent various ideas or data points. These bubbles are linked together, displaying their relationships and creating a network of interconnected thoughts. Use a Bubble Map Template to streamline complex information, enhancing comprehension and promoting efficient decision-making.
Workflow Template
Works best for:
Project Management, Workflows
The digital world requires collaboration, and better collaboration leads to better results. A workflow is a project management tool that allows you to sketch out the various steps, resources, timeline and roles necessary to complete a project. It can be used on any multi-step project, whether it’s a business process or otherwise, and is ideal for plotting out the tangible actions you’ll need to take to achieve a goal and the order in which you need to complete those actions.