How Now Wow Matrix Template
Brainstorm and organize ideas based on their originality and ease of implementation.
About the How Now Wow matrix template
What is How Now Wow?
Brainstorming is difficult — but it becomes increasingly difficult as you scale. As you release more and more innovative products and services, it’s harder for your team to get creative. Complicated workflows, hard judgment calls, and resource constraints often force you to be conservative when you’d rather take risks. To overcome this challenge and reinvigorate your team, you can use the How Now Wow matrix.
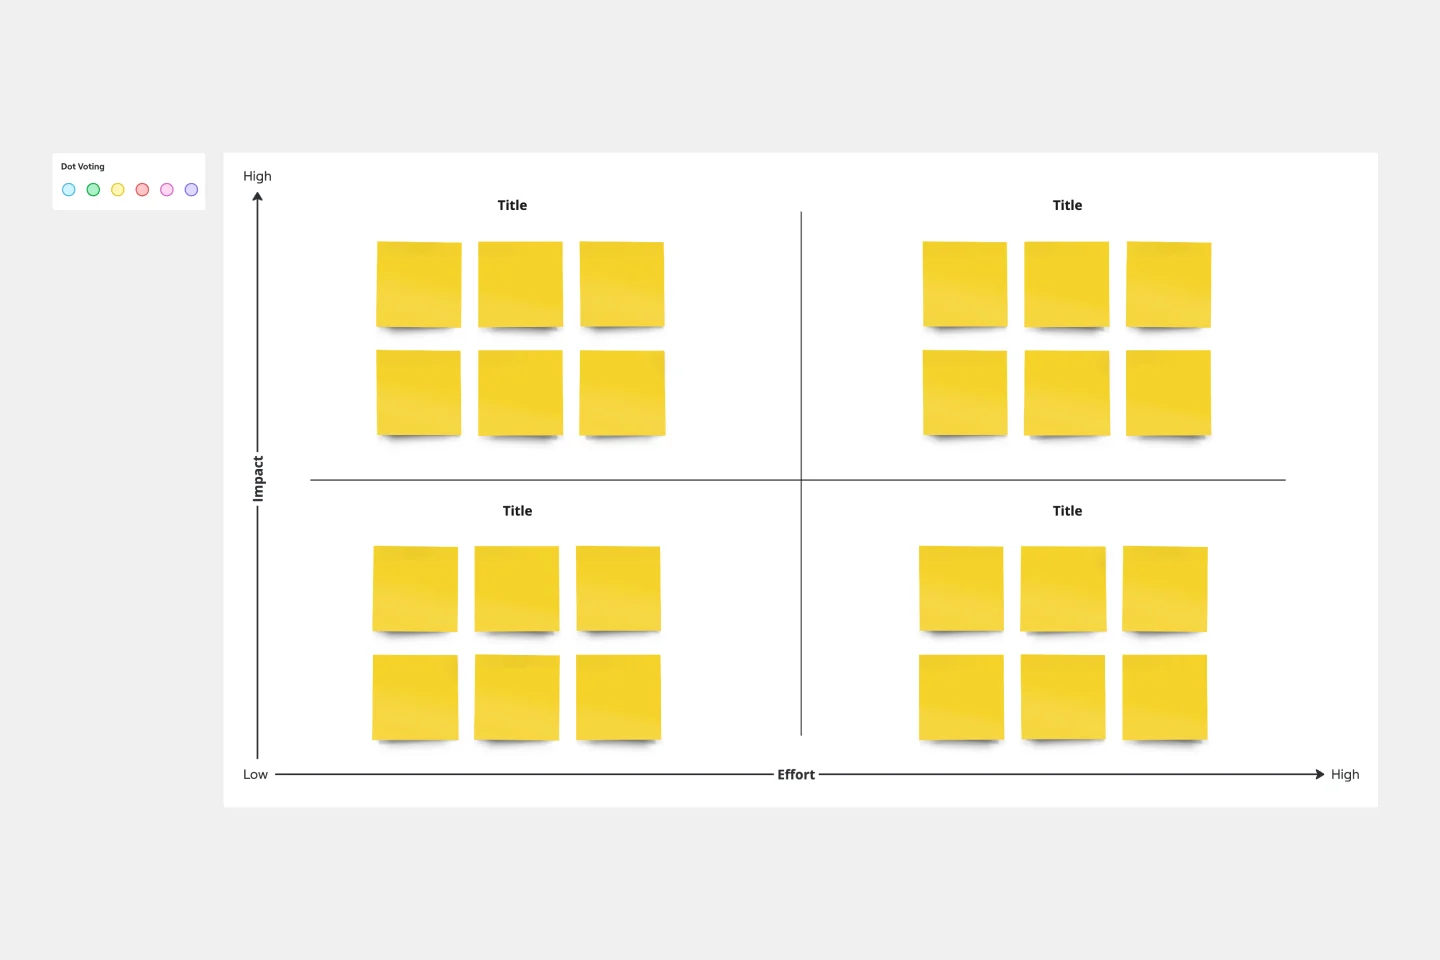
The How Now Wow matrix is a game that fosters creativity. It consists of a 2x2 matrix with “originality” on the X-axis and “feasibility” on the Y-axis. You work with your team to file your ideas into each category. Working through the matrix can empower you to overcome creative roadblocks.
How do you use the How Now Wow matrix?
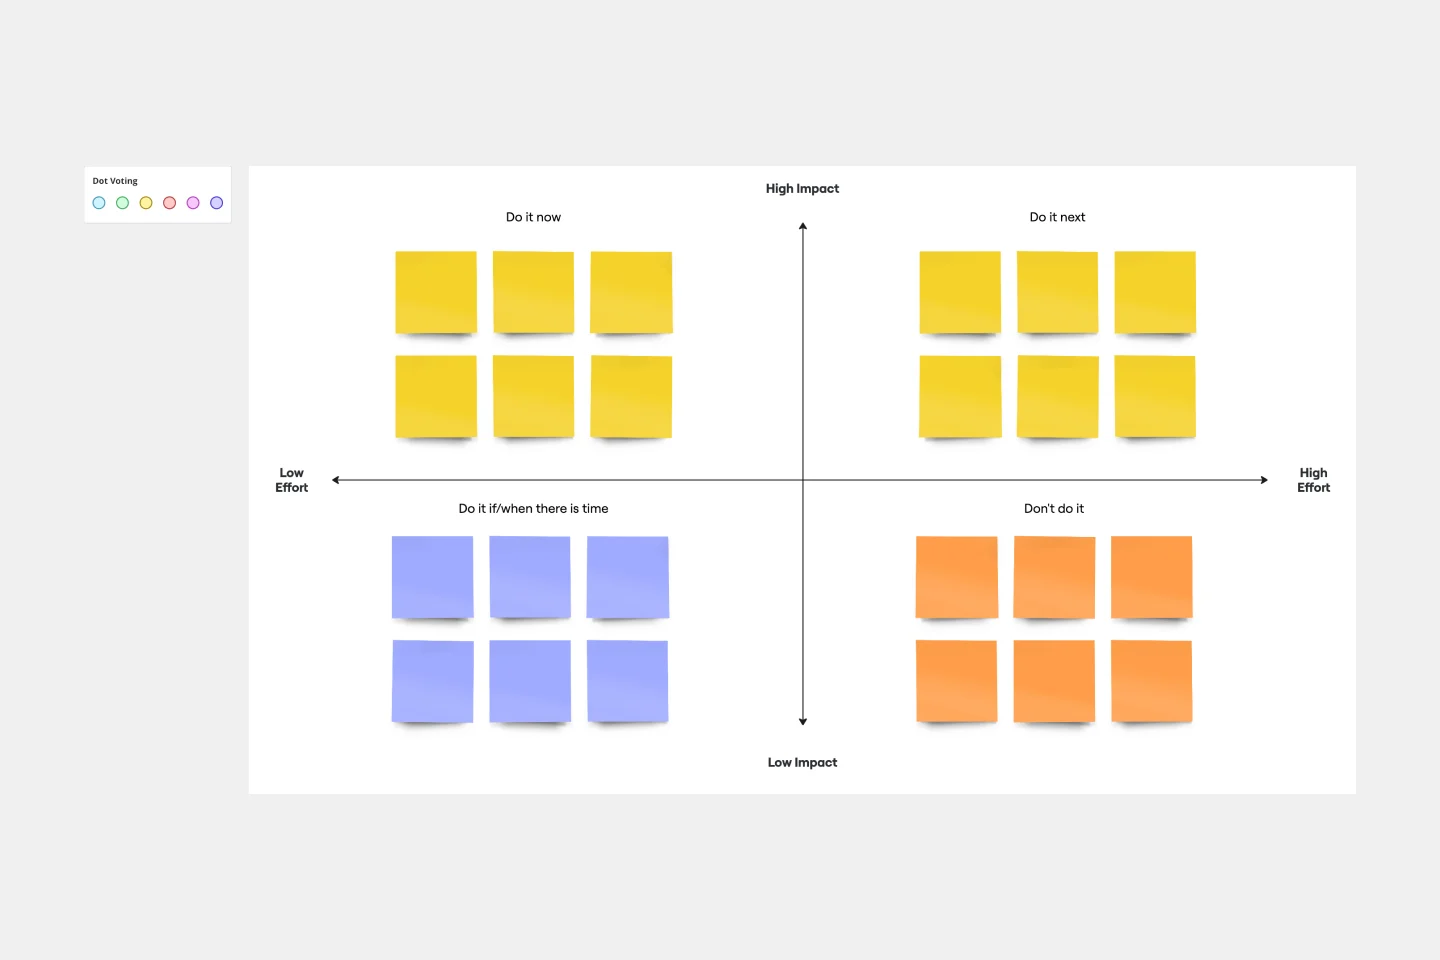
The horizontal axis represents originality and rates ideas as normal or innovative. The vertical axis represents ease of implementation and rates ideas as easy or difficult to implement. Ideas that are unoriginal and challenging probably aren’t worth pursuing. “How” ideas that are innovative but difficult to execute may need further work before you can act upon them. “Now” ideas are generally considered low-hanging fruit. “Wow” ideas are both innovative and relatively easy to implement, so this is where you’ll want to try to focus your attention.
The 3 Aspects of How Now Wow
How: Difficult to implement.
This category consists of ideas that are innovative but infeasible. It’s a helpful way to set ambitious goals for the future.
Now: Easy to implement.
These ideas are familiar, so you know they work well.
Wow: Original and easy to implement.
This category describes creative ideas that are relatively simple to execute. Try to file as many ideas into this category as possible.
Who can use the How Now Wow matrix?
The How Now Wow matrix is versatile enough to be used by any number of teams. Use it whenever you’d like to encourage your team to do creative brainstorming. In order to encourage maximum creativity, you may find it beneficial to break teams into smaller groups or let people brainstorm individually before sharing their ideas with a larger group.
Get started with this template right now.
Venn Diagram Practical Applications
Works best for:
Venn Diagram
The Venn Diagram for Practical Applications template helps you apply Venn diagrams to real-world scenarios. Use this template to solve problems, identify relationships, and make decisions based on clear visual analysis. It's perfect for practical tasks such as project planning, resource allocation, and strategic decision-making. This tool is ideal for business professionals, educators, and anyone looking to apply theoretical concepts to practical situations.
Mental Model Template
Works best for:
Business Management, Mind Mapping, Diagrams
Smart solutions and strong, strategic decisions. The best organizations make both, and a mental model is designed to help them do it. We give you a fast and easy way to try it out — just fill out our ready-made, flexible template and add sticky notes, shapes, and arrows to create a powerful map.
Burndown Chart Template
Works best for:
Project Management, Agile Workflows, Mapping
Whoa whoa whoa, pace yourself! That means knowing how much work is left—and, based on the delivery date, how much time you’ll have for each task. Perfect for project managers, Burndown Charts create a clear visualization of a team’s remaining work to help get it done on time and on budget. These charts have other big benefits, too. They encourage transparency and help individual team members be aware of their work pace so they can adjust or maintain it.
3-Circle Venn Diagram
Works best for:
Education, Diagrams, Brainstorming
Venn diagrams have been a staple of business meetings and presentations since the 1800s, and there’s a good reason why. Venn diagrams provide a clear, effective way to visually showcase relationships between datasets. They serve as a helpful visual aid in brainstorming sessions, meetings, and presentations. You start by drawing a circle containing one concept, and then draw an overlapping circle containing another concept. In the space where the circles overlap, you can make note of the concepts’ similarities. In the space where they do not, you can make note of their differences.
Four-Circle Venn Diagram
Works best for:
Venn Diagram
The Four Circle Venn Diagram template is designed for comparing four sets of data. Use this tool to identify commonalities and differences across multiple categories. This template is ideal for complex data analysis, strategic planning, and academic research. It helps you visually organize information, making it easier to understand and communicate insights. Perfect for educators, researchers, and professionals in need of detailed comparison tools.
Bull's Eye Diagram Template
Works best for:
Diagrams, Project Management, Prioritization
When you’re a growing organization, every decision can feel like it has make-or-break consequences—which can lead to decision paralysis, an inability to prioritize, inefficient meetings, and even low morale. If that sounds like you, put a Bull’s Eye Diagram to work. True to its name, a Bull’s Eye Diagram uses a model of concentric circles to help companies establish priorities, make critical decisions, or discuss how to remove or overcome obstacles.