
Fishbone Diagram
The Fishbone Diagram is a powerful visual tool used to identify and analyze the root causes of a problem or issue.
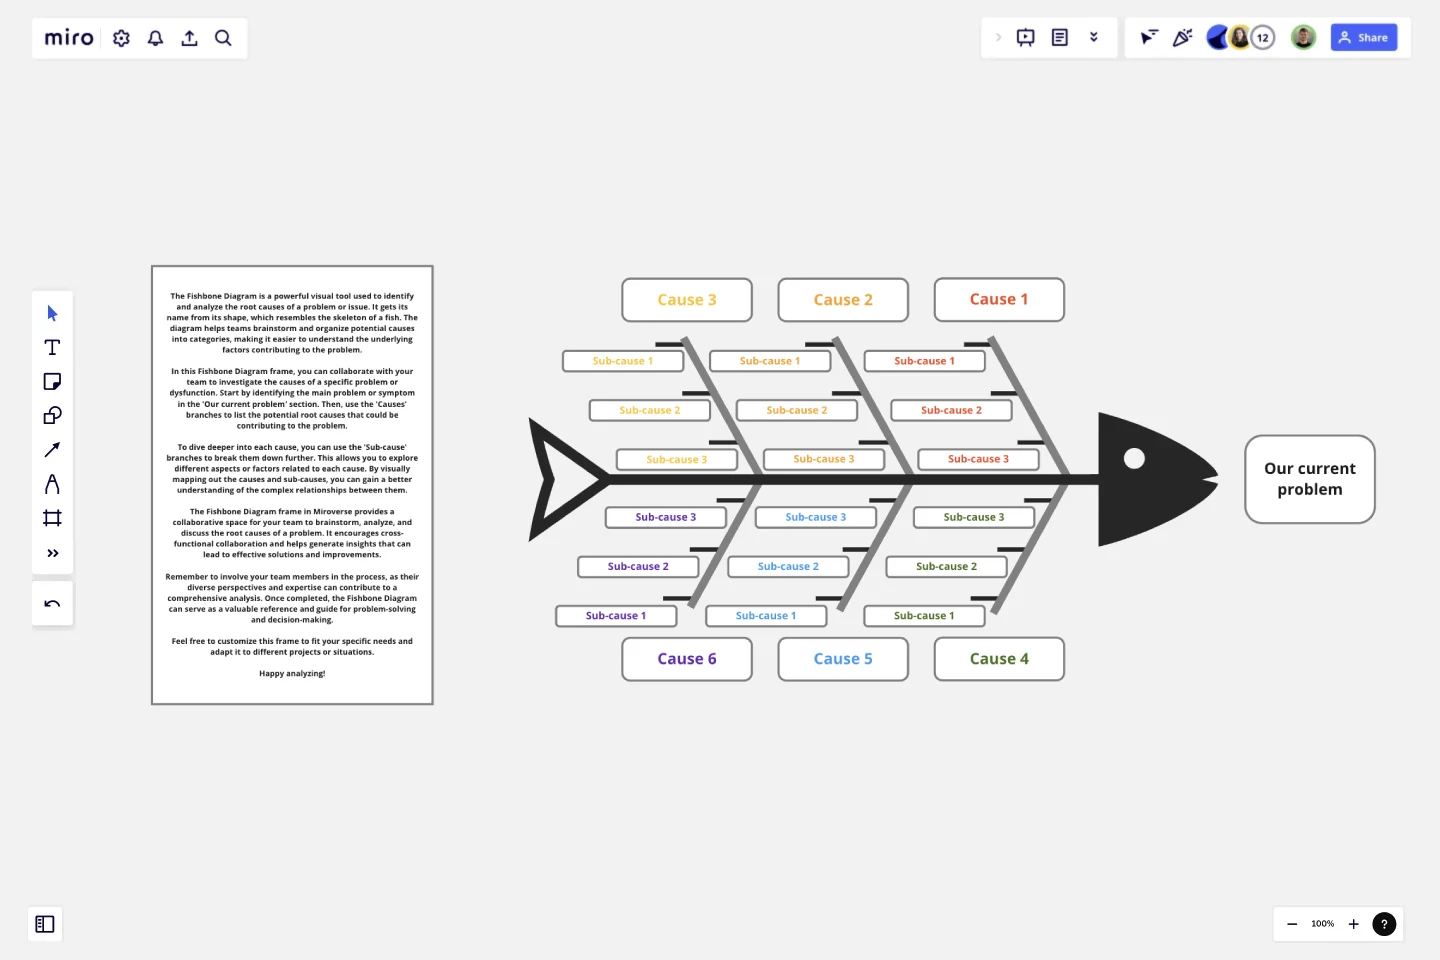
The Fishbone Diagram is a powerful visual tool used to identify and analyze the root causes of a problem or issue. It gets its name from its shape, which resembles the skeleton of a fish. The diagram helps teams brainstorm and organize potential causes into categories, making it easier to understand the underlying factors contributing to the problem.
In this Fishbone Diagram frame, you can collaborate with your team to investigate the causes of a specific problem or dysfunction. Start by identifying the main problem or symptom in the 'Our current problem' section. Then, use the 'Causes' branches to list the potential root causes that could be contributing to the problem.
To dive deeper into each cause, you can use the 'Sub-cause' branches to break them down further. This allows you to explore different aspects or factors related to each cause. By visually mapping out the causes and sub-causes, you can gain a better understanding of the complex relationships between them.
The Fishbone Diagram frame in Miroverse provides a collaborative space for your team to brainstorm, analyze, and discuss the root causes of a problem. It encourages cross-functional collaboration and helps generate insights that can lead to effective solutions and improvements.
Remember to involve your team members in the process, as their diverse perspectives and expertise can contribute to a comprehensive analysis. Once completed, the Fishbone Diagram can serve as a valuable reference and guide for problem-solving and decision-making.
Feel free to customize this frame to fit your specific needs and adapt it to different projects or situations. Happy analyzing!
Get started with this template right now.
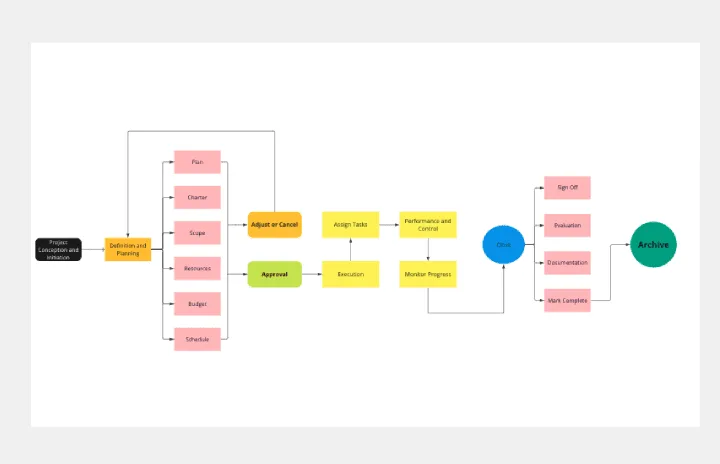
Project Management Flow Chart
Works best for:
Flowcharts, Diagrams, Mapping
The Project Management Flow Chart template offers a visual tool for planning and managing projects using flowchart diagrams. It provides elements for mapping out project phases, tasks, dependencies, and timelines. This template enables project managers and teams to visualize project workflows, identify critical paths, and track progress effectively. By promoting clarity and transparency, the Project Management Flow Chart empowers organizations to deliver projects on time, within budget, and according to specifications.

Entity Relationship Diagram Template
Works best for:
Flowcharts, Strategic Planning, Diagrams
Sometimes the most important relationships in business are the internal ones—between the teams, entities, and actors within a system. An entity relationship diagram (ERD) is a structural diagram that will help you visualize and understand the many complex connections between different roles. When will an ERD come in handy? It’s a great tool to have for educating and onboarding new employees or members of a team, and our template makes it so easy to customize according to your unique needs.
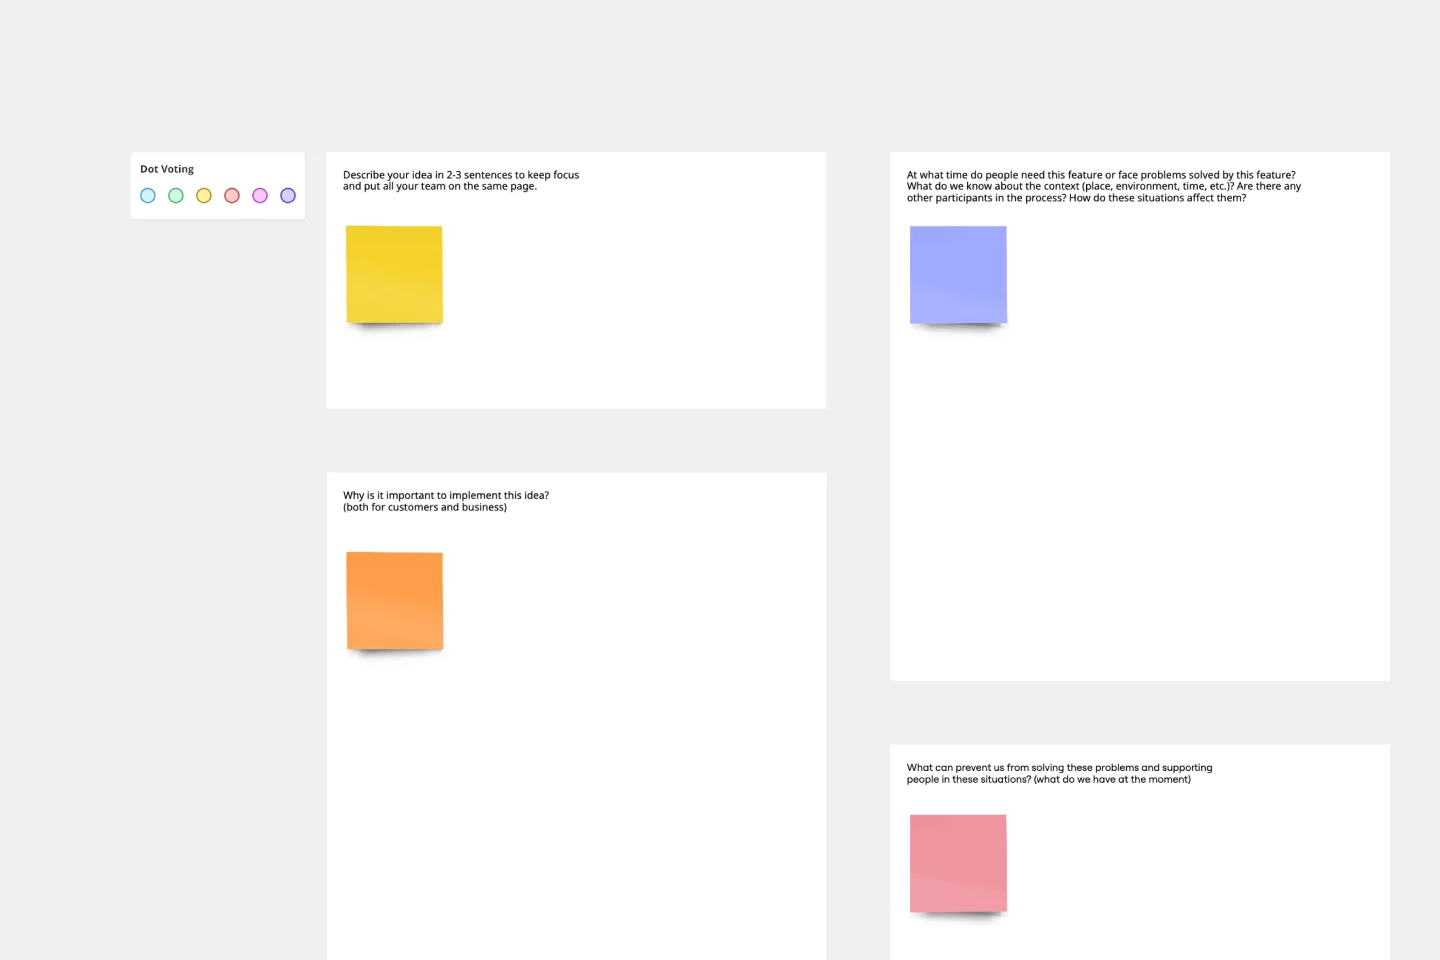
Feature Canvas Template
Works best for:
Design, Desk Research, Product Management
When you’re working on a new feature that solves a problem for your users, it’s easy to dive right in and start looking for solutions. However, it’s important to understand the initial user problem first. Use the Feature Canvas template to do a deep-dive into the user’s problems, the context in which they will use your feature, and the value proposition you will deliver to your users. The template enables you to spend more time exploring the problem to anticipate any potential blind spots before jumping into solutions mode.
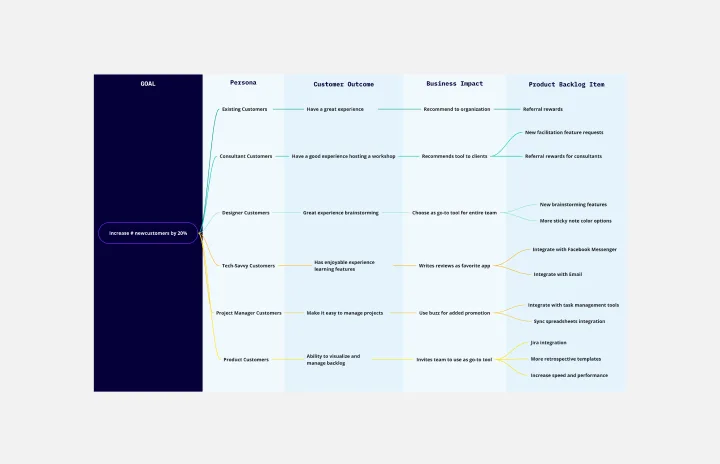
Outcome Mapping Template
Works best for:
Diagrams, Mapping, Project Management
Use Miro’s outcome mapping template to improve your operational efficiency. Outcome mapping will help you visualize all the possible strategic outcomes for your upcoming project, allowing you to see into the black box to identify any potential challenges along the way.

Product Market Fit Board
Works best for:
Product Management, Planning
The Product Market Fit Board template helps product teams assess and validate product-market fit. By capturing user feedback, analyzing market trends, and tracking key metrics, this template enables teams to evaluate product-market alignment objectively. With sections for defining target segments, identifying pain points, and prioritizing features, it guides teams through the process of optimizing product-market fit. This template serves as a tool for iteratively refining products to meet customer needs and drive market success.

Improve Any Product - Product Management
Works best for:
Product Management, Planning
Improve Any Product - Product Management template provides a structured framework for enhancing product quality and performance. By analyzing customer feedback, identifying improvement areas, and implementing iterative enhancements, this template empowers product managers to optimize product features and functionalities. With sections for prioritizing enhancements and tracking progress, it facilitates continuous improvement efforts, ensuring that products meet evolving customer needs and market demands.