Status Report Template
Keep track of your team’s status and resolve issues together.
About the Status Report Template
A status report should ideally prove a change happened over time. Want to outline the current state of your project? That sounds like a project status report.
The status report emphasizes and maps out a project’s chain of events. If you’re a project manager, you can use this report to keep historical records of project timelines. Ideally, any project stakeholder should be able to look at a status report and answer the question, “Where are we, and how did we get here?”
This template is only a starting point. You can also customize the name of this template according to team values or behaviors you want to prioritize, such as “progress report,” or “situation report,” or “implementation report.”
What is a status report?
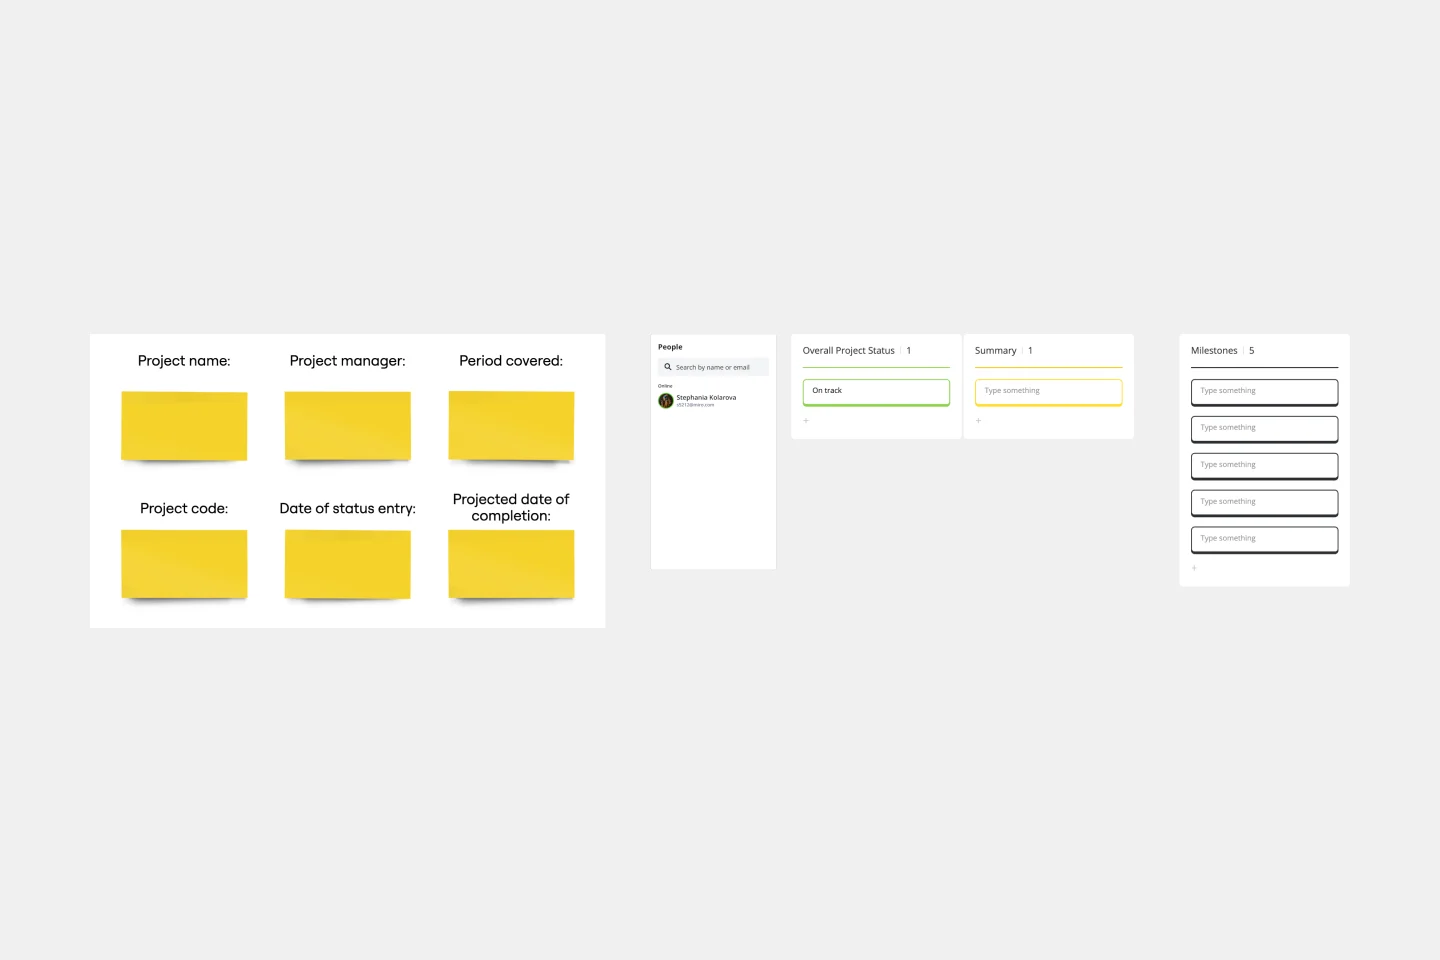
A status report summarizes how your project is progressing against a projected plan or outcome. It can include a summary of your project or initiative, delivery dates, and any obstacles or outstanding action items.
It can be a quick and systematic way to:
Encourage stakeholder buy-in
Make project milestone progress transparent
Identify and correct roadblocks before they happen
When to use a status report
A status report can be weekly or monthly at a CEO- or team-level. How often you send out a status report depends on who needs to be aware of your team’s highlighted milestones and accomplishments.
A weekly status report is usually created on short notice for a team, its manager, and a key stakeholder.
A monthly status report can reassure high-level managers that projects remain under control. High-level information can include confidence levels, timelines, and risks or roadblocks. There should be no surprises, whether they are problems or big wins.
A CEO-level status report drives buy-in and visibility from the top level of the company. You can include a Frequently Asked Questions (FAQs) section to demonstrate how your team proactively responds to questions.
For busy teams handling multiple projects, a separate monthly team status report can focus on resource allocation. This approach can help managers allocate time and resources to the right people for the right projects.
Create your own status report
Making your own status reports is easy. Miro’s infinite canvas is the perfect place to create and share them. Get started by selecting the status report template, then take the following steps to make one of your own.
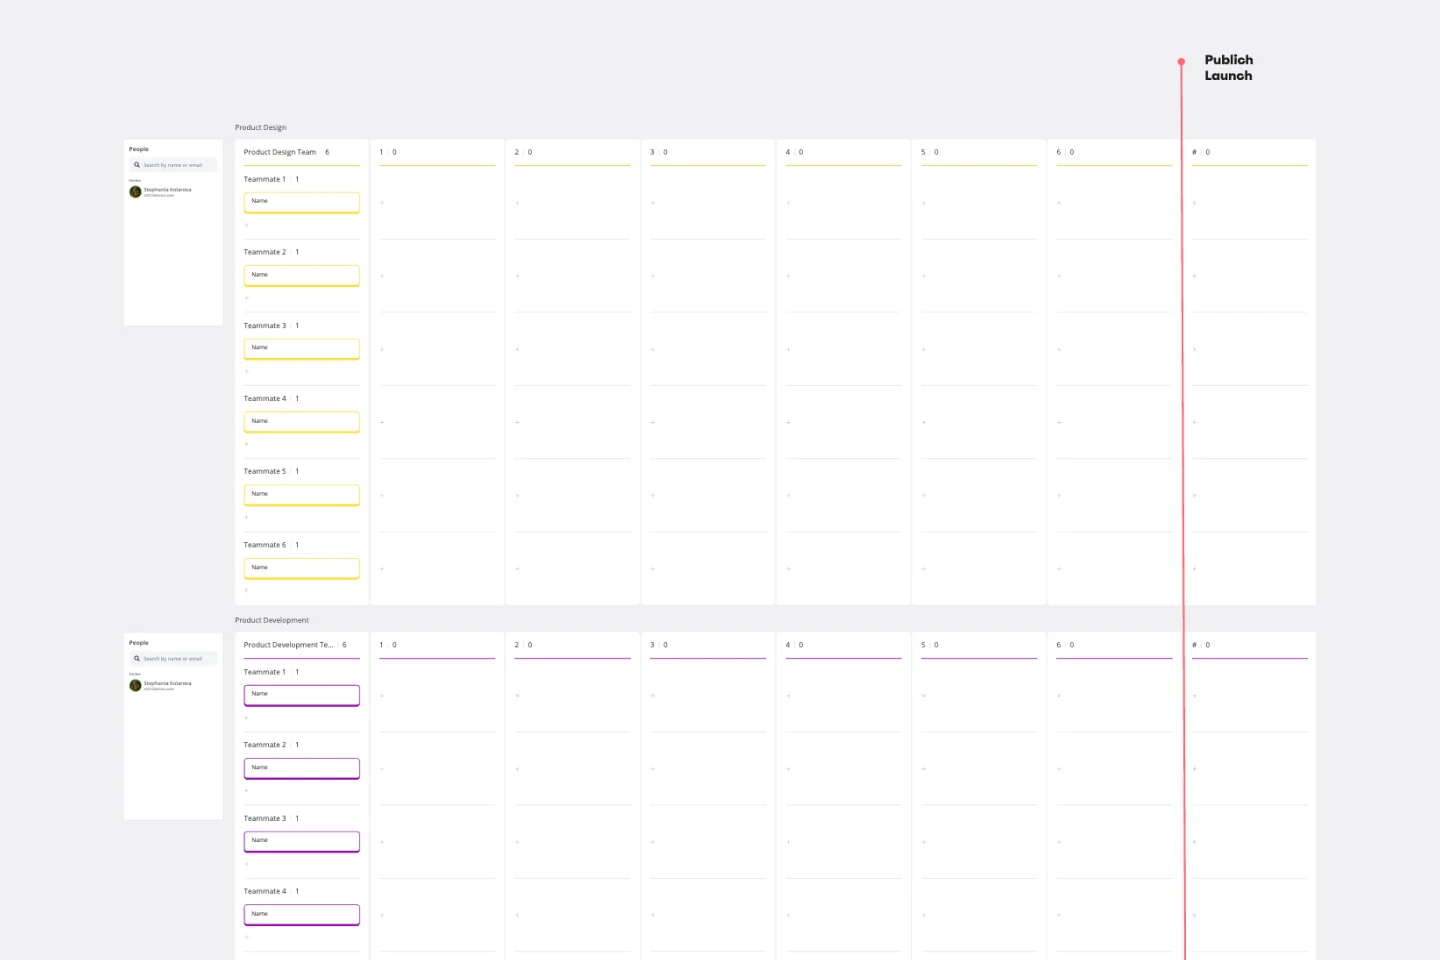
1. Clarify your project goals
This includes your project themes, milestones, deliverables, and team members who will be involved. Ask questions, too: “How do we measure success? What challenges might we face? What should we try to learn from this?”
2. Set up your Objectives and Key Results (OKRs)
Keep things time-boxed and be transparent when filling in the details: what are the key goals for your set time frame? If you haven’t already set up team OKRs, try our template [link to OKR template here].
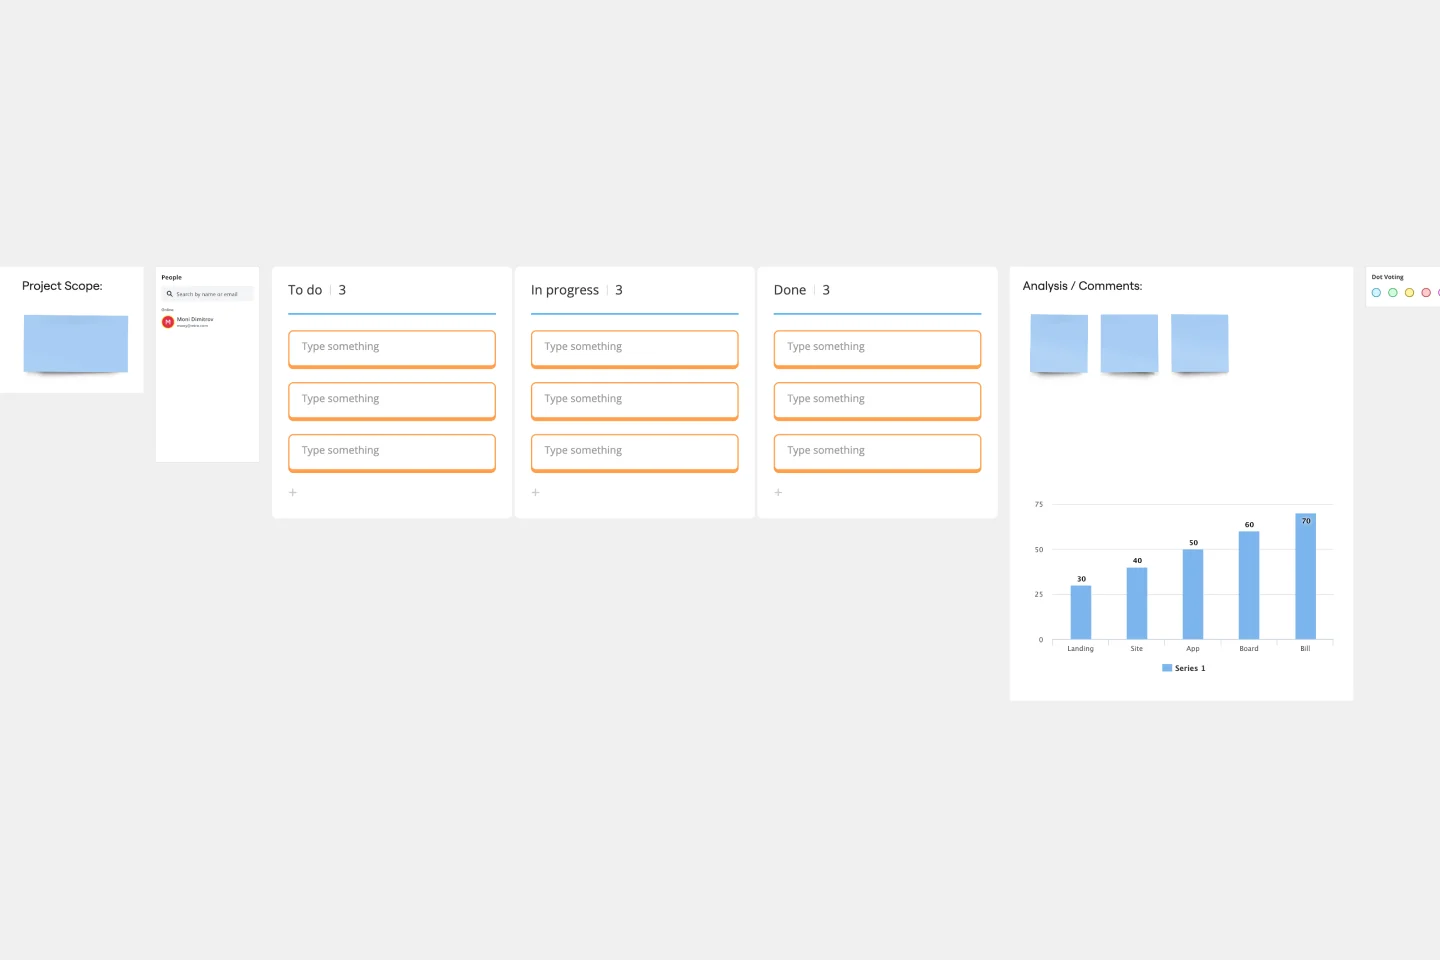
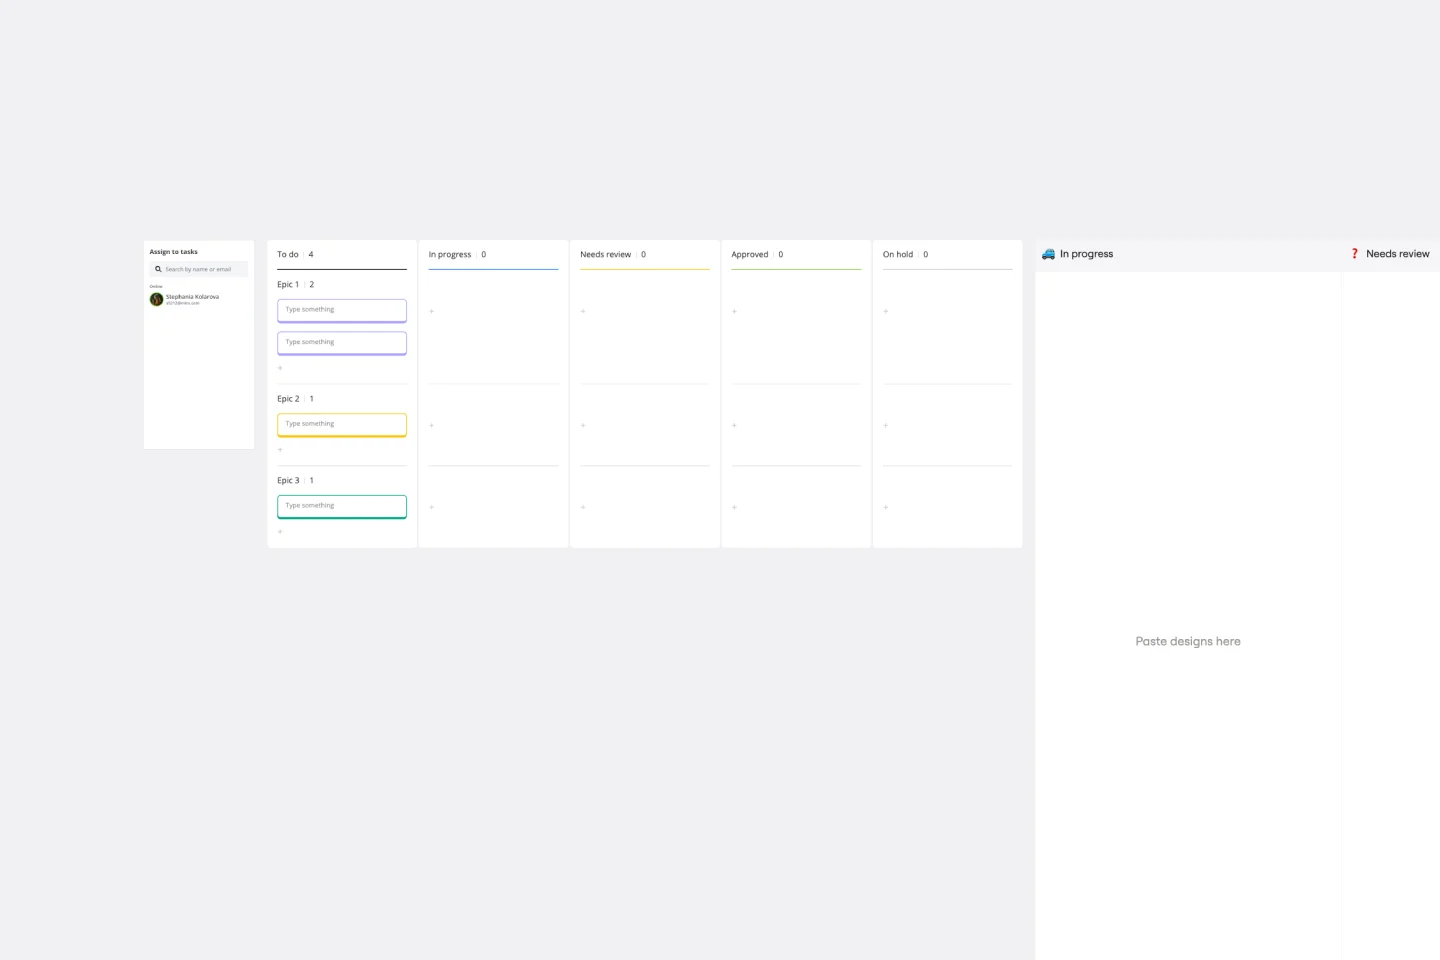
3. Get your team involved
Invite your team to collaborate on the template with status and updates, depending on what they have ownership of. What's on track? What’s at risk? What tasks are complete? What’s coming up?
4. Make changes as needed together with your team
Encourage team members to share the status report with everyone. You can link out to other documents or resources for inspiration or highlight someone’s contribution with a sticky note. Once you finish the project, send a final summary report to your team.
Get started with this template right now.
Executive Summary Template
Works best for:
Leadership, Project Management, Documentation
Pique their curiosity. Get them excited. Inspire them to keep reading, diving further into your proposal details. That’s what a good executive summary has the power to do—and why it’s a crucial opening statement for business plans, project plans, investment proposals, and more. Use this template to create an executive summary that starts building belief, by answering high-level questions that include: What is your project? What are the goals? How will you bring your skills and resources to the project? And who can expect to benefit?
SOAR Analysis Template
Works best for:
Leadership, Decision Making, Strategic Planning
The SOAR Analysis template prompts you to consider your organization’s strengths and potential to create a shared vision of the future. The SOAR Analysis is unique in that it encourages you to focus on the positive rather than solely identifying areas for growth. SOAR stands for Strengths, Opportunities, Aspirations, and Results. To use the template, examine each category through a positive lens. Perform a SOAR Analysis whenever you want to bring people together and encourage action.
Entity Relationship Diagram Template
Works best for:
Flowcharts, Strategic Planning, Diagrams
Sometimes the most important relationships in business are the internal ones—between the teams, entities, and actors within a system. An entity relationship diagram (ERD) is a structural diagram that will help you visualize and understand the many complex connections between different roles. When will an ERD come in handy? It’s a great tool to have for educating and onboarding new employees or members of a team, and our template makes it so easy to customize according to your unique needs.
Stakeholder Mapping Template
Works best for:
Business Management, Mapping, Workflows
A stakeholder map is a type of analysis that allows you to group people by their power and interest. Use this template to organize all of the people who have an interest in your product, project, or idea in a single visual space. This allows you to easily see who can influence your project, and how each person is related to the other. Widely used in project management, stakeholder mapping is typically performed at the beginning of a project. Doing stakeholder mapping early on will help prevent miscommunication, ensure all groups are aligned on the objectives and set expectations about outcomes and results.
PERT Chart Template
Works best for:
Mapping, Project Planning
A Program Evaluation and Review Technique (PERT) diagram is used to plan projects efficiently. They help you set a clear timeline, plan out tasks and dependencies, and determine a critical path.
Infographic Template
Works best for:
Marketing, Desk Research, Documentation
As we bet you’ve experienced, data can get pretty dense and dry. But you need it to be compelling, memorable, and understandable. The solution? Infographics. These are tools that let you present information in a visually striking way and turn quantitative or qualitative data into stories that engage and resonate. Whoever you’ll be presenting to — customers, donors, or your own internal teams — our template will let you design an infographic that combines text and visuals to break down even the most complicated data.