1.6K likes
8K uses
The SIPOC model brings transparency and alignment to a process. This template offers a quick, convenient way to create a SIPOC diagram with minimal fuss. Use this visual tool to document the inputs and outputs of a process and share the final product with the rest of your team.
A SIPOC diagram enables you to summarize the inputs and outputs of a process in the form of a customized table. This allows teams to identify relevant aspects of a process improvement project before starting work. SIPOC is useful when defining a complicated project that isn't necessarily well-scoped.
SIPOC is an acronym for Suppliers, Inputs, Process, Outputs, and Customers. The name invites the team to think about the suppliers of your process, the inputs to the process, the process itself, the outputs that you produce, and the customers who receive those outputs.
A SIPOC diagram can help you answer questions like:
Who supplies inputs to this process?
Who are the customers?
What are their needs?
What specifications are placed on inputs?
Here’s a step-by-step walkthrough of how to use the SIPOC diagram template to create your own diagram:
The SIPOC diagram template has the following sections under each letter:
S for suppliers
I for inputs
P for process
O for outputs
C for customers
Add the relevant information under each section with sticky notes, text, or any other artifact you see fit.
The Process section is organized so you can map a process chain, allowing information to be quickly and easily entered. Since the idea is to identify each step in a process from start to finish, others can add steps in an automatically growing chain.
Once the first step is identified, the blue circle can be clicked to automatically add another step in the process. This can be repeated until all steps of the process have been entered. The process will then be displayed in an easily understood visual format.
Here’s how your team can benefit from using the SIPOC template:
Visual planning: A SIPOC diagram is a great tool for bringing a process into focus before any actions are taken. It offers an excellent preproduction stage that allows issues to be ironed out in advance.
Streamline processes: A SIPOC diagram can act as an improvement tool for processes or projects that have already been completed. Even if the process or workflow was a success, the diagram still provides an easy way to find areas for improvement.
Enhanced communication: Project teams and individuals are made aware of all aspects of the project or process in an easily understood and quickly digested visual tool format. The SIPOC template provides a full perspective for your team on a single page.
Better collaboration: The tool helps your team identify all persons or organizations providing input into a process. This helps everyone understand what input they are providing and how that input relates to all other aspects of the process.
Customer-centric: Customer requirements aren't only identified, but specific expectations are also highlighted. Therefore, all parties involved can appreciate the ultimate goal of the process and aim toward it more efficiently.
The SIPOC Diagram is used to plot out the various steps of a process. It includes everyone involved in the process, as well as specific customer requirements. The diagram can serve either to effectively visualize a process before it is acted on or to improve a process that's already in effect. It isn't necessary to include detailed steps when creating a diagram but rather to identify all persons and parties involved.
Depending on what the SIPOC Diagram is used for, the steps that follow will differ. If the diagram was used to plan a process, the next step would be implementation. This would include contacting relevant parties, informing them of the strategy, and moving forward into action. It’s a good idea to provide all parties with the finished SIPOC Diagram for reference. If the SIPOC Diagram was used to improve an existing process, the next steps would be to inform all parties involved of any inefficiencies or problems uncovered and agree steps to tackle them. Again, providing the diagram would be necessary.
A SIPOC diagram is different from a process map, otherwise called a flow chart, in several ways. Essentially, a process map is a simplified version of a SIPOC diagram, identifying only the steps involved in a process. A SIPOC Diagram aims to identify the process and the parties involved in each step.
Yes, collaboration is often encouraged when creating a SIPOC diagram. Input from various team members and stakeholders can provide a more comprehensive understanding of the process.
Yes, SIPOC diagrams are versatile and can be applied across different industries, including manufacturing, services, healthcare, and more.

Miro
The AI Innovation Workspace
Miro brings teams and AI together to plan, co-create, and build the next big thing, faster. Miro empowers 100M+ product managers, designers, engineers, and more, to flow from early discovery through final delivery on a shared, AI-first canvas. By embedding AI where teamwork happens, Miro breaks down silos, improves alignment, and accelerates innovation. With the canvas as the prompt, Miro's collaborative AI workflows keep teams in the flow of work, scale shifts in ways of working, and drive organization-wide transformation.
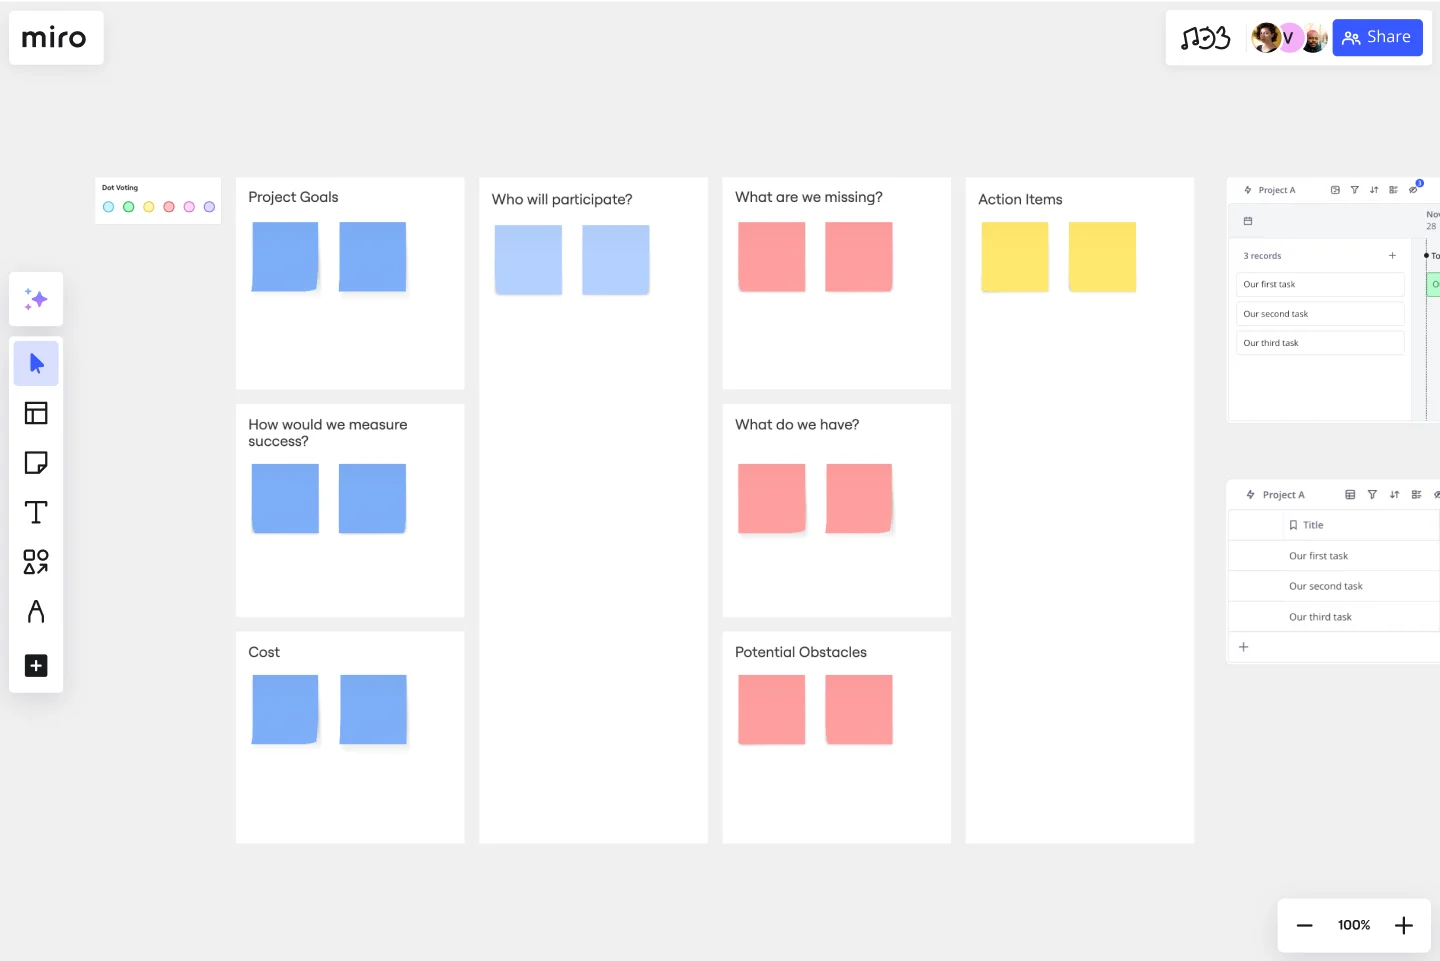
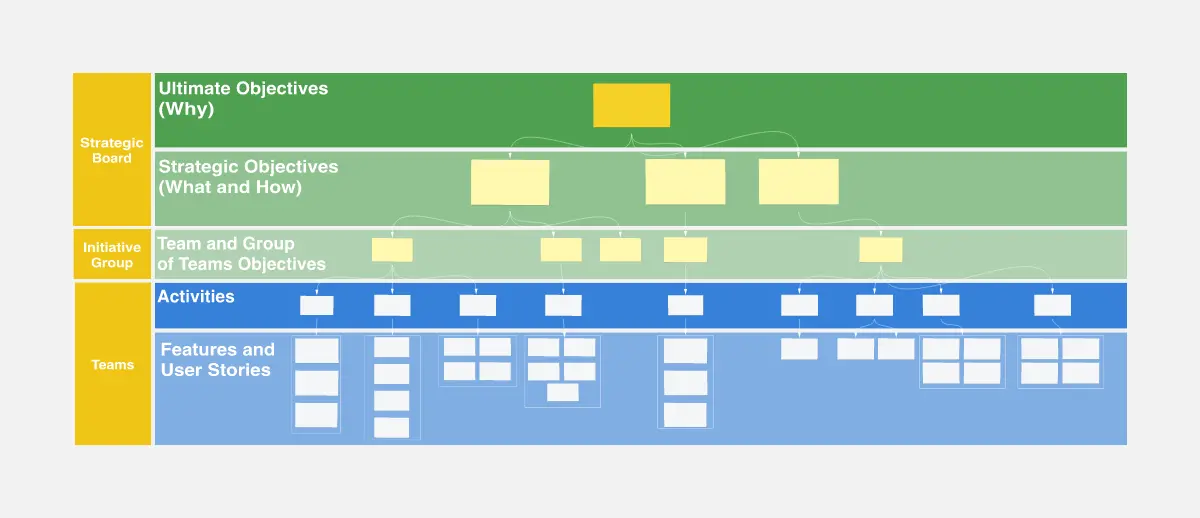
Project Planning Template
A project plan is a single source of truth that helps teams visualize and reach project milestones. Project plans are most useful when you outline the project’s “what” and “why” to anyone who needs to give you project buy-in. Use a project plan to proactively discuss team needs; expectations; and baselines for timeline, budget, and scope. The plan will also help you clarify available resources before you kick off a project, as well as expected deliverables at the end of the project.
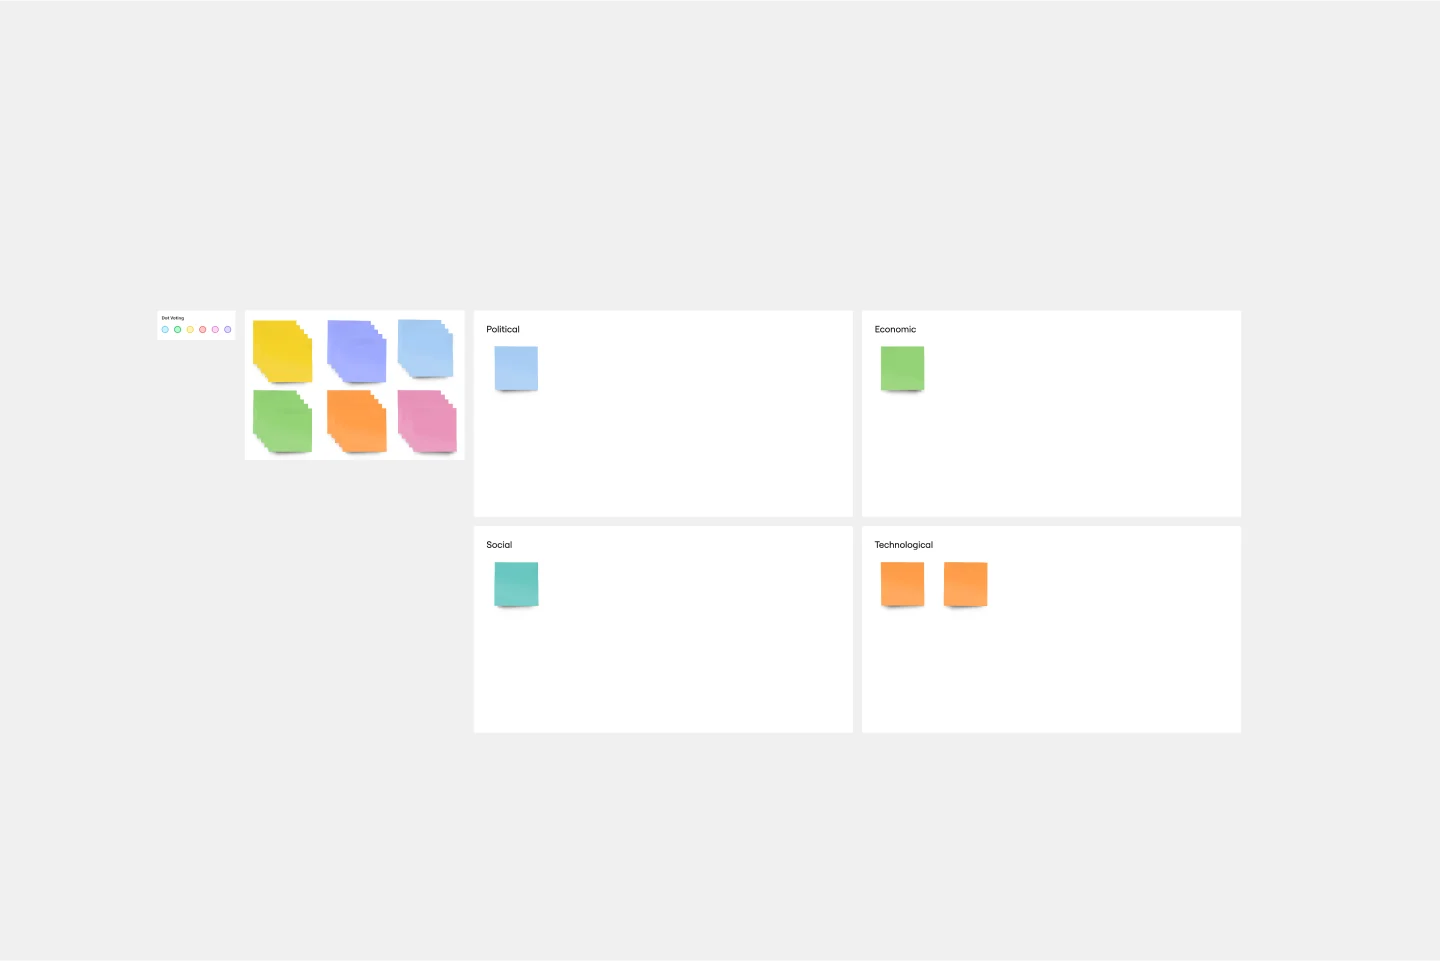
PEST Analysis Template
No business operates inside a vacuum, so if you want to succeed, you have to successfully deal with local laws, government regulating bodies, the health of the local economy, social factors like the unemployment rate, average household income, and more. Use the PEST Analysis Template to help you explore how the world impacts your business and how you can work around it.
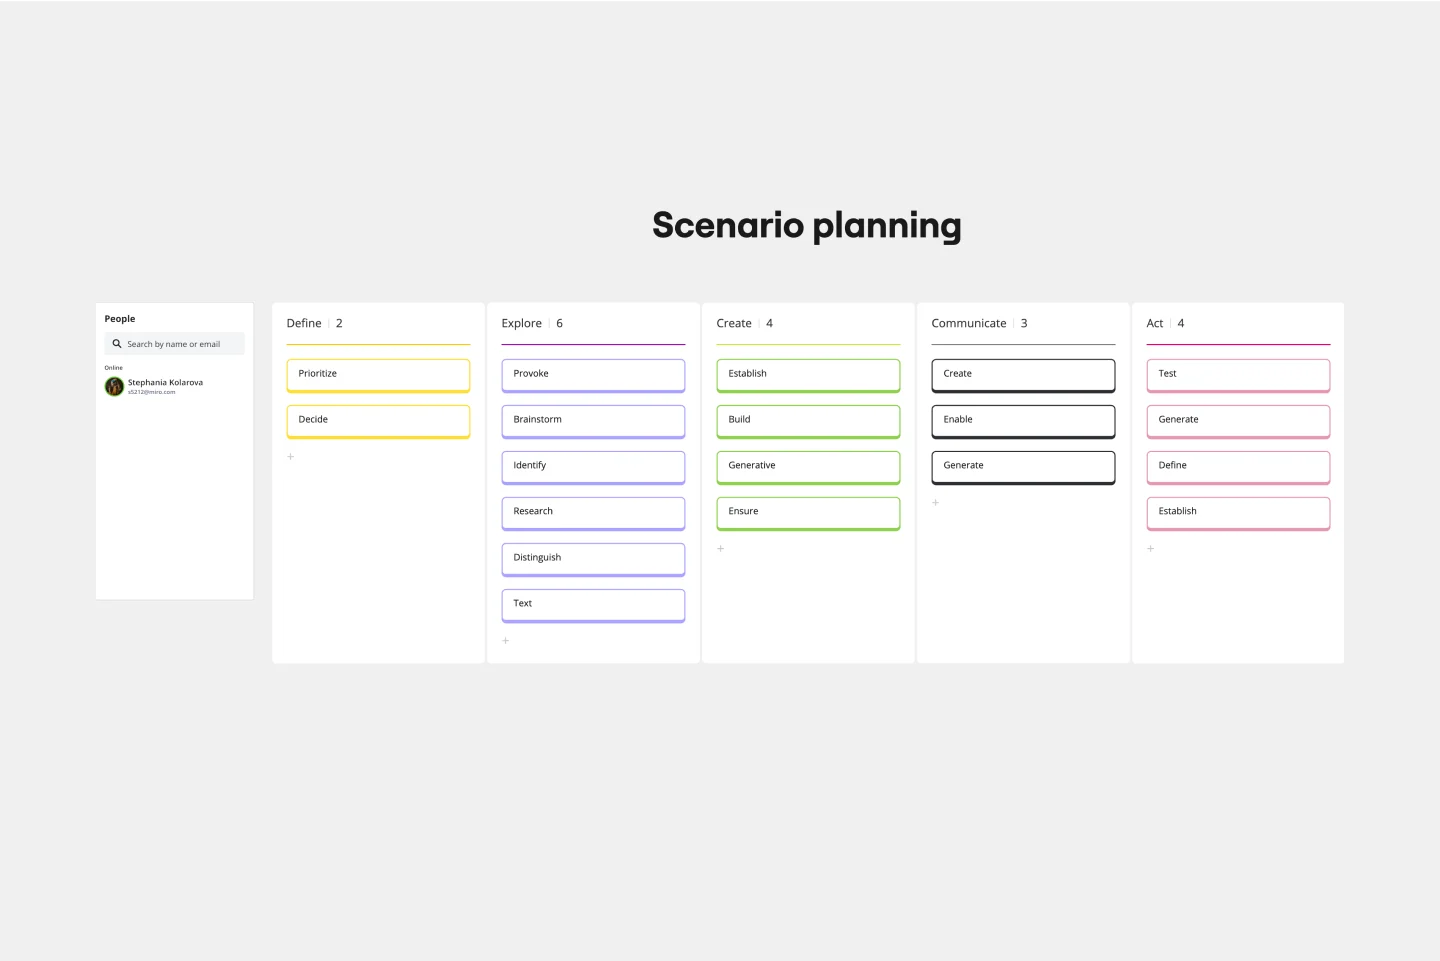
Scenario Planning Template
The Scenario Planning Template simplifies the complex process of strategizing and envisioning various future scenarios. The template’s clear structure helps teams and individuals effectively navigate the multifaceted steps of project planning and execution. A standout benefit of this template is its capability to foster structured thinking. With its distinct sections ranging from definition to action, it ensures that ideas are organized coherently, promoting logical progression and reducing the chances of oversight, making the planning process both efficient and comprehensive.
Project Planning Template
A project plan is a single source of truth that helps teams visualize and reach project milestones. Project plans are most useful when you outline the project’s “what” and “why” to anyone who needs to give you project buy-in. Use a project plan to proactively discuss team needs; expectations; and baselines for timeline, budget, and scope. The plan will also help you clarify available resources before you kick off a project, as well as expected deliverables at the end of the project.
PEST Analysis Template
No business operates inside a vacuum, so if you want to succeed, you have to successfully deal with local laws, government regulating bodies, the health of the local economy, social factors like the unemployment rate, average household income, and more. Use the PEST Analysis Template to help you explore how the world impacts your business and how you can work around it.
Scenario Planning Template
The Scenario Planning Template simplifies the complex process of strategizing and envisioning various future scenarios. The template’s clear structure helps teams and individuals effectively navigate the multifaceted steps of project planning and execution. A standout benefit of this template is its capability to foster structured thinking. With its distinct sections ranging from definition to action, it ensures that ideas are organized coherently, promoting logical progression and reducing the chances of oversight, making the planning process both efficient and comprehensive.