
Service Blueprint
Document your process and plan ahead!
What the template is about
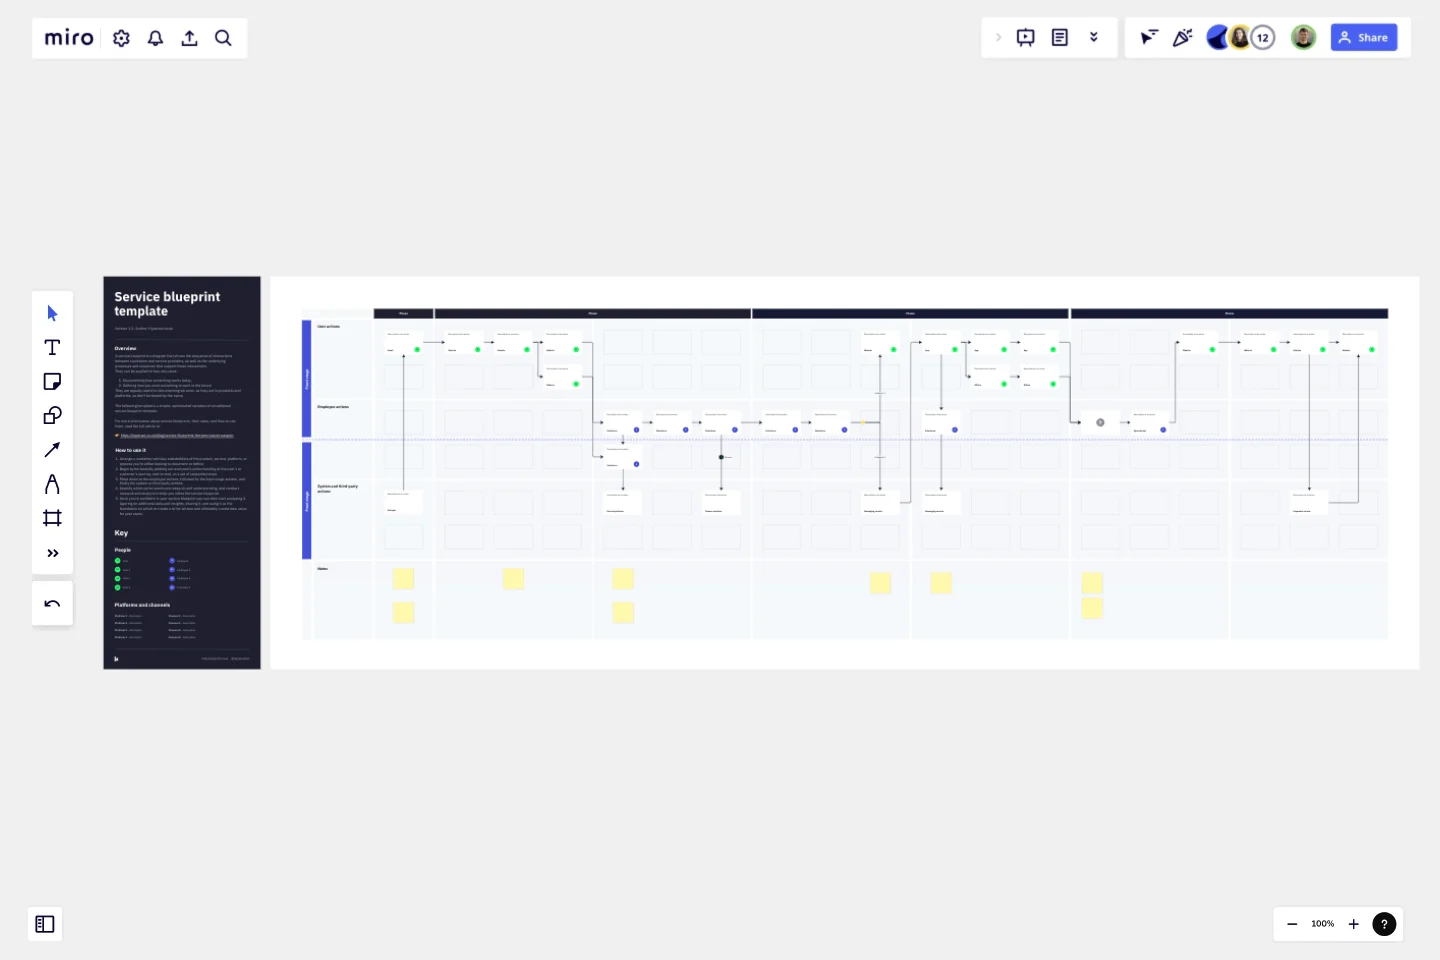
A service blueprint is a diagram that shows the sequence of interactions between customers and service providers, as well as the underlying processes and resources that support those interactions.
They can be applied to two use cases:
Documenting how something works today,
Defining how you want something to work in the future
They are equally useful to documenting services as they are to products and platforms, so don’t be fooled by the name.
The following template is a simple, opinionated variation of a traditional service blueprint template.
For more information about service blueprints, their value, and how to use them, read the full article at: https://hyperact.co.uk/blog/service-blueprints-the-pms-secret-weapon
What it helps you achieve
Service blueprints, and the process of creating them, are great for:
👀 Visualising how existing products, services, platforms, and process work
🤝 Strengthening relationships and creating a shared understanding between stakeholders
💊 Identifying improvements
🌄 Describing a vision for a future version of a product or service
🧀 Identifying steps that will move you towards your vision
👍 Getting stakeholder buy-in
Who would benefit from it most
Service blueprints are most useful to UX/UI designers, service designers, and product managers. But really, it’s a simple enough technique, and anyone who wants to drive improvements to their services, products, and platforms can use it.
How to use it
Arrange a workshop with key stakeholders of the product, service, platform, or process you’re either looking to document or define.
Begin by horizontally plotting out everyone’s understanding of the user’s or customer’s journey, end-to-end, as a set of sequential steps.
Move down to the employee actions, followed by the back-stage actions, and finally, the system or third-party actions.
Identify which parts need more research and understanding, and conduct research and analysis to help you refine the service blueprint.
Once you’re confident in your service blueprint, you can then start analyzing it, layering on additional data and insights, sharing it, and using it as the foundation on which to create a to-be version and, ultimately, create new value for your users.
Get started with this template right now.

Hiring Process Timeline
Works best for:
Timeline, Planning
Streamline your recruitment process with the Hiring Process Timeline by Rizwan Khawaja. This template helps you organize every step of hiring, from job advertisement to final onboarding. Visualize timelines, track candidates, and ensure an efficient hiring workflow. Perfect for HR professionals aiming to improve their recruitment strategy and reduce time-to-hire.

Journey Map To Plot the Customer Experience
Works best for:
Customer Journey Map
A journey is a tool to map out the customer experience of (a part of) your product/service in a visual way.

Cross-Account EC2 Status Monitoring for HPC Clusters Template
Works best for:
AWS
The Cross-Account EC2 Status Monitoring for HPC Clusters Template provides a centralized view of the health and performance of EC2 instances across multiple AWS accounts. It helps in early issue detection, reducing downtime and ensuring optimal efficiency of HPC clusters. The template offers customization options to meet specific HPC cluster configurations, simplifying monitoring and improving operational efficiency for administrators.
Basic Venn Diagram
Works best for:
Venn Diagram
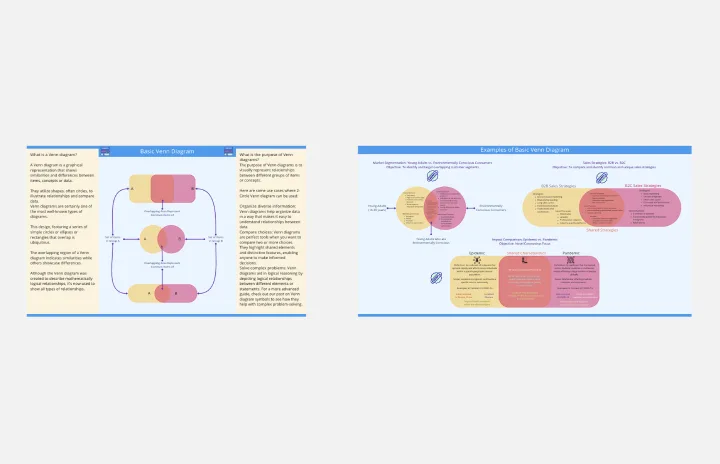
The Basic Venn Diagram template is a simple yet powerful tool for visualizing relationships between different sets. Use it to compare and contrast concepts, identify commonalities and differences, and organize information logically. This template is perfect for brainstorming, teaching, and presentations, making complex information more accessible and understandable. Ideal for educators, students, and professionals in various fields.
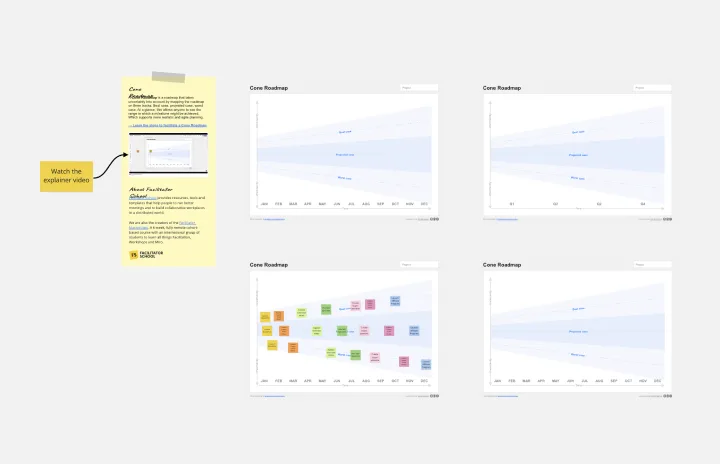
Cone Roadmap
Works best for:
Roadmap, Planning, Mapping
The Cone Roadmap template offers a visual representation of project timelines and dependencies, with a focus on narrowing scope over time. By starting with broad initiatives and gradually refining them into actionable tasks, teams can manage complexity and ensure alignment with strategic goals. This template promotes transparency and adaptability, empowering teams to respond effectively to changing priorities and market dynamics.

Four-Circle Venn Diagram
Works best for:
Venn Diagrams
The Four Circle Venn Diagram template offers a robust tool for detailed data comparison involving four sets. Use it to identify common and unique attributes across multiple categories. This template is perfect for complex analysis in research, strategic planning, and education. It helps visualize relationships clearly, making it easier to draw insights and communicate findings. Ideal for professionals and educators needing advanced comparative tools.