About the PDCA Template
The PDCA template helps you streamline continuous improvement and problem-solving processes. This dynamic template offers an organized visual representation of the Plan, Do, Check, Act cycle, allowing teams to approach challenges with clarity and purpose.
How to use the PDCA template
The PDCA template shows the Plan, Do, Check, Act cycle. This four-step management methodology is predominantly used in quality control and project management. See what each segment of the template means:
Plan
This is the initial phase where the problem is identified, and a plan for solving it is developed.
The section labeled "Plan" prompts teams to brainstorm and think about the "How, Who, What, When, Where, and Why" of the problem at hand. This ensures all aspects of the problem and potential solutions are considered.
Do
Once a plan is in place, this step involves executing that plan. It's where strategies are implemented, and ideas are tested in a controlled environment.
The "Do" section prompts teams to take action based on their plan. The phrase "Do it! Write it down." encourages documentation of actions and results, fostering transparency and accountability.
Check
This is the evaluation phase. Here, the "Do" phase results are assessed to determine if the plan's objectives were achieved. It provides insights into what worked and what did not.
In the template, the "Check" circle is centralized, emphasizing its importance in the cycle. The surrounding text prompts users to evaluate their results critically, asking questions like "Changes to be done? Can you improve? If so, 'How, Who, What, When, Where, Why?'"
Act
Based on findings from the "Check" phase, necessary adjustments are made in this stage. If the solution was effective, it could be implemented on a larger scale. If not, necessary refinements are made.
The "Act" section revolves around implementation. The directive "Implement the results into the new workflow" followed by guiding questions ensures that any improvements are properly integrated and adjusted as needed.
In essence, the PDCA template offers a structured framework that helps teams identify potential solutions, test these solutions, measure their outcomes, and ultimately, implement sustainable improvements. The visual layout ensures that each phase is clearly defined, making the process understandable and actionable.
Why should you use a PDCA template?
Structured approach: It provides a systematic problem-solving and continuous improvement method.
Visualization: By mapping out each step, teams can visually track progress and pinpoint areas that need attention.
Collaboration: Multiple stakeholders can collaborate in real time, adding notes, feedback, and insights directly to the template.
Flexibility: The template is adaptable to various projects or processes, regardless of the industry or scale.
Continuous improvement: Using the template to follow the PDCA cycle reinforces an iterative approach, prompting teams to revisit and refine their strategies regularly.
PDCA template FAQs
Is the PDCA cycle exclusive to any specific industry?
No, the PDCA cycle is a universal methodology applicable across various industries for continuous improvement.
How often should teams revisit the PDCA template?
It's an ongoing process. Teams should revisit the template at the end of each cycle or project phase to ensure improvements are implemented and refined.
Can the template be integrated with other tools?
Yes, typically, templates can be integrated with a range of tools and platforms to enhance functionality and ease of use.
Is the template suitable for remote teams?
The template is designed to support collaboration, making it ideal for both in-house and remote teams.

Miro
The AI Innovation Workspace
Miro brings teams and AI together to plan, co-create, and build the next big thing, faster. Miro empowers 100M+ product managers, designers, engineers, and more, to flow from early discovery through final delivery on a shared, AI-first canvas. By embedding AI where teamwork happens, Miro breaks down silos, improves alignment, and accelerates innovation. With the canvas as the prompt, Miro's collaborative AI workflows keep teams in the flow of work, scale shifts in ways of working, and drive organization-wide transformation.
Categories
Similar templates

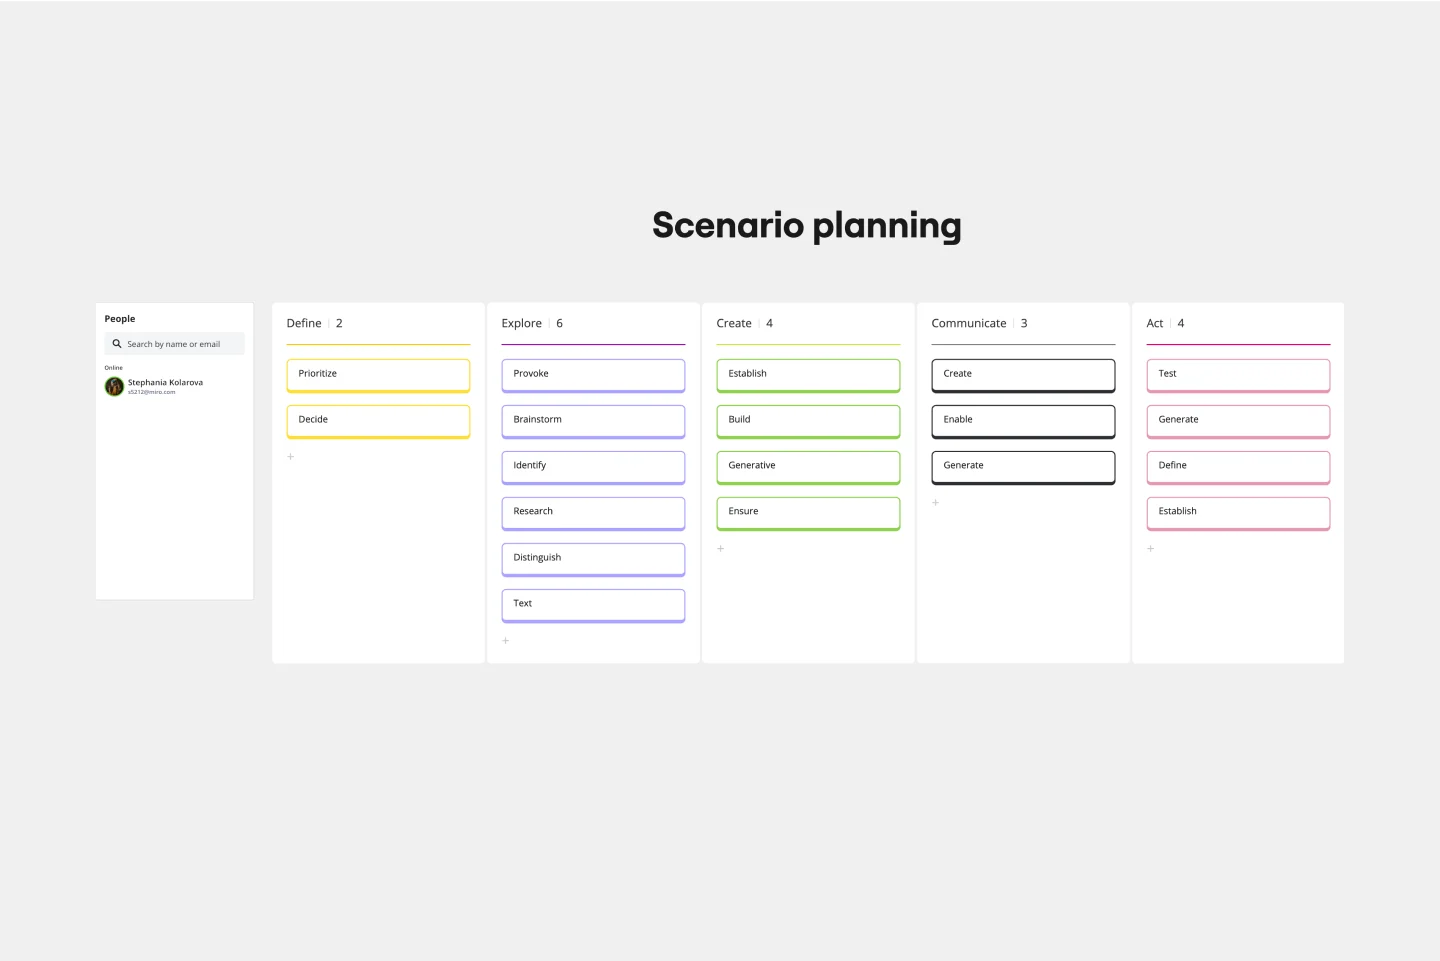
Scenario Planning Template
The Scenario Planning Template simplifies the complex process of strategizing and envisioning various future scenarios. The template’s clear structure helps teams and individuals effectively navigate the multifaceted steps of project planning and execution. A standout benefit of this template is its capability to foster structured thinking. With its distinct sections ranging from definition to action, it ensures that ideas are organized coherently, promoting logical progression and reducing the chances of oversight, making the planning process both efficient and comprehensive.

Strategic Planning Template
Whenever you need to define your goals and figure out the steps you’ll need to take to accomplish them, you’ll benefit from a Strategic Planning template. The Strategic Planning template guides you and your team through exercises to help you assess your current situation, determine their goals for the future, and develop a plan to help them get there. Generally, strategy considers the goals or reasons for doing something while planning refers to the specific actions you’ll take in order to achieve a specific goal. But with strategic planning, you’re considering both at the same time.

Scope of Work Template
The Scope of Work Template from Miro brings structure, clarity, and efficiency to project planning. It's more than just a template—it's an adaptable and dynamic platform that adapts to your unique project needs. Join thousands of satisfied users and make the Scope of Work Template a part of your project management toolkit.

Mandala Chart Template
The Mandala Chart Template helps you visualize the relationships between a central theme and its sub-themes. One of the key benefits is how it fosters a holistic understanding of any topic. This perspective ensures every detail is noticed, making it an invaluable asset for those aiming for comprehensive insight and thorough planning or a better understanding of their goals.

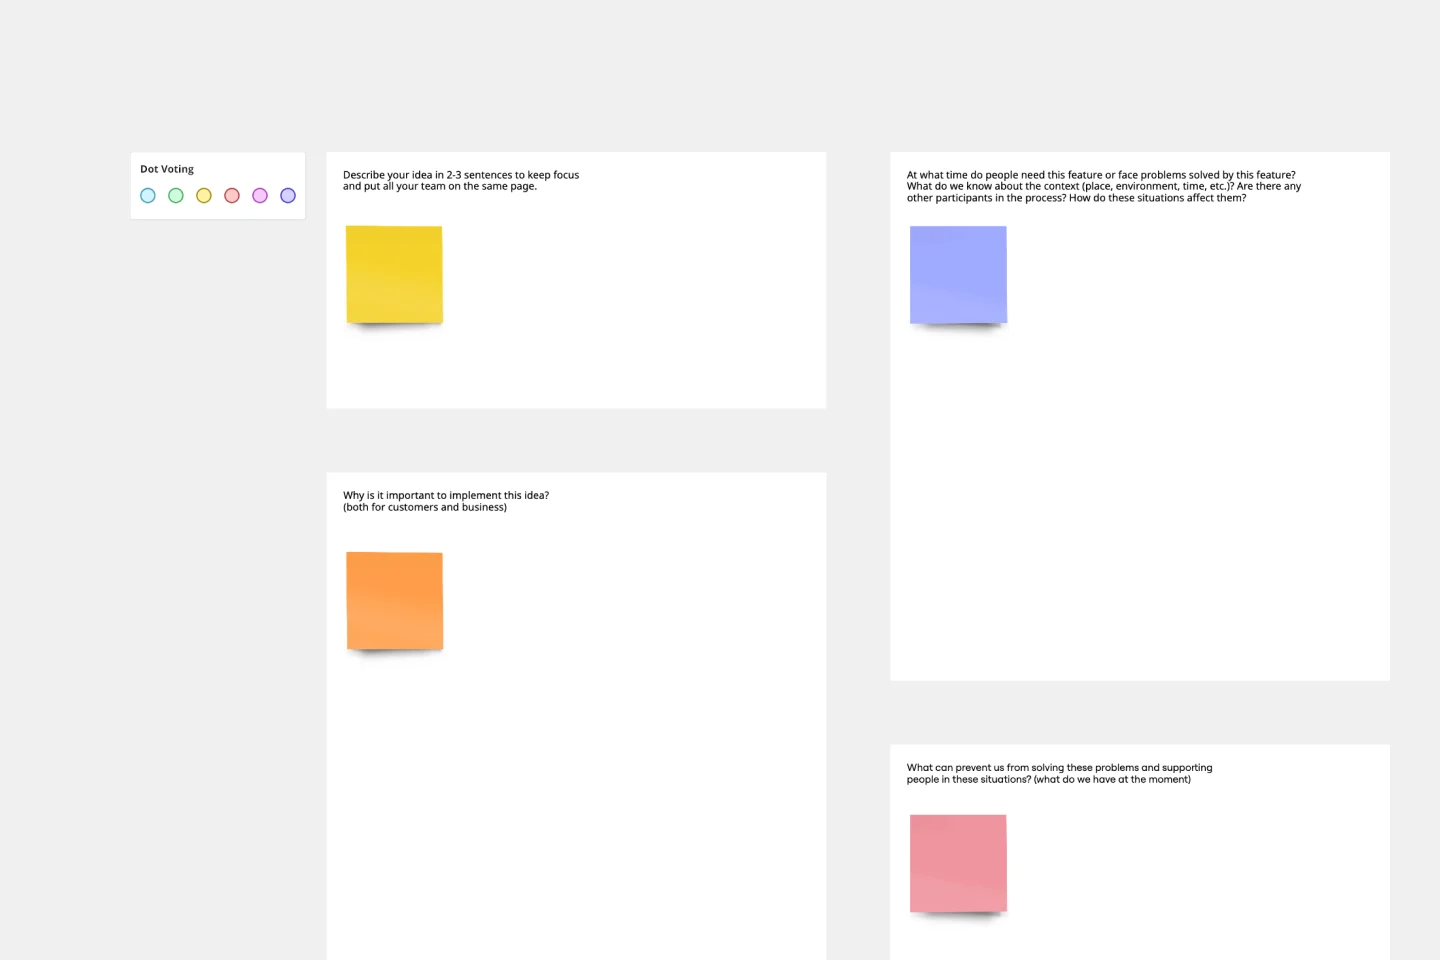
Feature Canvas Template
When you’re working on a new feature that solves a problem for your users, it’s easy to dive right in and start looking for solutions. However, it’s important to understand the initial user problem first. Use the Feature Canvas template to do a deep-dive into the user’s problems, the context in which they will use your feature, and the value proposition you will deliver to your users. The template enables you to spend more time exploring the problem to anticipate any potential blind spots before jumping into solutions mode.

Scenario Planning Template
The Scenario Planning Template simplifies the complex process of strategizing and envisioning various future scenarios. The template’s clear structure helps teams and individuals effectively navigate the multifaceted steps of project planning and execution. A standout benefit of this template is its capability to foster structured thinking. With its distinct sections ranging from definition to action, it ensures that ideas are organized coherently, promoting logical progression and reducing the chances of oversight, making the planning process both efficient and comprehensive.

Strategic Planning Template
Whenever you need to define your goals and figure out the steps you’ll need to take to accomplish them, you’ll benefit from a Strategic Planning template. The Strategic Planning template guides you and your team through exercises to help you assess your current situation, determine their goals for the future, and develop a plan to help them get there. Generally, strategy considers the goals or reasons for doing something while planning refers to the specific actions you’ll take in order to achieve a specific goal. But with strategic planning, you’re considering both at the same time.

Scope of Work Template
The Scope of Work Template from Miro brings structure, clarity, and efficiency to project planning. It's more than just a template—it's an adaptable and dynamic platform that adapts to your unique project needs. Join thousands of satisfied users and make the Scope of Work Template a part of your project management toolkit.

Mandala Chart Template
The Mandala Chart Template helps you visualize the relationships between a central theme and its sub-themes. One of the key benefits is how it fosters a holistic understanding of any topic. This perspective ensures every detail is noticed, making it an invaluable asset for those aiming for comprehensive insight and thorough planning or a better understanding of their goals.

Feature Canvas Template
When you’re working on a new feature that solves a problem for your users, it’s easy to dive right in and start looking for solutions. However, it’s important to understand the initial user problem first. Use the Feature Canvas template to do a deep-dive into the user’s problems, the context in which they will use your feature, and the value proposition you will deliver to your users. The template enables you to spend more time exploring the problem to anticipate any potential blind spots before jumping into solutions mode.
