KPI Tree Template
Use the KPI Tree Diagram to provide a clear and organized overview of complex business goals and plans.
About the KPI Tree Template
As our business initiatives evolve, tracking and understanding key performance indicators (KPIs) becomes paramount. The KPI Tree Template is designed to offer a visually compelling method for aligning objectives, strategies, tactics, and KPIs. This ensures cohesion and understanding across the team, streamlining our efforts toward shared goals.
What's a KPI Tree Template?
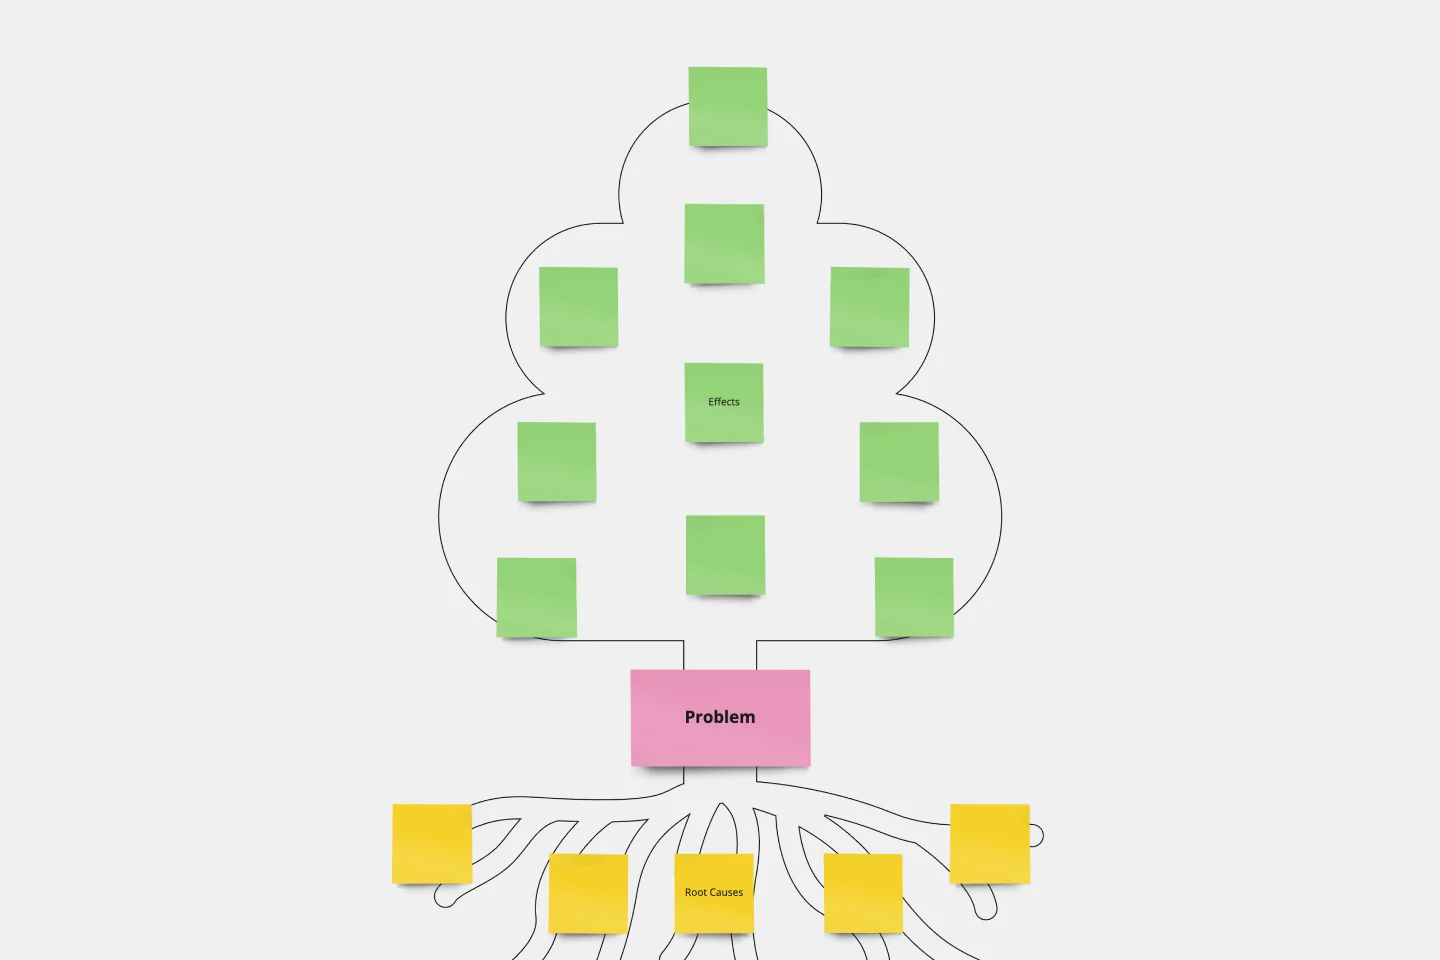
A KPI Tree Template is a structured visual tool that systematically breaks down an organization's primary objectives into detailed strategies, tactics, and measurable KPIs. By presenting these elements hierarchically, organizations can better discern the relationships between various components and how each contributes to the overarching goals.
One of the primary benefits of using this template is its ability to provide clarity. Instead of viewing goals and strategies as isolated entities, teams can witness the interplay of different elements, ensuring that all efforts are harmonized and directed toward achieving the organization's mission. Also, this visual mapping promotes enhanced communication and understanding among team members, reducing potential misalignments and fostering a unified approach to achieving business milestones.
How to use a KPI Tree Template in Miro
Miro's automated diagramming features make creating and navigating your KPI tree a breeze. Here's a step-by-step guide to using the KPI Tree Template:
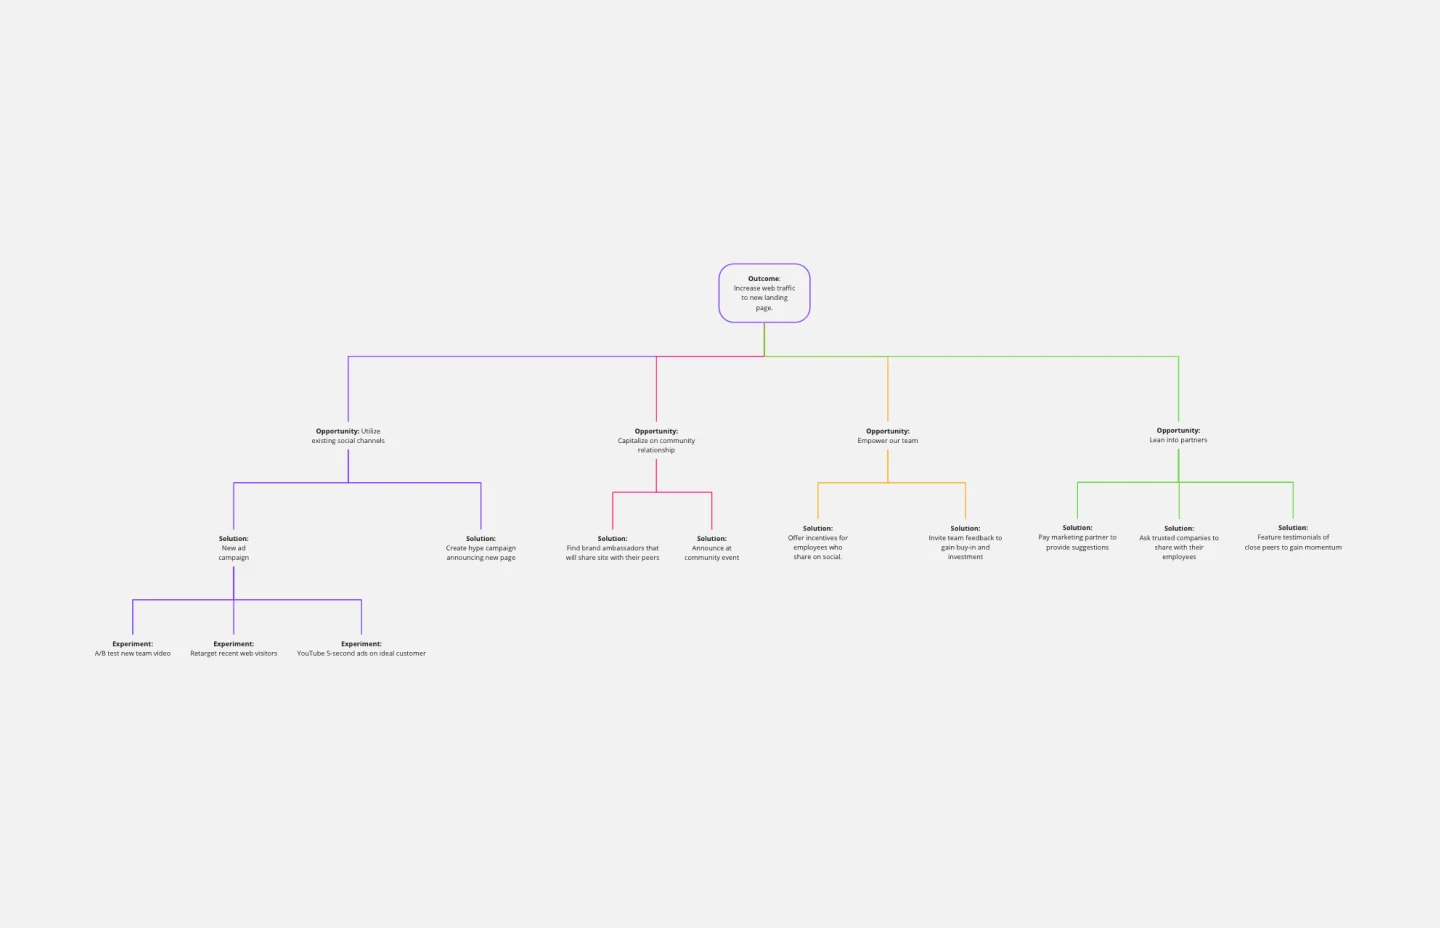
Start your tree with an objective: Define the primary objective or goal your organization wishes to achieve. This serves as the root from which all other branches will grow.
Branch out with strategies: For every objective, outline the strategies you intend to employ. These broader courses of action or approaches will help achieve the objective.
Dive deeper with tactics: Under each strategy, list out the tactics. These are specific actions or methods you will undertake to execute your strategy.
Define and attach KPIs: For every tactic, set measurable KPIs that will help you track the progress and effectiveness of that specific tactic. KPIs should be clear, quantifiable, and directly linked to the tactic it's measuring.
Throughout the process, use Miro's automated diagramming feature to quickly expand your KPI tree components by clicking on the shapes and selecting the blue dots to add more.
Can multiple people collaborate on the KPI Tree Template in real time?
Yes, Miro allows for real time collaboration, ensuring team members can work on the template simultaneously, share ideas, and make instantaneous updates.
Is the KPI Tree Template customizable?
Yes, the template is fully customizable. You can adjust colors, fonts, and even the structure to better fit your organization's branding and preferences.
Can I link external data or documents to the KPIs in the template?
Certainly! Miro supports linking to external resources, allowing you to provide more detailed insights or references directly from your KPI Tree.
What should I do if I run out of space while expanding my KPI Tree?
No worries! Miro's automated diagramming features enable you to enlarge the tree easily. If a section grows too extensive, you can effortlessly adjust and reorganize it to make room for additional information.
Get started with this template right now.
Fishbone Diagram for Healthcare
Works best for:
Fishbone Diagram
Ensuring high-quality care in healthcare settings requires a thorough understanding of root causes behind issues. The Fishbone Diagram for Healthcare template helps you analyze potential causes of problems in areas like patient care, staff performance, and administrative processes. This structured approach facilitates comprehensive analysis and collaborative problem-solving, ultimately leading to improved healthcare outcomes and patient satisfaction.
VRIO Analysis Template
Works best for:
Diagramming, Strategy
The VRIO Analysis Template is a framework that helps businesses evaluate their resources and capabilities for competitive advantage. It categorizes resources into four areas: Value, Rarity, Imitability, and Organization. This provides a comprehensive view of an organization's strengths and potential weaknesses. The template has the key benefit of offering quick visual insights. Decision-makers can immediately identify and focus on resources that are valuable, rare, hard to imitate, and well-organized. This ensures a sustainable competitive edge and saves time by avoiding lengthy textual analyses.
Venn Diagram Practical Applications
Works best for:
Venn Diagram
The Venn Diagram for Practical Applications template helps you apply Venn diagrams to real-world scenarios. Use this template to solve problems, identify relationships, and make decisions based on clear visual analysis. It's perfect for practical tasks such as project planning, resource allocation, and strategic decision-making. This tool is ideal for business professionals, educators, and anyone looking to apply theoretical concepts to practical situations.
BPM
Works best for:
Diagramming
The BPM (Business Process Management) template is a visual tool for modeling, analyzing, and optimizing business processes. It provides a structured framework for documenting process flows, identifying bottlenecks, and improving efficiency. This template enables organizations to streamline operations, enhance productivity, and drive business performance. By promoting process transparency and agility, the BPM template empowers teams to achieve operational excellence and deliver value to stakeholders.
Journey Map To Plot the Customer Experience
Works best for:
Customer Journey Map
A journey is a tool to map out the customer experience of (a part of) your product/service in a visual way.
Lean UX Canvas Template
Works best for:
Desk Research, Product Management, User Experience
What are you building, why are building it, and who are you building it for? Those are the big pictures questions that guide great companies and teams toward success — and Lean UX helps you find the answers. Especially helpful during project research, design, and planning, this tool lets you quickly make product improvements and solve business problems, leading to a more customer-centric product. This template will let you create a Lean UX canvas structured around eight key elements: Business problem, Business outcome, Users and customers, User benefits, Solution ideas, Hypothesis, Assumptions, Experimentation.