
Insightful Venn
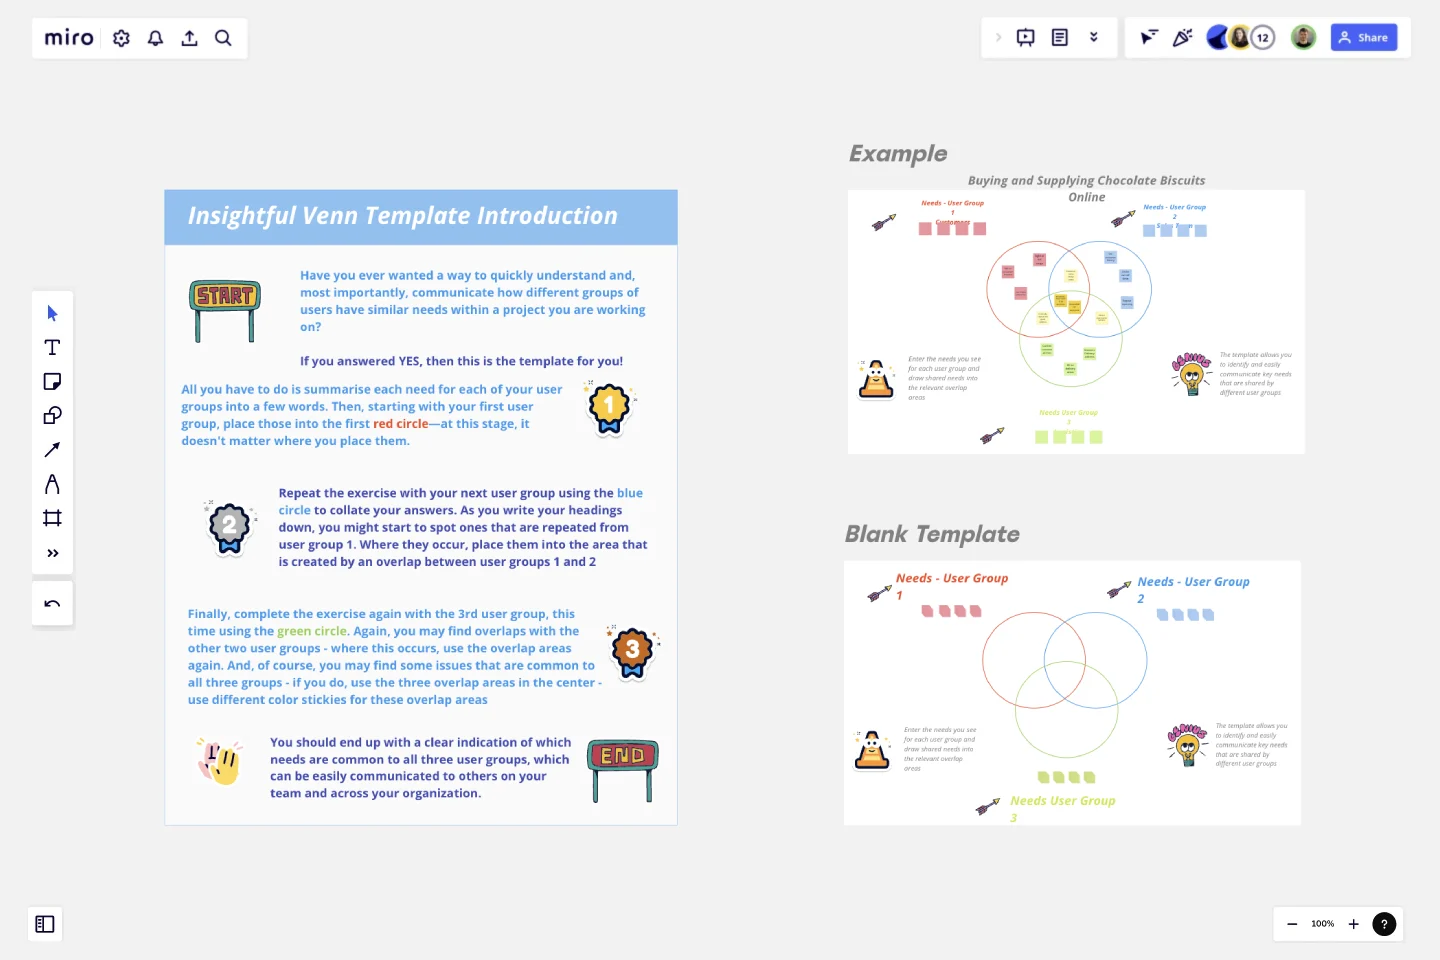
Have you ever wanted a way to quickly understand and, most importantly, communicate how different groups of users have similar needs within a project you are working on?
Have you ever wanted a way to quickly understand and, most importantly, communicate how different groups of users have similar needs within a project you are working on?
If you answered YES, then this is the template for you!
All you have to do is summarise each need for each of your user groups into a few words. Then, starting with your first user group, place those into the first red circle—at this stage, it doesn't matter where you place them.
Repeat the exercise with your next user group using the blue circle to collate your answers. As you write your headings down, you might start to spot ones that are repeated from user group 1. Where they occur, place them into the area that is created by an overlap between user groups 1 and 2
Finally, complete the exercise again with the 3rd user group, this time using the green circle. Again, you may find overlaps with the other two user groups - where this occurs, use the overlap areas again. And, of course, you may find some issues that are common to all three groups - if you do, use the three overlap areas in the center - use different color stickies for these overlap areas
You should end up with a clear indication of which needs are common to all three user groups, which can be easily communicated to others on your team and across your organization.
Get started with this template right now.
Fishbone Diagram
Works best for:
Diagramming
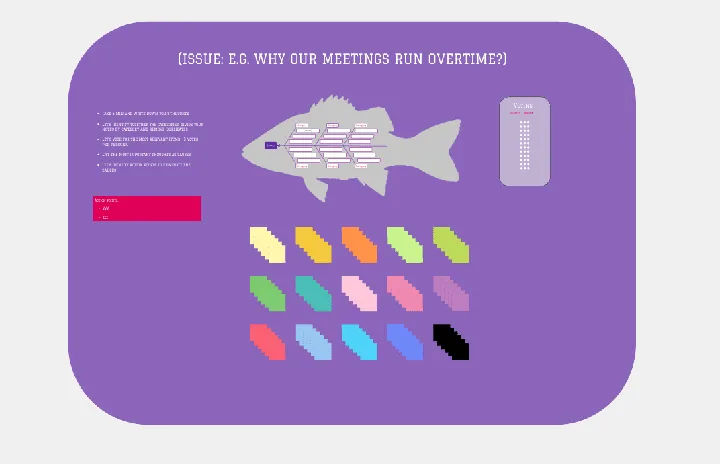
The Fishbone Diagram template, also known as the Ishikawa or Cause-and-Effect diagram, offers a visual tool for identifying and analyzing root causes of problems or issues. It provides a structured framework for categorizing potential causes into major categories such as people, process, environment, and equipment. This template enables teams to conduct root cause analysis systematically, facilitating problem-solving and decision-making. By promoting a structured approach to problem analysis, the Fishbone Diagram empowers teams to address issues effectively and implement corrective actions efficiently.
Objectives and Key Results (OKRs) Template
Works best for:
Leadership, Strategic Planning, Project Planning
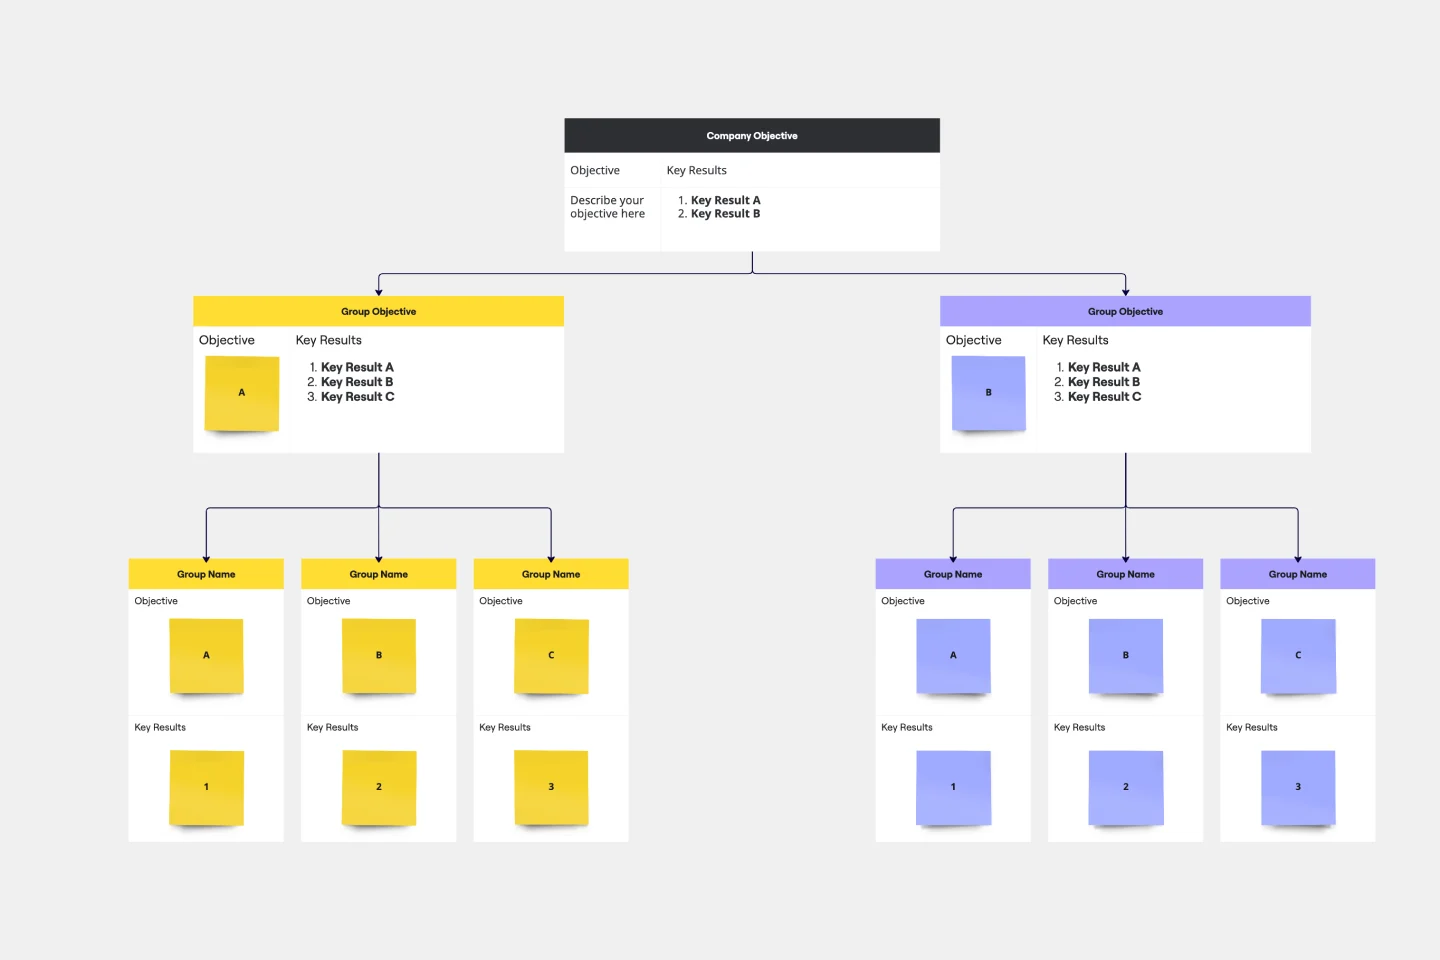
Clarity, focus, and structure — those are the key ingredients to feeling confident in your company’s directions and decisions, and an OKR framework is designed to give them to you. Working on two main levels — strategic and operational — OKRs (short for objectives and key results) help an organization’s leaders determine the strategic objectives and define quarterly key results, which are then connected to initiatives. That’s how OKRs empower teams to focus on solving the most pressing organizational problems they face.
Bubble Map Template
Works best for:
Diagramming, Mapping, Brainstorming
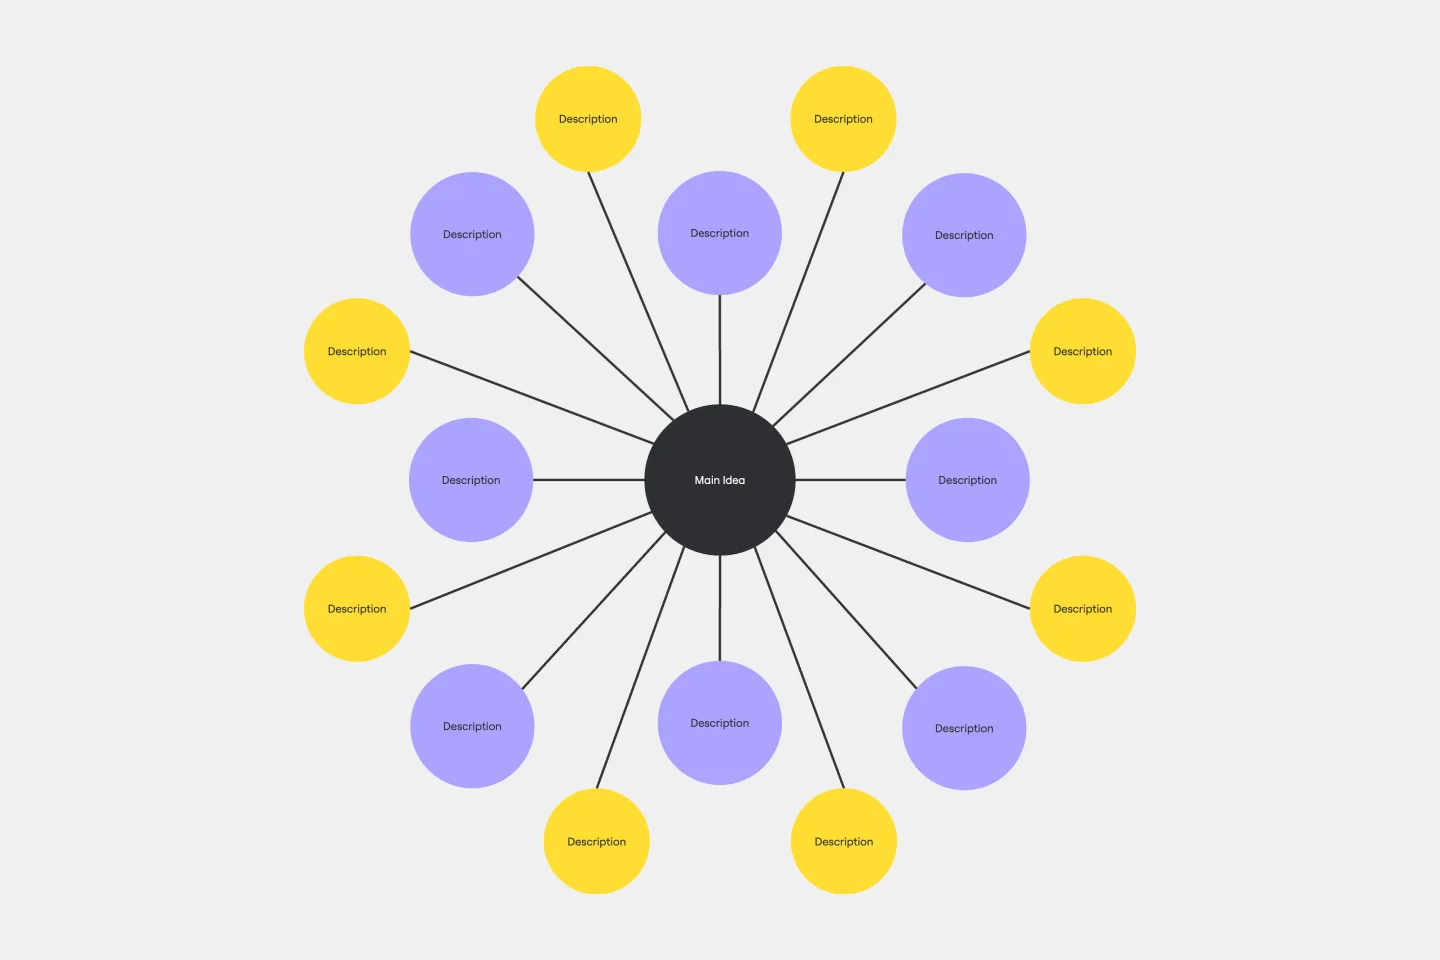
A Bubble Map Template is a visual organization tool that uses bubbles or circles to represent various ideas or data points. These bubbles are linked together, displaying their relationships and creating a network of interconnected thoughts. Use a Bubble Map Template to streamline complex information, enhancing comprehension and promoting efficient decision-making.
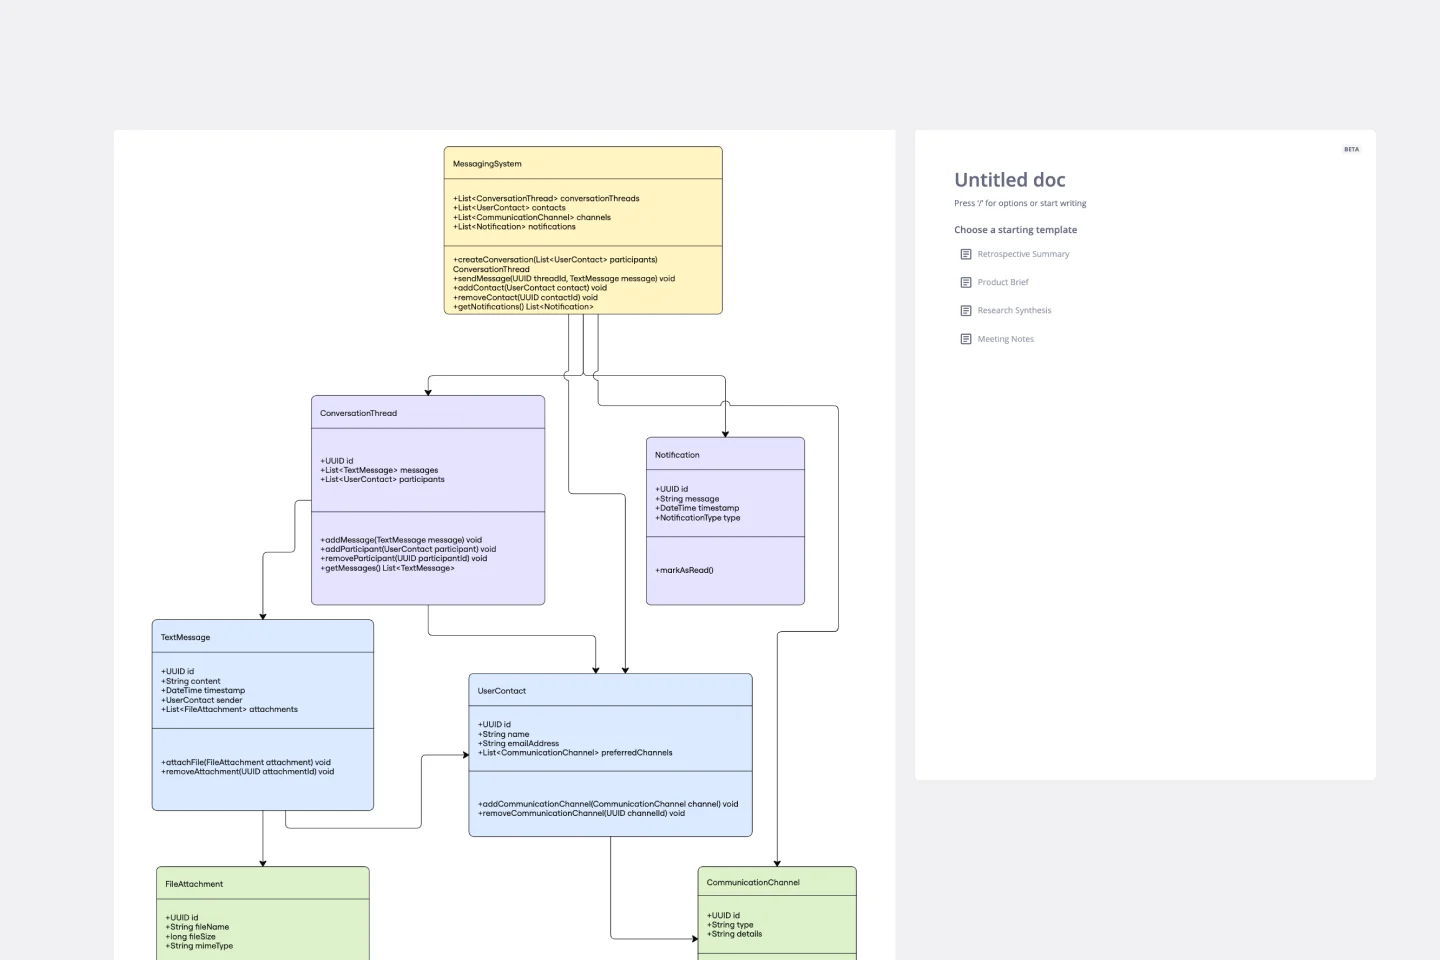
UML Class Messaging System Template
Works best for:
UML
The UML Class Messaging System Template streamlines the process of designing and analyzing messaging systems. It allows users to visually map out the structure of a system by detailing classes, their attributes, operations, and the relationships among objects. This template is particularly useful for illustrating the functionality of a messaging system, including the management of text messages, conversation threads, user contacts, notifications, and channels. It offers a clear visual representation of how all these elements interact within the system, making it an invaluable resource for developers, designers, and stakeholders aiming to enhance communication and reduce errors in the development phase.

Stage-Gate Process Flowchart Template
Works best for:
Diagramming, Project Management
The Stage-Gate Process Flowchart Template structures a project into distinct stages separated by decision-making gates, enhancing the quality of decisions and leading to more successful project outcomes.
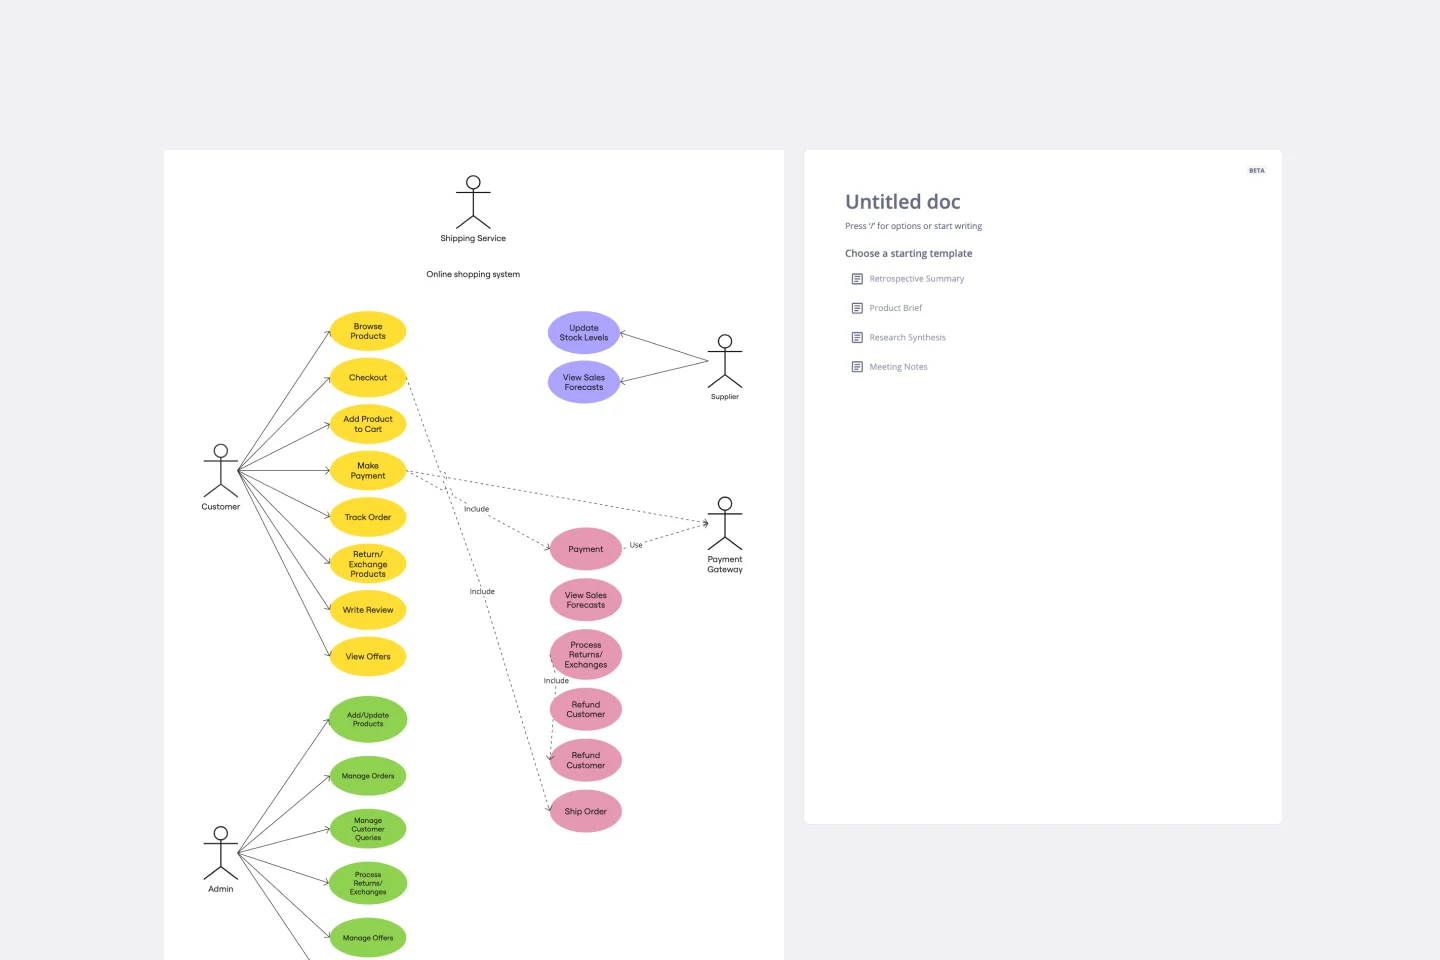
UML Use Case Online Shopping System Template
Works best for:
UML
The Online Shopping System Template simplifies the process of documenting and visualizing how users interact with an online shopping system. It provides a standard way to map out user interactions, such as product listings, inventory management, shopping carts, order processing, payments, and shipping details. By using this template, teams can collaborate effectively in real-time or at different times, adjusting the diagram to meet their project's specific needs. This not only improves clarity and efficiency but also fosters better communication among team members and stakeholders, ensuring a thorough understanding of the system's design and requirements.