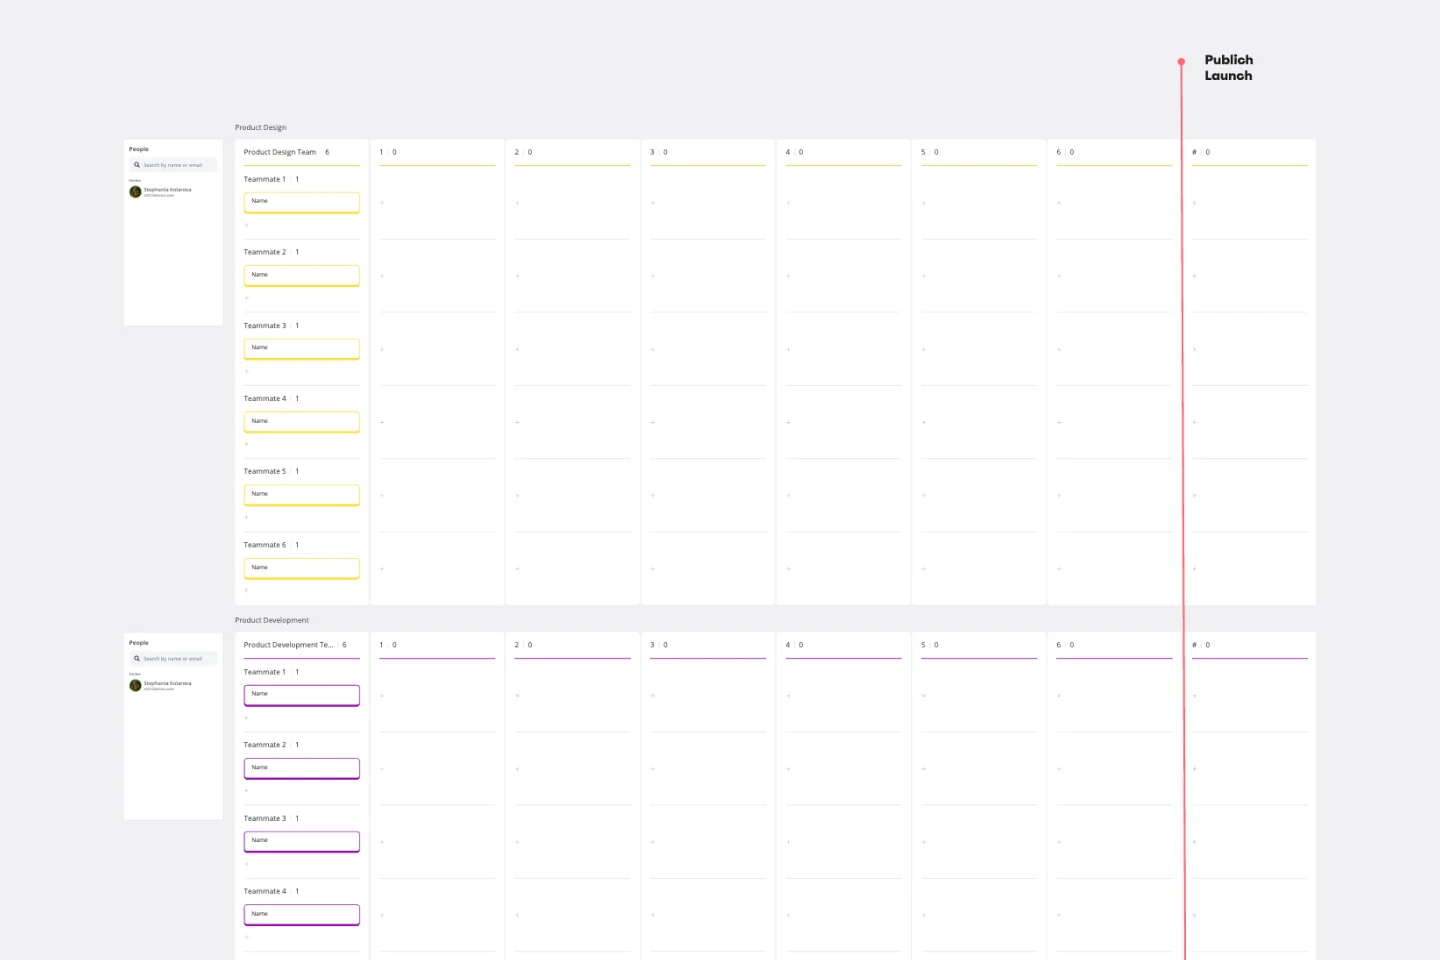
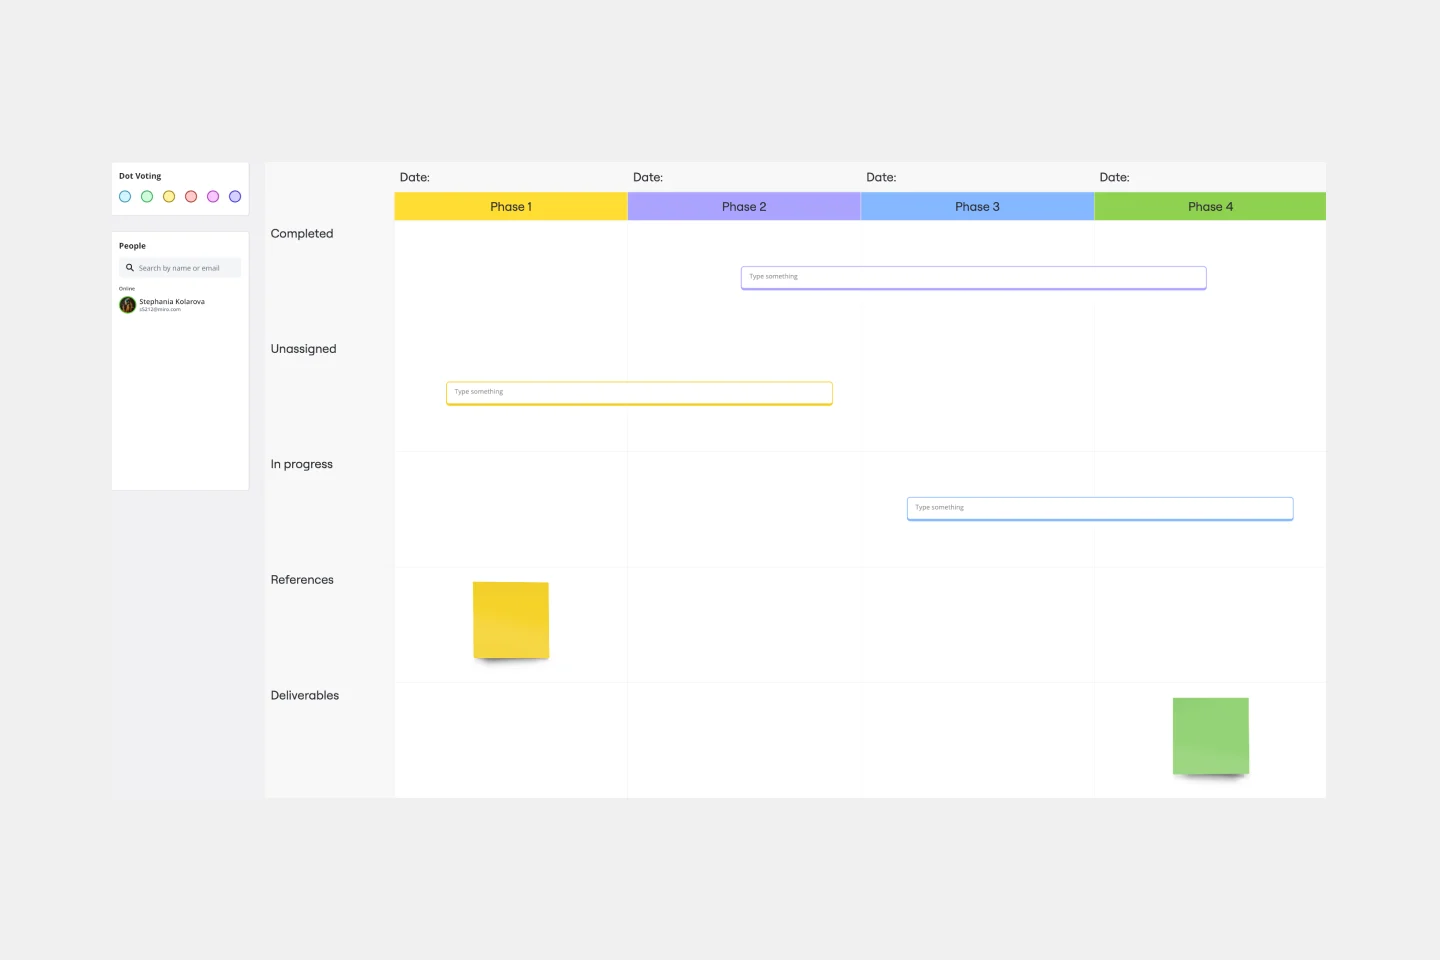
Gantt Chart Template
Keep track of all your tasks in this visual timeline and move your project forward with the Gantt Chart Template. Improve your efficiency and reach your goals.
About the Gantt Chart Template
A Gantt chart is a powerful and widely used graphical timeline representation that shows the progression of a project plan over time. Most Gantt chart templates show the status of each step in the project and the stakeholders. They break down projects by task, enabling the team to see the task status, who it’s assigned to, and how long it will take to complete.
Gantt chart templates are also an excellent way to identify a project's dependencies and bottlenecks, making them an essential tool for collaboration and efficiency. Although Gantt charts vary by organization and team, they typically include a few key components:
The task list runs vertically down the left-hand side of the chart. It describes project work and is often organized into groups and subgroups.
The timeline runs horizontally across the top of the chart and portrays the project's progression.
The horizontal bars on the right-hand side of the chart represent progress toward a given goal. Gantt charts also show milestones, dependencies, and stakeholders.
Gantt charts allow you to capture the essential details of a project in a given timeframe. At a glance, you can see what tasks need to be done, who is responsible for them, the status of tasks, as well as the planned start and end dates of the project and its subtasks.
How to use the Gantt chart template
Miro is the perfect tool to create and manage a Gantt chart with your team. Start by selecting the Gantt chart template and follow the steps below:
Step 1: Establish a timeframe
A well-constructed Gantt chart must have a well-defined beginning and end. In a way, a Gantt chart is like a combination of a timeline and a Kanban board. It is essential to establish a time frame for achieving your objectives.
Depending on how your company or business operates, a Gantt chart may correspond to a quarter. For example, let's say we want to conduct a communication strategy for the launch of a new product. We would then set this chart to start on 1 May and end on 31 July.
It may take longer or require an extension, and that's perfectly fine. However, it is important to define a project end date to work towards. Remember to factor in vacation periods to ensure you accurately allocate time.
Step 2: Add tasks to the Gantt chart
With an end goal in mind, you now need to add and complete the tasks on the Gantt chart. Work with your team to add details to the tasks, color code cards according to department, team, or division, and tag responsible team members.
You will also need to assign a start date and an end date and to stretch the task over the time period. This is incredibly important to ensure that everyone understands the timelines involved so that the overall project remains on track. You can also add all the necessary details for the task. Each task can also be divided into subtasks.
In each team, a project lead or manager should be responsible for assigning different tasks and subtasks to everyone. Each card, depending on the responsible person or team, can have a different color to facilitate the overall understanding of the project plan.
Step 3: Create dependencies between tasks
Many tasks cannot be executed if other tasks have not been carried out beforehand, so their level of dependency will be very high. Using Miro’s Gantt chart template, you can create dependency lines by linking cards together. The project manager or team leader should determine the most important dependencies to prioritize and should discuss this with the relevant people involved.
Step 4: Add milestone markers to provide visibility
Milestone markers, as the name implies, are meant to signify important events or goals in a project plan. The milestone can correspond to phases of a project. You can add these to specify these crucial points in your timeline.
Step 5: Make changes and iterate if necessary
Editing your Gantt chart is not always ideal, as a lot of time and thought goes into planning out the project. Sometimes, however, it's necessary. Fortunately, online Gantt chart tools allow you to make changes much more easily.
When you invite your team to collaborate on your Gantt Chart Template, they’ll be able to view any changes such as tasks completed or new processes added in real-time. Add any relevant files (Office, Google Docs, PDF, JPG, PNG) to keep everything in one place, and use the sticky notes and comments feature to explain and discuss tasks when team members need clarification.
Benefits of using a Gantt chart template
The Gantt chart is one of the most popular and widely used charts in project management, and for good reason. There are several advantages to using a simple Gantt Chart template:
Simplifies complex projects - Gantt charts help you and your team to visually understand a project that may seem complex with many moving parts. It is easier to then align as a team in creating a roadmap to complete tasks and meet deadlines.
Helps with time management - Good planning is key to ensuring milestones are met and that everyone is able to manage their tasks effectively. Using a project Gantt chart template helps with tracking dependencies and ensuring that everyone has a manageable workload in meeting their goals. If it seems that milestones are not realistically achievable, deadlines can be adjusted with proper foresight and planning.
Project tracking happens in one place - One of the greatest advantages of using the Gantt chart is that you can see all your tasks, important details, and milestones in one place. It avoids confusion in having to track information across different platforms or documents.
Improves transparency - There are few things more demotivating than having unrealistic deadlines and expectations. Using a Gantt chart can ensure that everyone is aware of the project’s progress and will reduce the likelihood of miscommunication due to mismatched expectations.
Motivates team members - Knowing how tasks fit into the broader project is motivating because people can better understand how they are contributing to the overall project goals. In addition, creating timelines and planning out milestones makes it easier to manage your individual schedules. Being unable to meet deadlines effectively can be incredibly frustrating and demotivating so using a Gantt chart reduces the likelihood of this happening.
Increased personalization - Using Miro’s Gantt Chart template is synonymous with personalization. You’re able to change the colors and labels, add sticky notes and images, and so much more. Everyone who is involved in the project can see everything clearly.
These are just a few of the benefits of using a Gantt chart for project management. Certainly, there are many more advantages of using Gantt charts that are part of the reason why this powerful tool has become so popular.
Can I share my Gantt chart template?
Yes, invite your team to join you on your board or download your Gantt chart as an image or PDF.
Is the Gantt chart template pre-filled?
Gantt chart templates are not pre-populated with any particular project data. Rather, they are created as frameworks or structures that visually represent a project timeline. You can customize the template by adding your own content and project information, such as tasks, durations, start dates, and dependencies, to create a personalized Gantt chart that is tailored to your specific project.
What is a Gantt chart used for?
People use the Gantt chart to display project progress and tasks, assigned stakeholders, and deadlines in a visual timeline. It helps project managers to track progress easily. Still, any individual contributor can create a Gantt Chart Template and use it to track and organize their own professional and personal projects.
Get started with this template right now.
Service Blueprint by Hyperact
Works best for:
Research & Design
The Service Blueprint template is perfect for visualizing the orchestration of service components. It maps out frontstage and backstage elements, helping you analyze and enhance customer experiences. Use this template to align teams, identify pain points, and streamline processes, ensuring a seamless service delivery. It's ideal for creating a shared understanding of service dynamics among stakeholders and collaborators.
Weekly Planner Template
Works best for:
Business Management, Project Planning
A weekly planner is a schedule that outlines your plans and activities for the week ahead. It helps you manage your time, keep track of your tasks, and organize your team on a day-to-day basis. Unlike traditional planners, which are often non-customizable, this weekly planner can be modified to suit your specific needs.
On-Premise to Cloud Migration Process Flowchart Template
Works best for:
Flowcharts
The On-Premise to Cloud Migration Process Flowchart Template is a strategic tool designed to streamline the transition from traditional on-premise systems to more flexible, scalable cloud-based solutions. This template acts as a visual roadmap, guiding teams through each phase of the migration process with clarity and precision. By breaking down the migration into manageable steps, it ensures a comprehensive approach, minimizing risks and aligning with best practices for cloud adoption.
Event Brief Template
Works best for:
Meetings, Workshops, Project Planning
For most any organization, throwing a big deal event is…a big deal. An event can bring in publicity, new clients, and revenue. And planning it can require a substantial chunk of your overall resources. That’s why you’ll want to approach it like a high-stakes project, with clearly outlined goals, stakeholders, timelines, and budget. An event brief combines all of that information in a single source of truth that guides the events team, coordinator, or agency—and ensures the event is well-planned and well-executed.
Monthly Planner Template
Works best for:
Operations, Strategic Planning, Project Planning
To knock out every task and accomplish every goal for the month, it helps to take a big picture, 10,000 foot view of things—meaning a 30-day view. That’s why a monthly calendar can come in so handy, especially on bigger projects. Use our template to create a visual representation that helps you track and space out every deadline and to-do, both for individuals and full teams. You’ll even be able to customize it your way, with images, video, and sticky notes.
Product Roadmap Canvas Template
Works best for:
Roadmap, Mapping, Planning
The IASA - Product Roadmap Canvas template offers a holistic view of product development by integrating key elements such as customer needs, business goals, and technology requirements. By utilizing this canvas, teams can align their product strategy with market demands and ensure that development efforts are focused on delivering maximum value to customers.