About the Driver Diagram Template
Add structure to projects using the driver diagram template to simplify complex objectives into understandable parts, ensuring a streamlined approach to achieving goals.
A driver diagram is a strategic visualization tool that delineates a main goal into its core contributors and actionable steps. Use this template to visualize and communicate the key drivers or factors that contribute to achieving a specific goal or outcome.
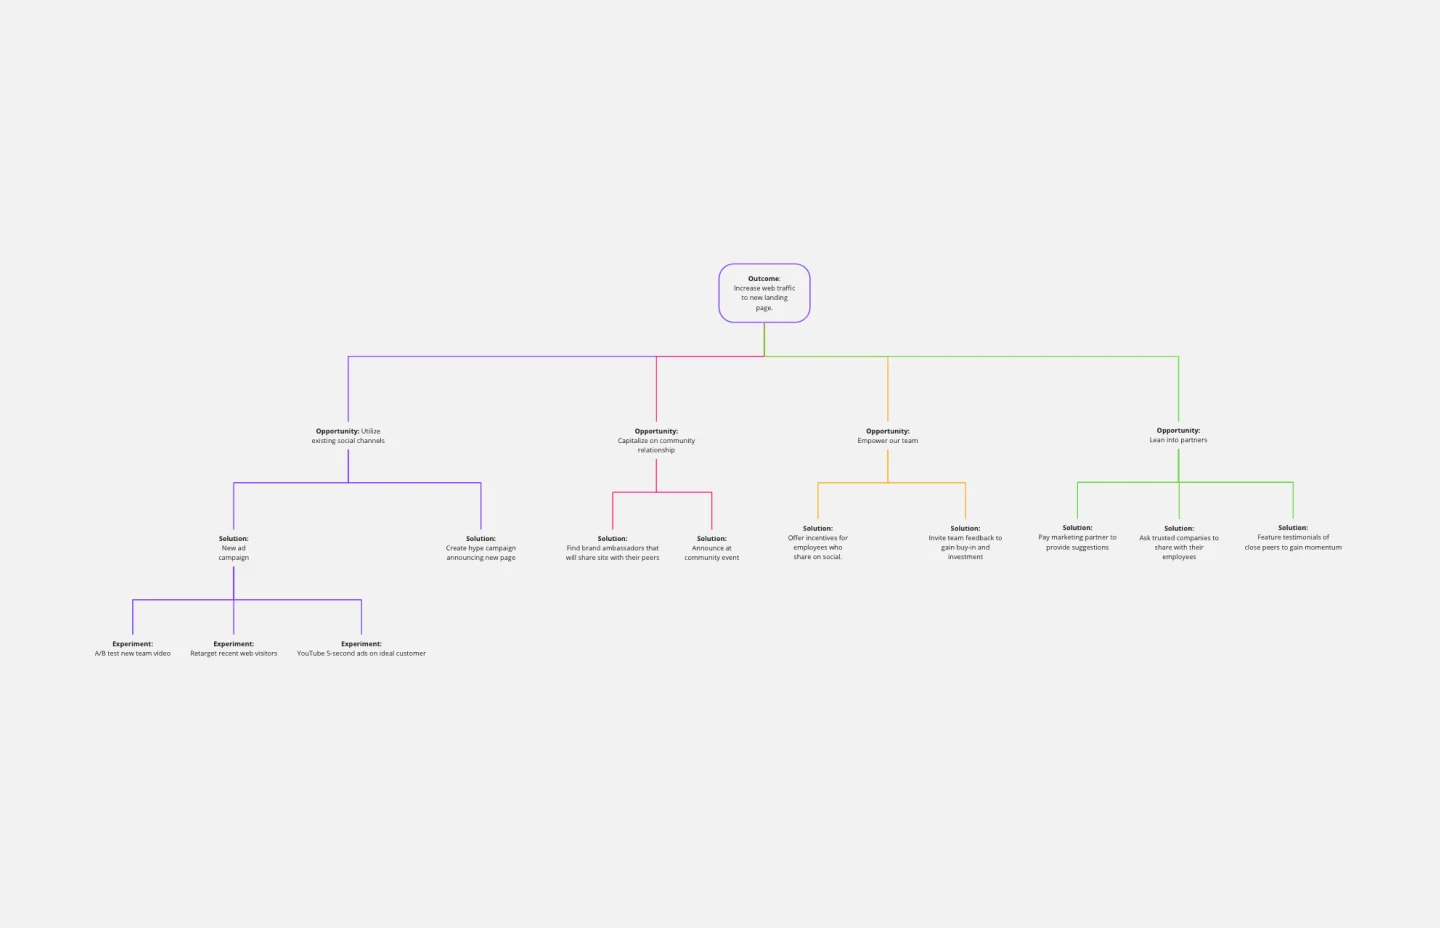
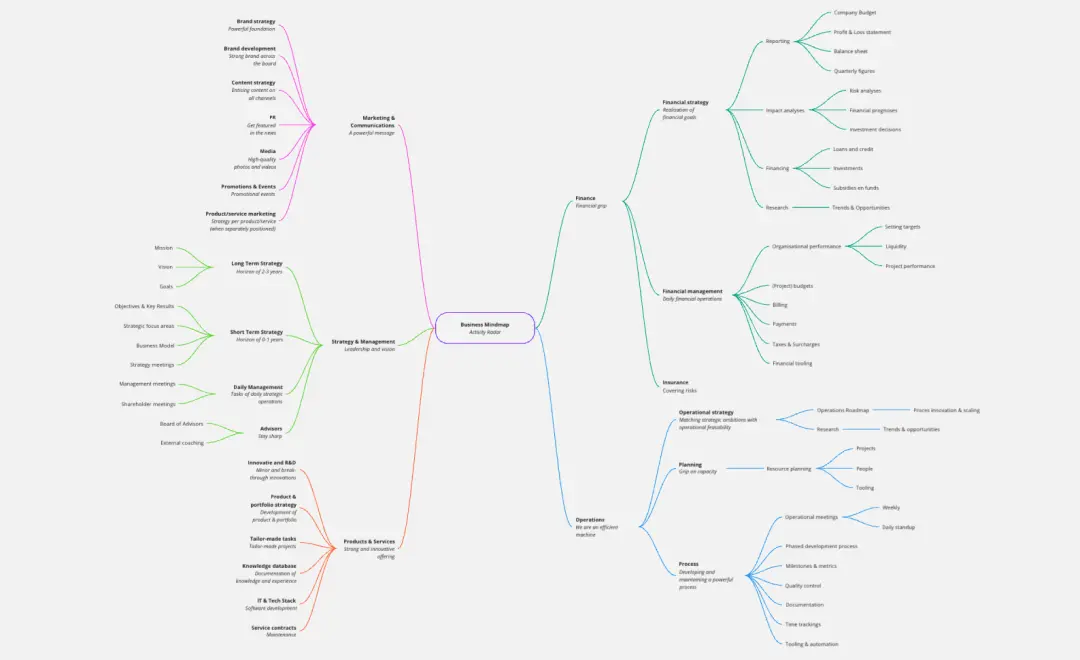
The template consists of three main areas:
Statement of aim/outcome: This is the heart of the diagram, indicating the ultimate objective or desired result.
Primary drivers: Directly stemming from the aim, these represent integral strategies or areas that are pivotal to achieving the overarching outcome.
Ideas: Branching out from each driver, these signify specific actions or initiatives that support the fulfillment of their respective drivers.
How to use the driver diagram template
The driver diagram template can be used to foster a shared understanding among team members, guide improvement efforts, and provide a structured approach to problem-solving and goal achievement. Here’s how to fill in the template to make it your own:
Add your primary aim: Starting with the "Statement of Aim/Outcome," define the primary goal or outcome that you want to achieve. This could be a desired improvement in a process, customer satisfaction, or any other measurable objective.
Expand your diagram: Edit the shapes and lines to add more drivers and connectors. Include secondary aims or sub-goals that are related to the primary aim. These secondary aims help break down the larger goal into more manageable components. Continue expanding the diagram to include drivers that directly impact the achievement of the secondary aims and, ultimately, the primary aim. Use arrows to indicate the relationships between different elements in the diagram.
Embed additional elements: Elevate the diagram by incorporating other elements, such as notes or reference images, to provide deeper context.
Why should you use a driver diagram template?
By visually representing the drivers and relationships, teams can better prioritize their efforts and focus on the most critical factors for success. Here are a few benefits the driver diagram template provides:
Visualization: Understand and define the cascade from overarching goals to specific actions.
Structured approach: Facilitate methodical planning by breaking down the goal into actionable steps.
Team collaboration: Encourage consistent understanding and teamwork towards a unified objective.
Efficient allocation: Allow for precise resource and time allocation based on priority and impact.
Track & refine: Filling in the driver diagram template makes monitoring progress and making necessary adjustments simpler.
If you'd prefer to start from scratch, diagramming with Miro is easy! You can choose from a wide range of diagramming shapes in Miro's extensive library, so you'll find just what you need.
Driver diagram template FAQs
Can I add more levels of ideas or drivers to the template?
Yes, the template is flexible and can be expanded to include additional layers or branches as your project needs.
How do I make the diagram more interactive?
Once you’ve added the driver diagram template to your Miro board, you have the option to add clickable links, annotations, and other interactive elements to enrich the user experience.
Can I color-code differently than what's shown?
Absolutely. The colors are customizable, allowing you to adapt based on preferences or significance.