About the Double Bubble Map Template
Brainstorm, analyze, and compare ideas or concepts in a structured and engaging way with Miro's double bubble map template. Whether planning a project, facilitating a discussion, or organizing your thoughts, this template enables creativity and clarity within your team.
What's a double bubble map template?
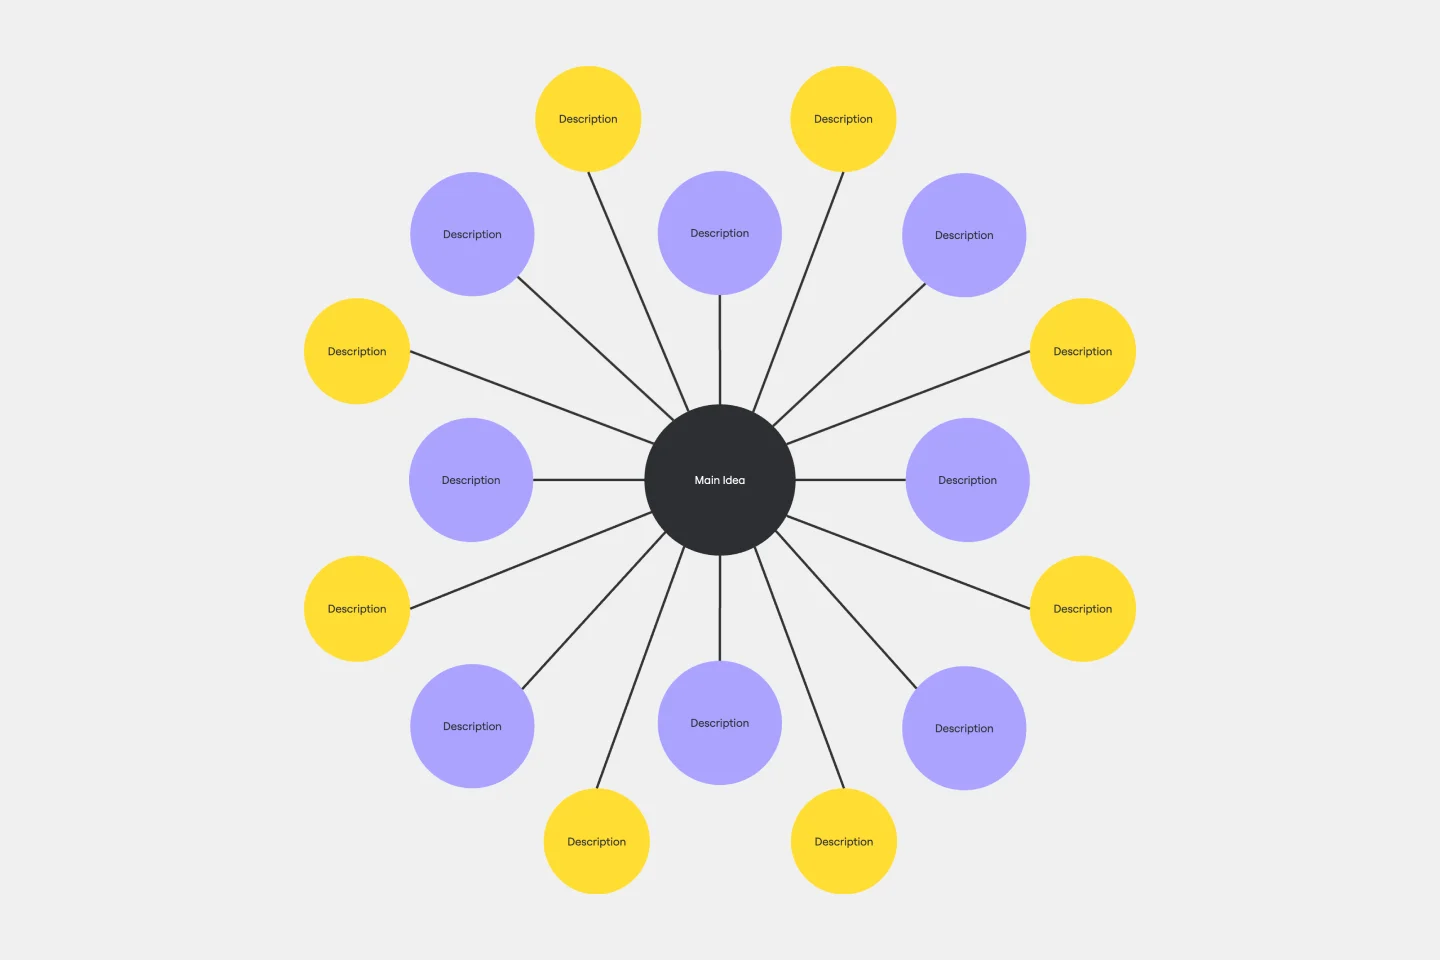
A double bubble map template is a visual diagramming tool that allows teams to explore relationships and connections between central ideas or concepts. It consists of two interconnected bubbles, each representing one of the main ideas. Lines and connecting elements extend from these bubbles to show the ideas' relationships, similarities, and differences. This template is a dynamic framework for online brainstorming, organizing information, and gaining insights into complex topics by visualizing how ideas interrelate.
Benefits of using the double bubble map template
Enhanced clarity: The double bubble map helps teams clarify their thoughts and ideas by visually representing the connections between two central concepts. This clarity minimizes misunderstandings and ensures everyone is on the same page.
Efficient brainstorming: It fosters efficient brainstorming sessions, encouraging teams to explore the intersections of ideas and identify potential areas of synergy or conflict.
Improved decision-making: Teams can make more informed decisions by using the template to weigh the pros and cons of different options, making it a valuable tool for problem-solving.
Effective communication: Visualizing complex relationships makes communicating ideas within the team and with stakeholders easier, promoting effective collaboration.
Customization: Miro's double bubble map template is highly customizable, allowing teams to adapt it to their specific needs and preferences.
How to use the double bubble map template in Miro
Creating a double bubble map diagram in Miro is a breeze:
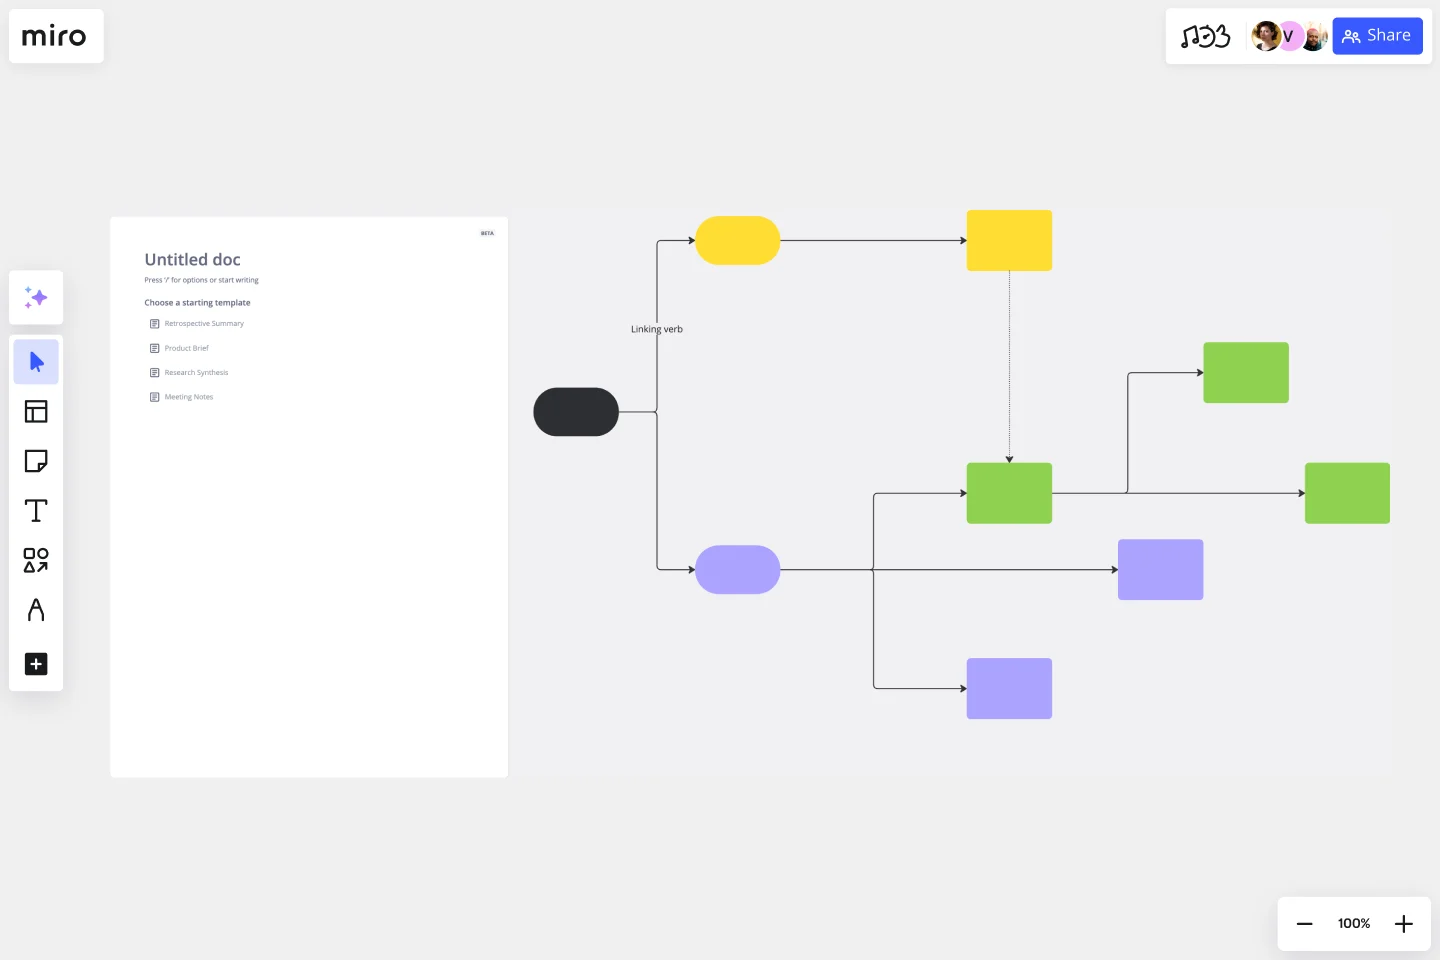
Add the template: Search the Miro Template Library for the "Double Bubble Map Template." Click to add it to your board.
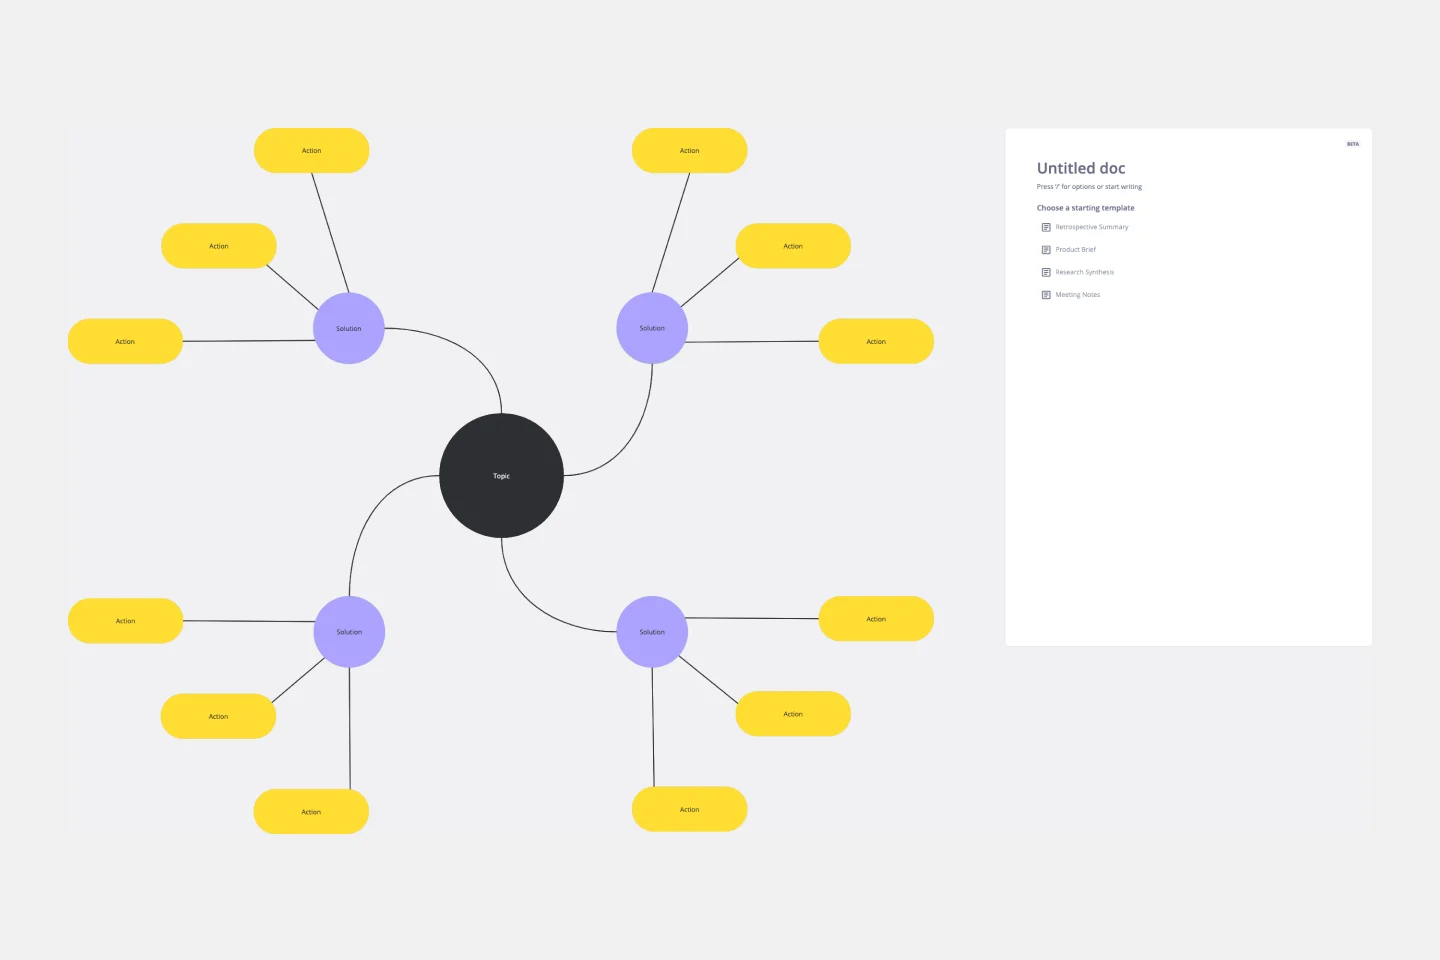
Customize your map: Double-click on the bubbles to add your central ideas. Use Miro's drawing tools and connectors to visualize the relationships and details.
Collaborate with others: Share the board link with your team members and collaborate in real time, whether in the same room or working remotely. Discuss, share, and refine your ideas quickly with Miro's bubble map maker.
Double Bubble Map Template FAQs
Can I add more than two central ideas to the double bubble map template?
The double bubble map template in Miro is primarily designed for comparing two main ideas. However, you can create multiple templates within a board to effectively compare more than two concepts.
Can I export or print my double bubble map for offline use?
Yes, you can export your double bubble map as an image or PDF from Miro, making it easy to share or print for offline reference.
Are there collaboration restrictions on the double bubble map template in Miro?
No, Miro allows real-time collaboration for all users on a board, so your team can work together seamlessly on your double bubble map.