74 likes
367 uses
Deep Understanding of Users:
The empathy map helps in gaining a profound understanding of the users' needs, motivations, and experiences. It allows you to step into their shoes and see the world from their perspective.
Enhanced Product Development:
By understanding what users think, feel, see, hear, say, and do, you can create products and services that truly resonate with them. This ensures that the end product is user-centric and meets their expectations.
Improved Communication:
Empathy maps facilitate better communication within the team by providing a clear, visual representation of user personas. This helps align everyone's understanding and keeps the team focused on the user's needs.
Identifying Pain Points and Gains:
The template helps in identifying user pain points and what they want to achieve (gains). This information is crucial for addressing user challenges and enhancing their overall experience.
Informed Decision Making:
With detailed personas and empathy maps, decision-making becomes more informed and data-driven. It helps in prioritizing features, making design choices, and planning marketing strategies based on real user insights.
Increased User Engagement:
Understanding users on a deeper level allows you to create more engaging and relevant content, products, and services. This leads to increased user satisfaction and loyalty.
Product Development and Design:
Utilize the empathy map to guide product development teams in creating user-centric products. It ensures that the design and functionality align with user needs and preferences.
Marketing and Communication:
Use the personas and empathy maps to develop targeted marketing campaigns. Understanding the users’ thoughts, feelings, and behaviors helps in crafting messages that resonate with them.
Customer Journey Mapping:
Integrate empathy maps into customer journey mapping to visualize the entire user experience. This helps in identifying touchpoints, pain points, and opportunities for improvement.
User Research and Analysis:
Employ empathy maps as a tool for organizing and analyzing user research data. It helps in summarizing qualitative research findings and presenting them in a structured manner.
Stakeholder Alignment:
Share empathy maps with stakeholders to ensure everyone has a unified understanding of the target users. This fosters collaboration and consensus on user-centered goals and strategies.
Training and Onboarding:
Use the template to train new team members about the target audience. It provides a comprehensive overview of the users, helping newcomers quickly get up to speed with user-centric approaches.
Innovation and Ideation:
Leverage empathy maps during brainstorming sessions to generate innovative ideas that address real user needs. It provides a user-focused lens for creative problem-solving.
Service Design:
Apply the empathy map in service design to enhance user experiences across various touchpoints. It helps in designing services that are intuitive, efficient, and user-friendly.
By incorporating detailed empathy maps and personas into your processes, you can create more effective, user-centered solutions that drive engagement, satisfaction, and success.
Regards,
Khawaja Rizwan

Rizwan Khawaja
Solution Architect @ ICT Consultant
I hold master's degrees in computer science and project management along with trainings and certifications in various technologies. All this is coupled with 25+ years of industry experience.
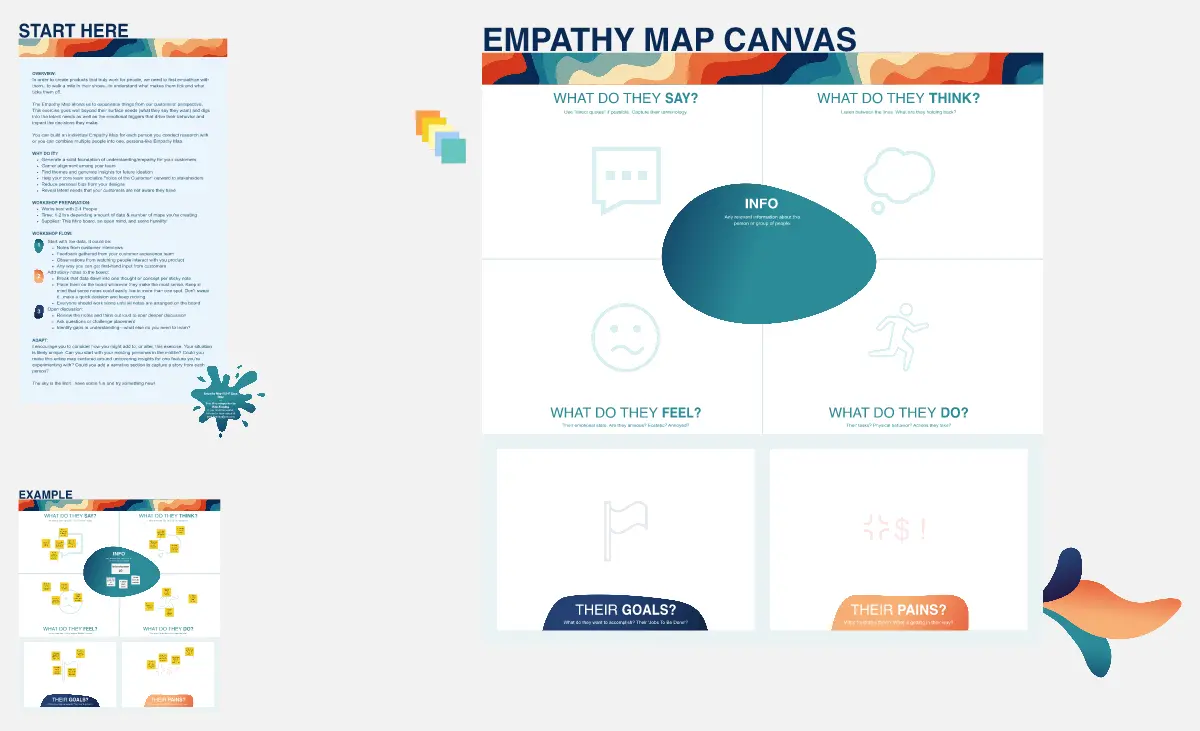
Empathy Map Canvas
The Empathy Map Canvas is a versatile tool for visualizing user behavior and emotions. It helps teams capture insights about what users see, hear, think, and feel. Use this template to build empathy and ensure your product meets real user needs.
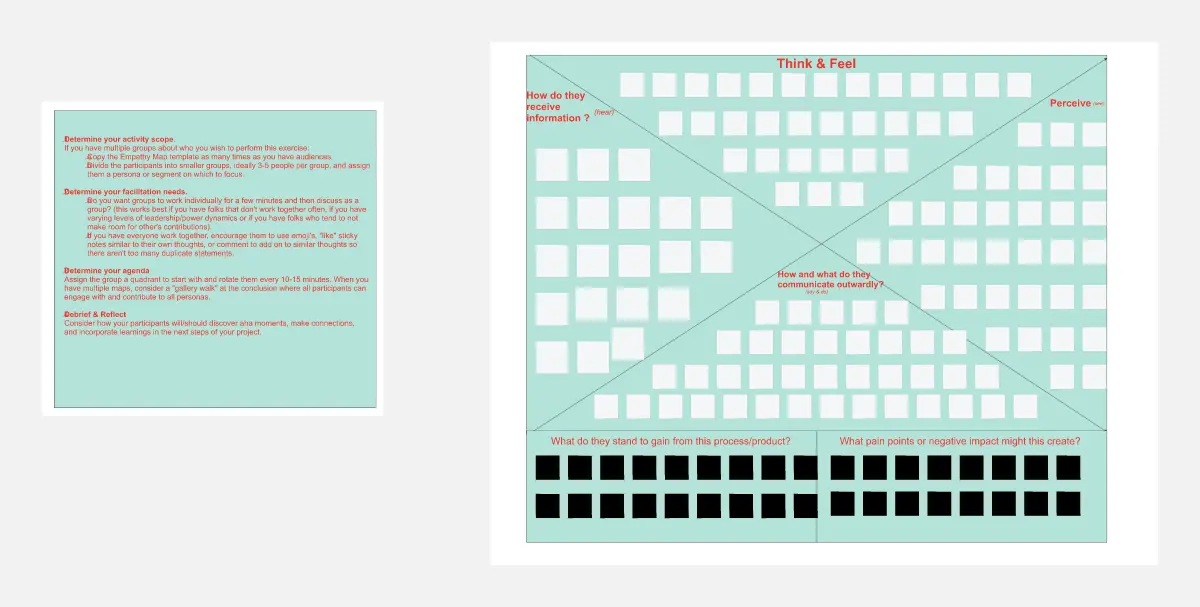
Empathy Map
The Empathy Map template is designed to help you understand your users deeply. It captures user behaviors, thoughts, and feelings, allowing you to design products that truly resonate with their needs. Use this template to enhance your UX research and create user-centered designs.
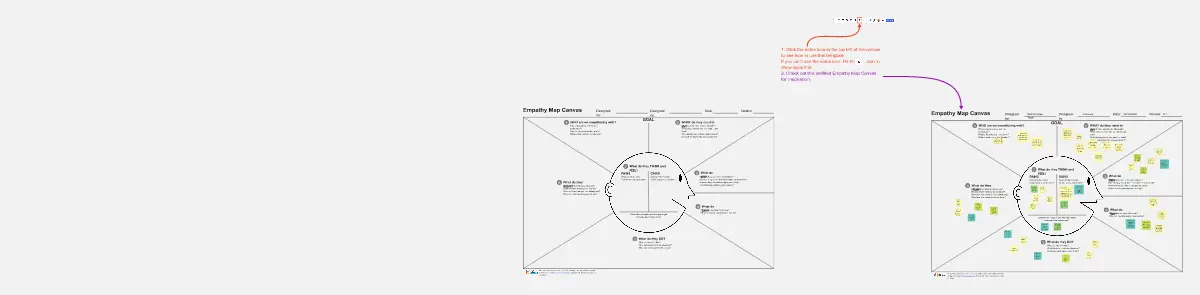
Empathy Map Canvas
Empathy Map Canvas is an essential tool for capturing user insights. By visualizing what users think, feel, and experience, you can create more effective and user-friendly designs. This template is perfect for teams focused on user-centered design.
Empathy Map Canvas
The Empathy Map Canvas is a versatile tool for visualizing user behavior and emotions. It helps teams capture insights about what users see, hear, think, and feel. Use this template to build empathy and ensure your product meets real user needs.
Empathy Map
The Empathy Map template is designed to help you understand your users deeply. It captures user behaviors, thoughts, and feelings, allowing you to design products that truly resonate with their needs. Use this template to enhance your UX research and create user-centered designs.
Empathy Map Canvas
Empathy Map Canvas is an essential tool for capturing user insights. By visualizing what users think, feel, and experience, you can create more effective and user-friendly designs. This template is perfect for teams focused on user-centered design.