Customer Journey Map by Columbia Road
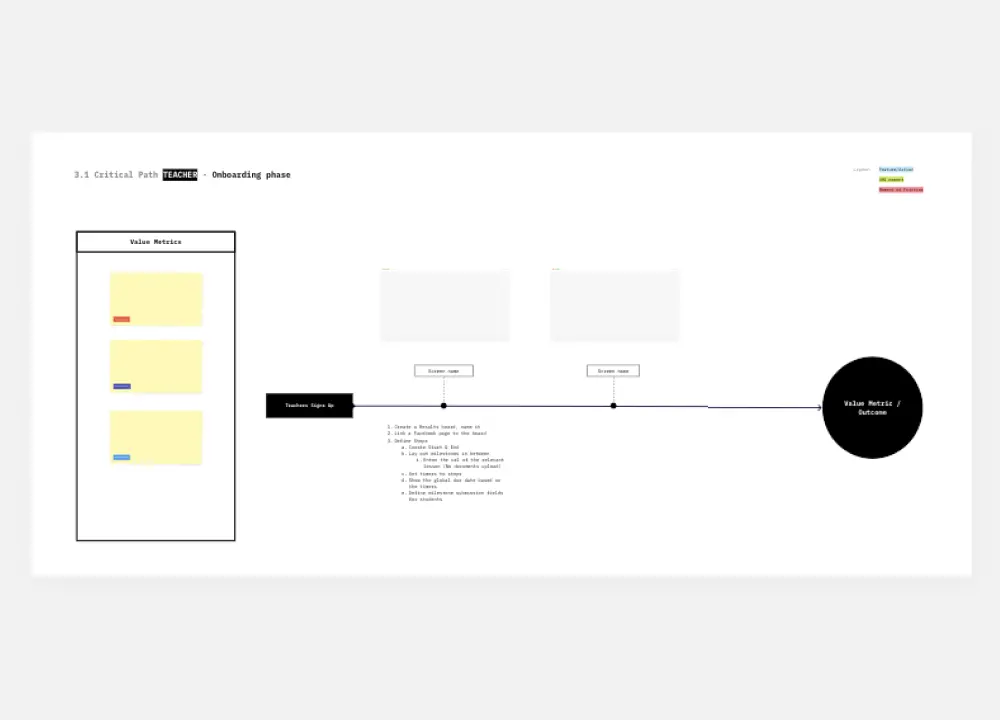
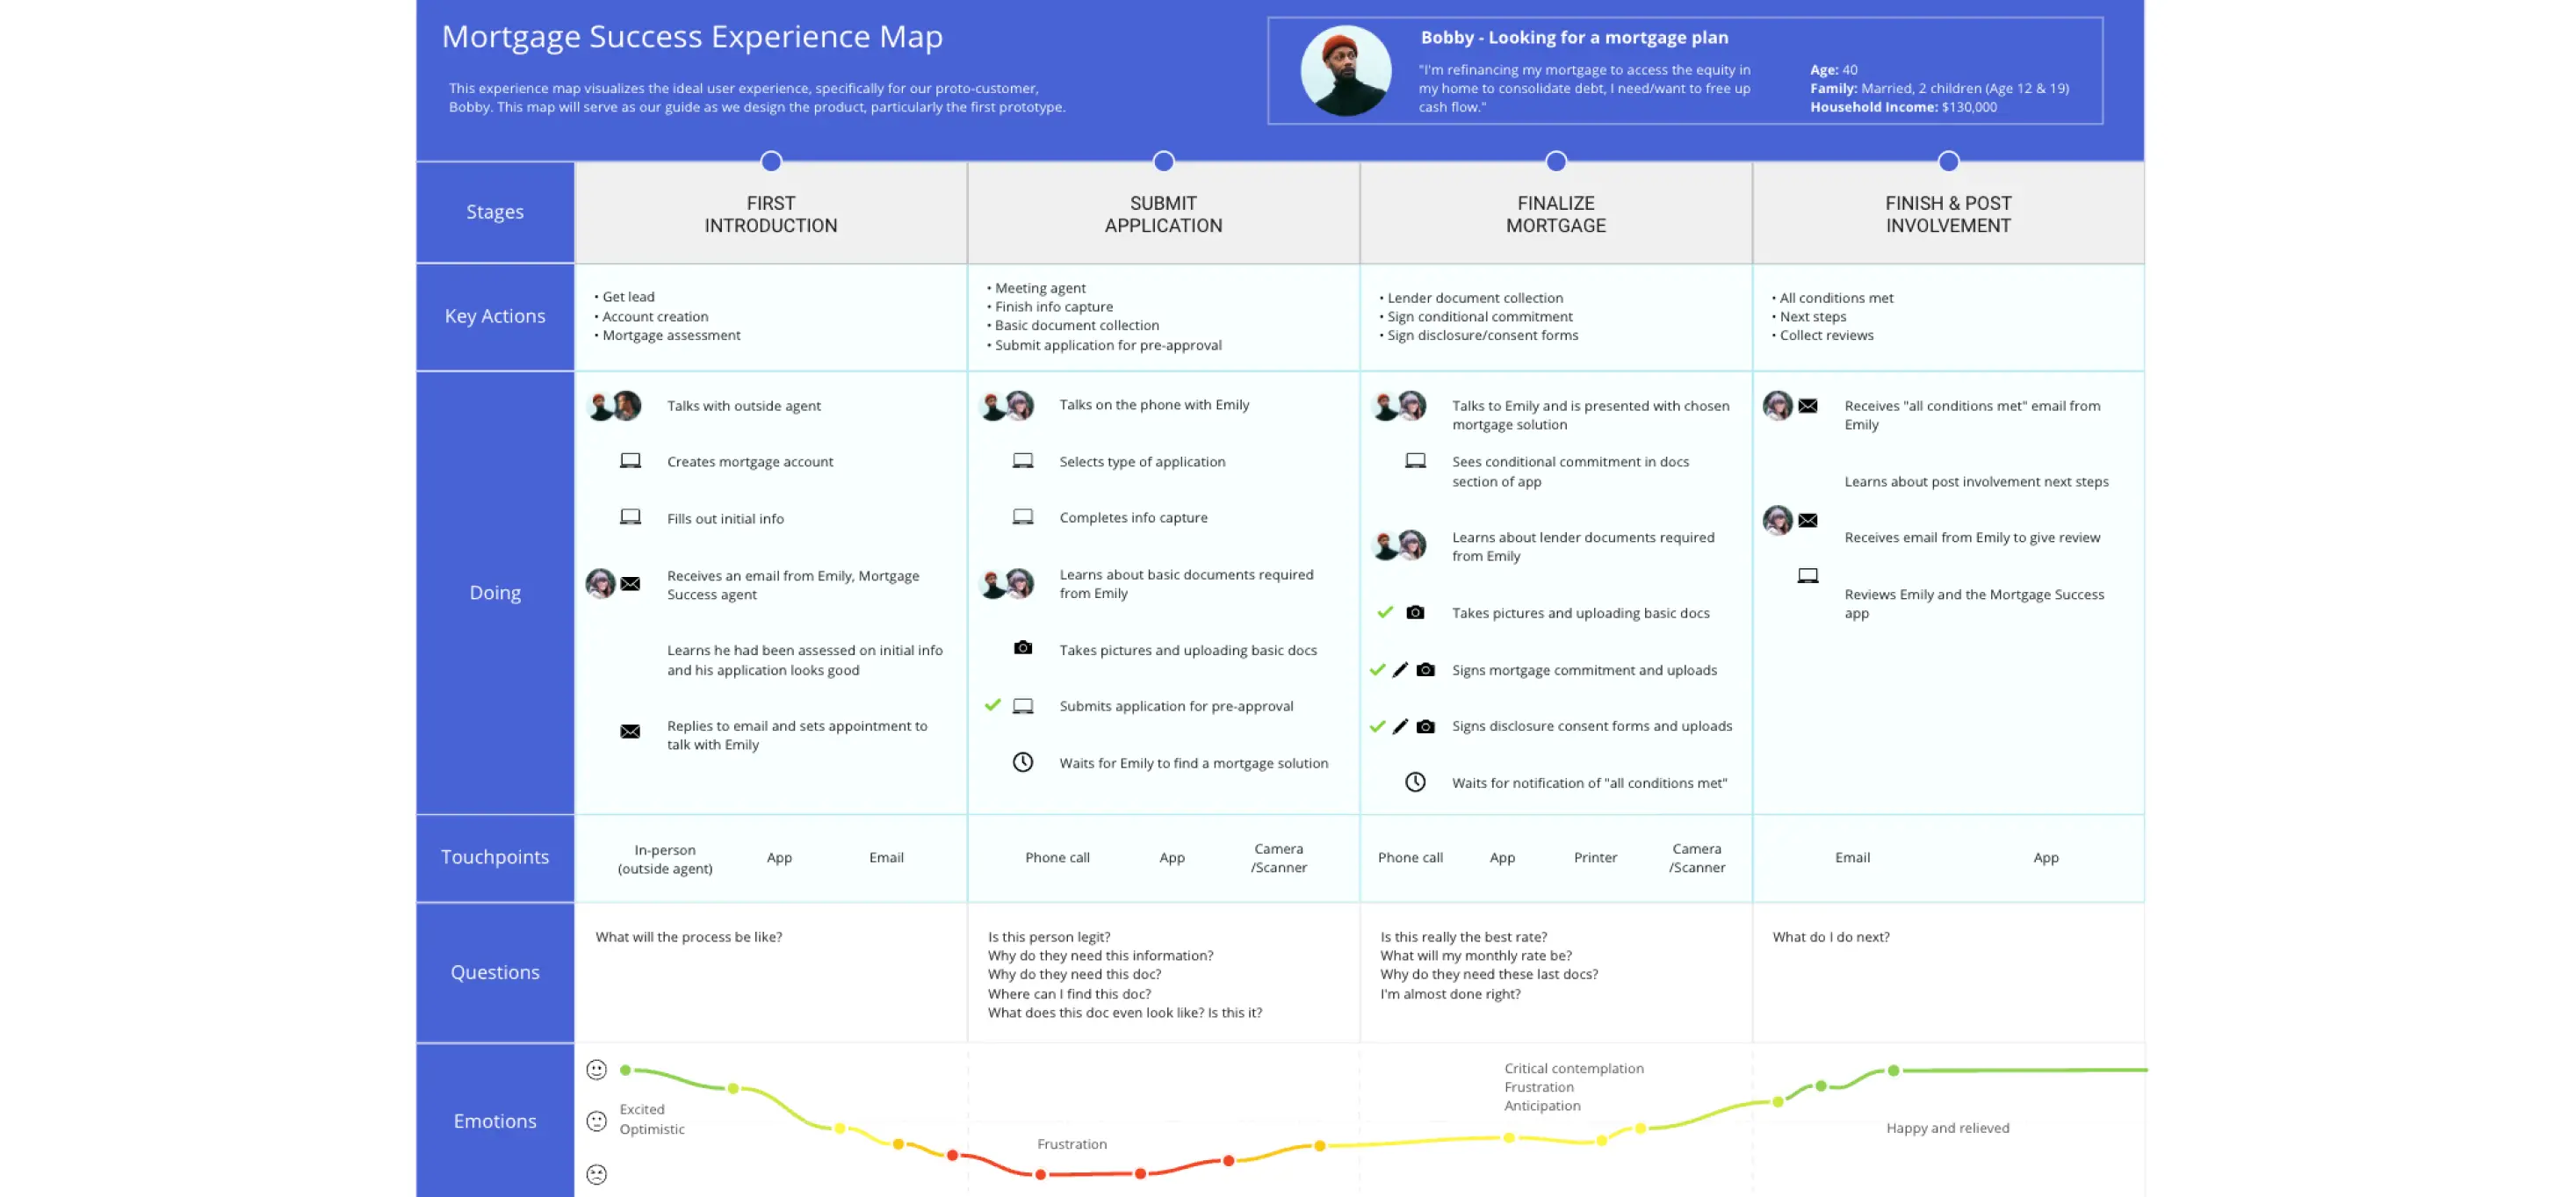
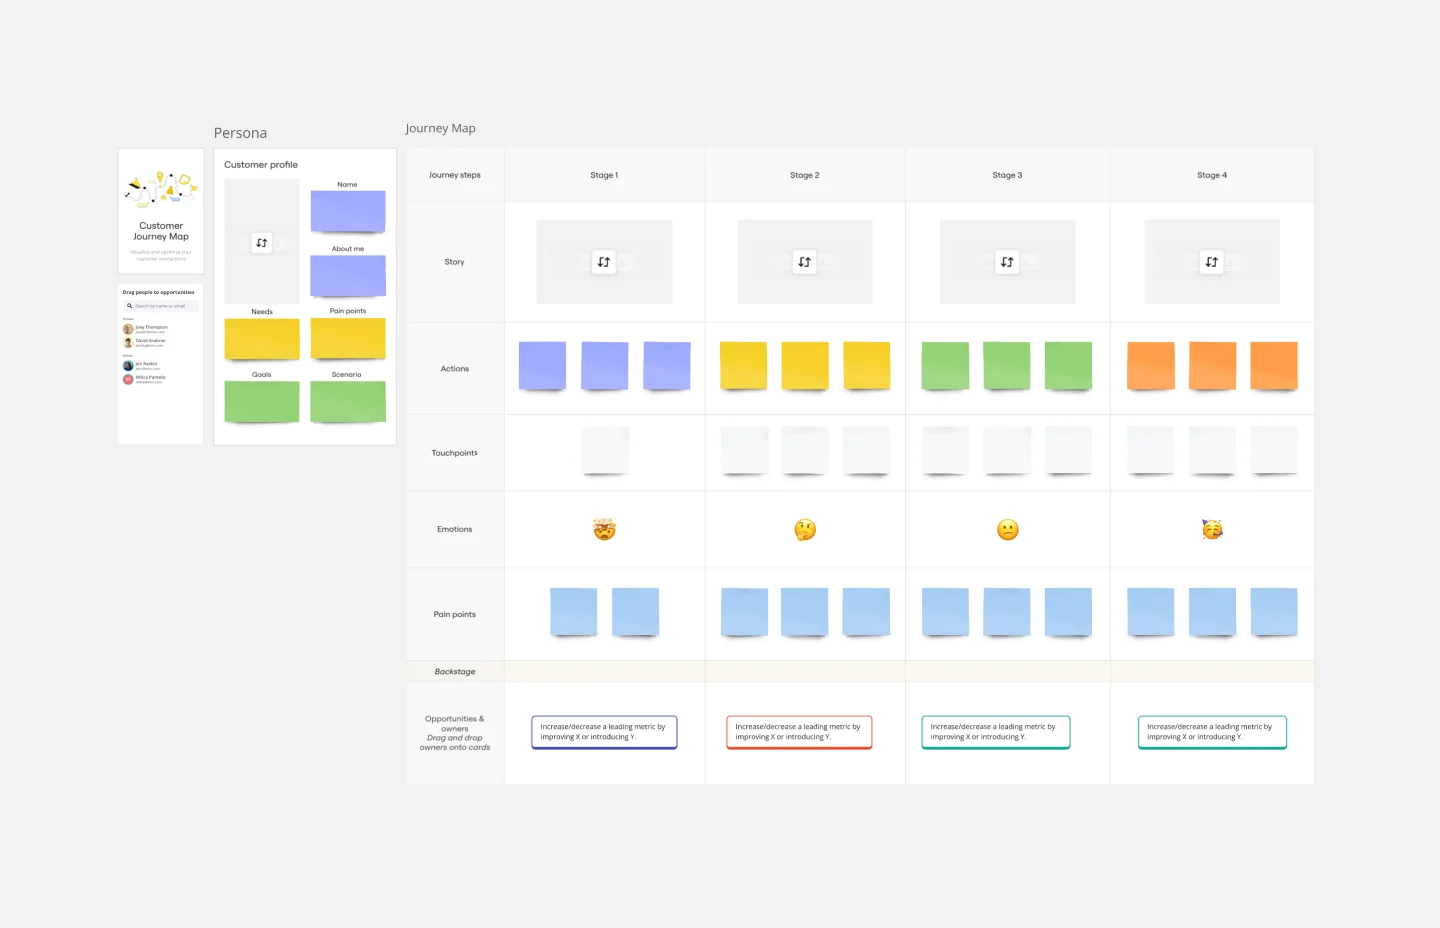
The aim of the customer journey is to help you break down the customer's activities from both a front-end and back-end perspective.
The front-end activities are clearly visible and customer-facing, whilst the back-end ones are activities invisible to the customer, yet important variables to be considered in any product or service.
The sustainability layers helps you stay aware of the environmental impact a business will generate, thinking about positives, negatives and ideas worth exploring.
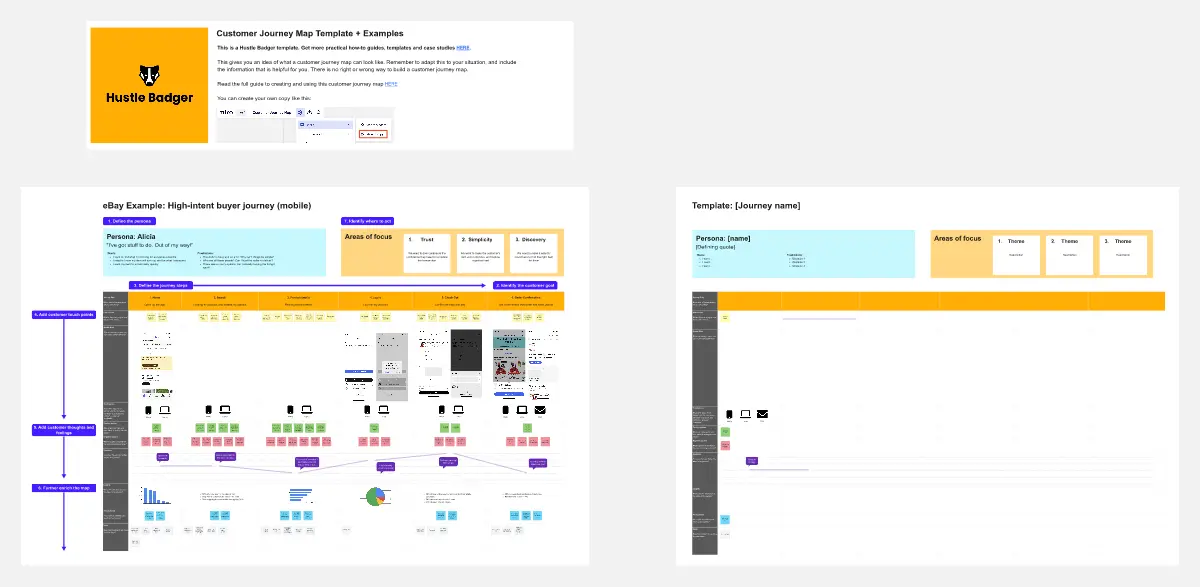
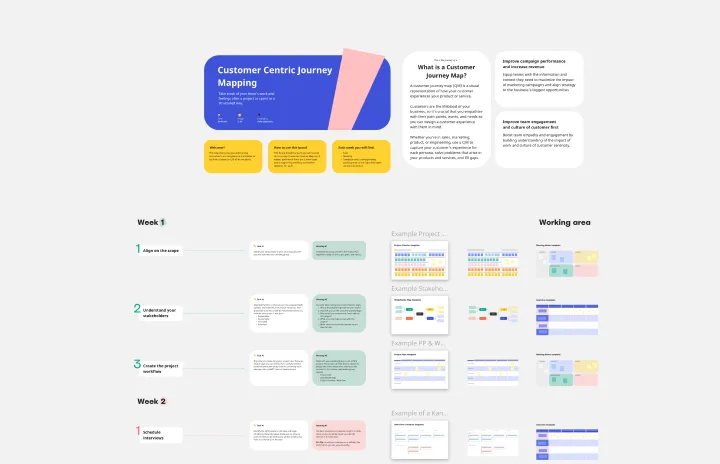
This template was created by Columbia Road.
Get started with this template right now.
Mind Map Template
Works best for:
Design
Based on Joseph Novak's innovation, Concept Mapping, this template helps to organize ideas and demonstrate a comprehensive understanding of a subject. It visually arranges all the details about a topic, which fosters shared understanding. This technique is particularly useful when explaining different facets or related topics.
Infographic Template
Works best for:
Marketing, Desk Research, Documentation
As we bet you’ve experienced, data can get pretty dense and dry. But you need it to be compelling, memorable, and understandable. The solution? Infographics. These are tools that let you present information in a visually striking way and turn quantitative or qualitative data into stories that engage and resonate. Whoever you’ll be presenting to — customers, donors, or your own internal teams — our template will let you design an infographic that combines text and visuals to break down even the most complicated data.
Design Sprint Kit Template
Works best for:
Agile Methodology, UX Design, Sprint Planning
With the right focused and strategic approach, five days is all it takes to address your biggest product challenges. That’s the thinking behind Design Sprint methodology. Created by Tanya Junell of Blue Label Labs, this Design Sprint Kit provides a set of lightweight templates that support the Design Sprint’s collaborative activities and voting—and maintains the energy, team spirit, and momentum that was sparked in the session. Virtual sprint supplies and prepared whiteboards make this kit especially useful for remote Design Sprint Facilitators.
Root Cause Evaluation Template
When you first encounter a complex situation, it's not common to immediately delve into its underlying causes and effects. Often, we grasp the overall picture but fail to separate the problem from its surrounding circumstances. Root Cause Evaluation provides a method to better understand the interconnected factors that have contributed to the current situation.
2x2 Prio Matrix Template
Works best for:
Design
Understanding the balance between importance and difficulty is crucial for effective decision-making and progress. To aid in prioritization, a simple 2x2 matrix can map these factors on the x-axis and y-axis, respectively. This framework allows you to assess the trade-offs and tensions involved. The lower left quadrant represents quick wins, while the upper left quadrant consists of luxury items that may be costly with limited returns. The upper right quadrant contains strategic items that require significant investments for substantial results. Finally, the lower right quadrant houses the most valuable items, offering high impact at a lower cost.
Analytics Storyboard
Works best for:
Planning, Storyboard, Design
Visualize your data insights with the Analytics Storyboard template. This tool is perfect for data analysts and business intelligence teams, helping you present complex data in a clear and engaging narrative format. It includes sections for data sources, key findings, and visualizations, ensuring your audience can easily understand and act on your insights. Use this template to create compelling data stories that drive informed decision-making and strategic planning.