About the Conversion Funnel Backlog Template
Conversion funnel backlogs can help early or growth-stage product managers understand how to improve their conversion rate.
The conversion funnel backlog represents two sides of your product: the quantitative (numbers-based) data around drop-off rates and potential pain points in your funnel, and the qualitative (word-based) data such as the backlog of ideas and opportunity areas.
The funnel model allows your product team to focus on areas with visible drop-off rates. Once your team knows what stage has low conversions, you can focus on improving the numbers until a high-growth opportunity appears somewhere else in the funnel.
What is a conversion funnel backlog?
A conversion funnel backlog allows your team to visualize potential buyer flow and conversion pathways and turn them into paying customers. Your customers may visit your website via search engine results pages, content marketing, social media, paid advertising, or cold outreach. By analyzing each stage of the process, you can figure out what to do to improve the user flow.
There are typically five stages in the funnel backlog:
Acquisition: How do your customers find you?
Activation: How quickly can you get your customers to the “aha moment”?
Retention: How many customers are you retaining? Why are you losing other customers?
Referral: How can you turn your customers into advocates?
Revenue: How can you increase your product or service’s profitability?Each stage can be improved with new ideas, and by keeping track of (positive) conversion rates and (negative) drop-off rates.
When to use conversion funnel backlogs
You can develop conversion funnels for many different scenarios, including:
Registration and login funnels: what steps or dead ends in the process prevent users from signing up for your product or service?
Tutorial funnels: are users becoming confused, bored, or stalled by a performance issue (such as a need for more interactivity)?
In-app purchase funnels: why are your users abandoning your checkout screen?
Upgrade-to-pro funnels: what can you learn about users most engaged with your app, and their behavioral patterns?
Level completion funnels: for gamified apps or experiences, how can you balance easy and challenging skill level offerings with encouraging repeat users?
Search funnels: how long does your website take to deliver results or respond? What results are you failing to deliver (that could be used as content gap analysis data)?
Cancel subscription “winback” funnels: how can you use drop-offs to create conversions? How can re-engagement messaging or promotions lead to acquiring customers again?
How to use the conversion funnel backlog template
Get started by selecting the conversion funnel backlog template, then take the following steps to make one of your own.
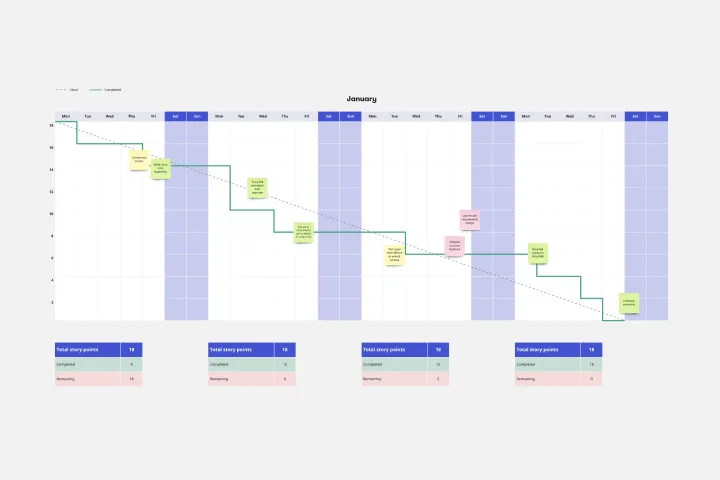
1. Review each funnel stage and plot out conversion rates
Review the conversion rate data from your analytics dashboard and update the in-between funnel conversion rate percentages. Focus your team’s energy (and ideas) on areas with the lowest rates (for example, revenue or referral).
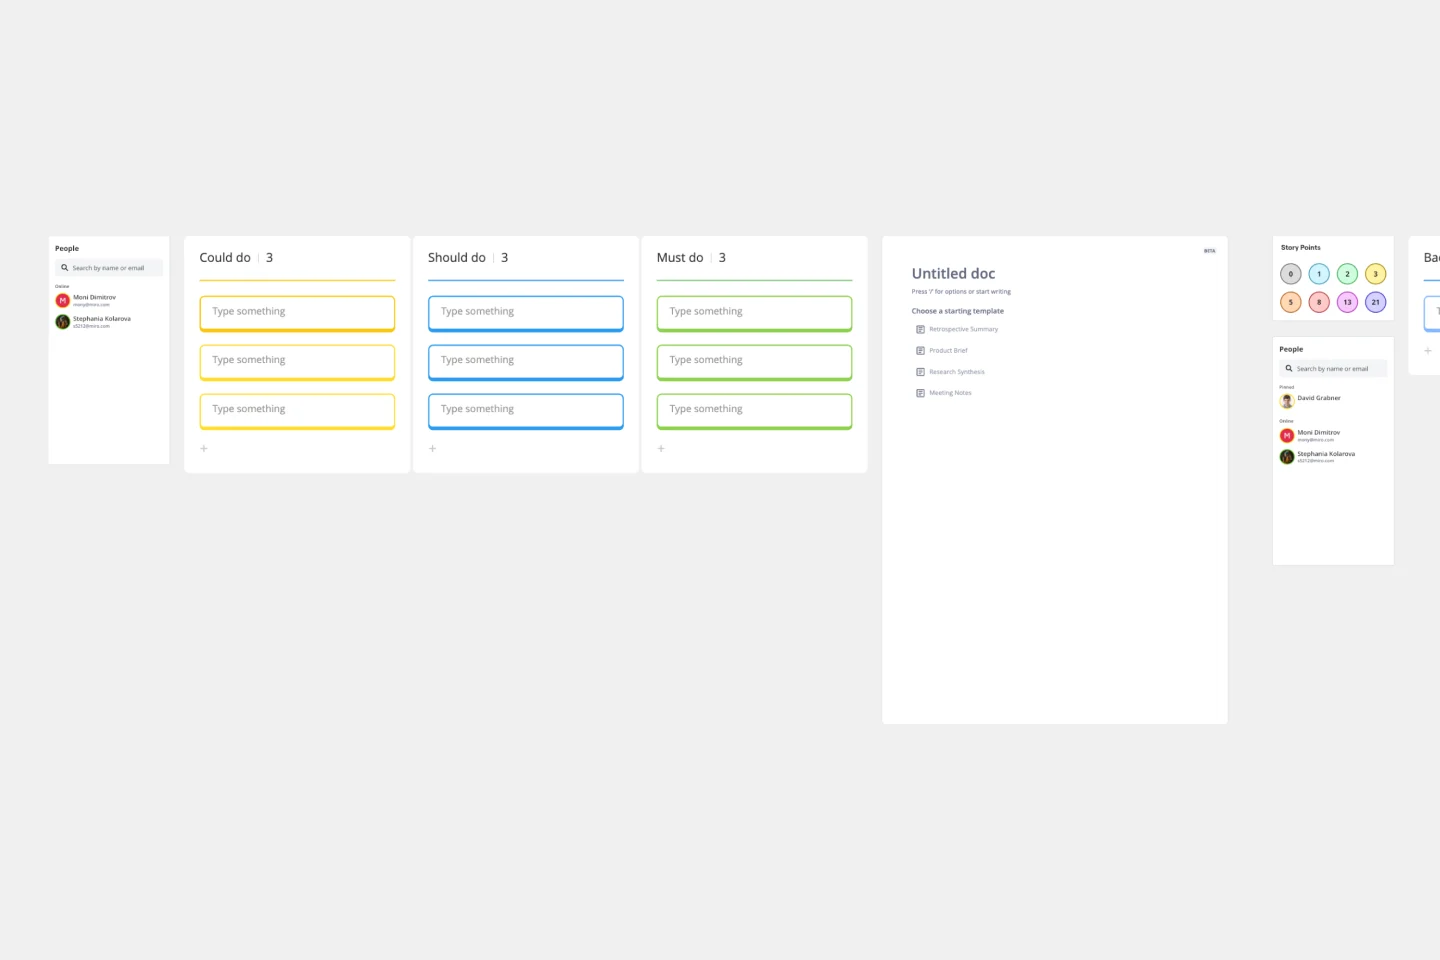
2. Brainstorm as a team
Ask your team to brainstorm ideas, prioritizing low-conversion areas, then adding activities to maintain high-conversion areas. Use sticky notes to jot down ideas and place them on the funnel.
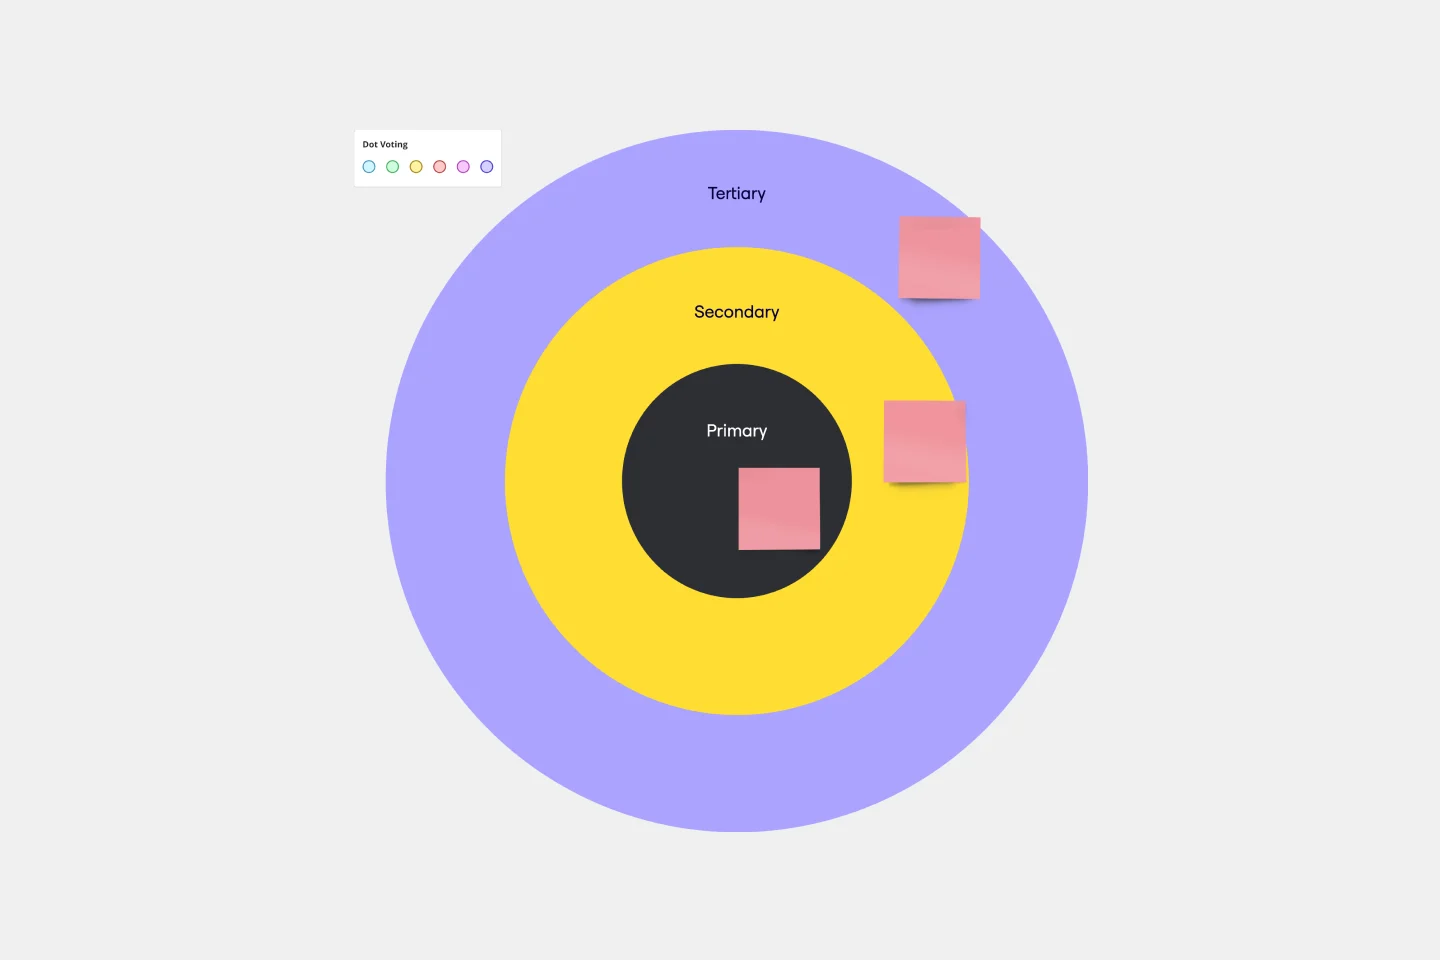
3. Prioritize ideas
Start by prioritizing 1-2 ideas that are actionable. Ask everyone to vote on which ideas to prioritize in the lowest conversion areas. Once there’s a clear winning idea (or two), assign team members responsibility to make it happen.
3. Review regularly
Review your conversion funnel backlog regularly. After testing or implementation periods end, collect the results and data to keep this conversion funnel updated. You can decide if other funnel stages need urgent attention, as drop-off rates shift higher or lower down the funnel. Make sure to tie your results back to a bigger impact, too. Link these conversion funnel ideas back to strategic planning documents to always keep it top-of-mind.