Business Intelligence Architecture Template
Simplify complex data structures with the business intelligence architecture template. Visualize data sources, warehouses, ETL processes, tools, and interfaces with ease.
About the Business Intelligence Architecture Template
The Business Intelligence Architecture Diagram Template is a useful tool for creating visual representations of complex data structures and processes in a business intelligence system. This template is designed to meet the needs of IT professionals, data analysts, and business strategists, allowing them to communicate complex ideas effectively and promote better collaboration among team members.
Understanding the template
The business intelligence architecture template is usually divided into key areas, with the role of each component explained.
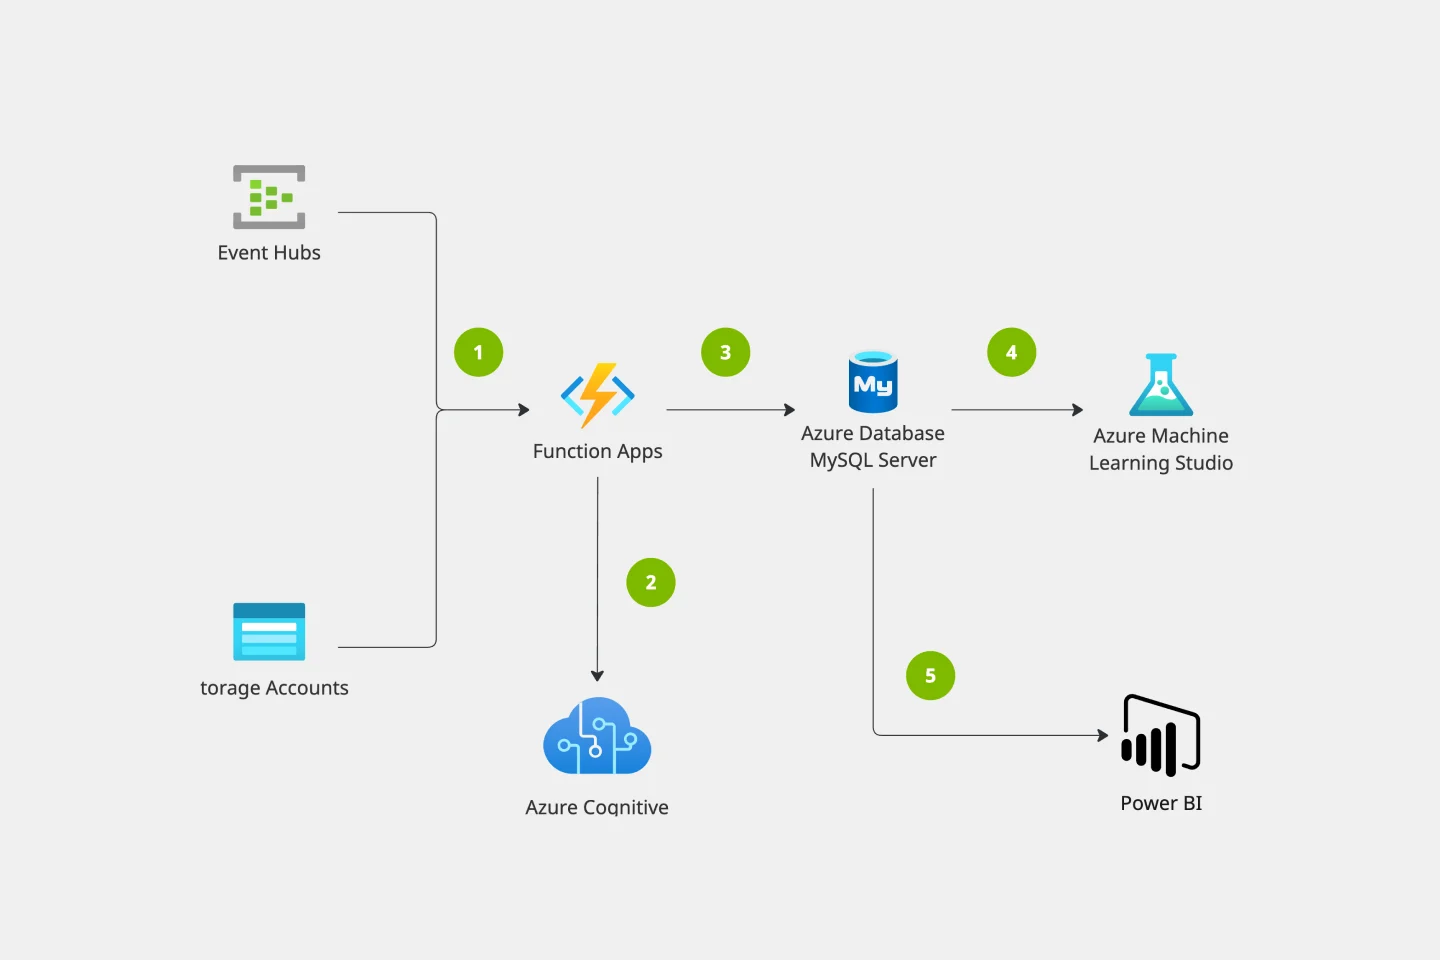
Data sources: This refers to the various databases and external APIs that contribute to the business intelligence system, providing different data inputs for analysis.
Data warehouse: It is the centralized repository where data is stored and organized in a structured format for easier retrieval and analysis.
ETL process: This process involves three main phases - extraction, transformation, and loading - to convert raw data into a usable format that can be analyzed and stored in the data warehouse.
Business intelligence tools: These are software and tools that help with data analysis, reporting, and visualization, providing a comprehensive view of the technological landscape.
Reporting and dashboards: This refers to the end-user interface, which includes reports and dashboards that offer a clear and user-friendly overview of the analyzed data.
How to use the business intelligence architecture template in Miro
Customize the template easily by using the drag-and-drop feature. This will help you represent your specific architecture seamlessly and with precision.
Miro's automated diagramming feature allows you to expand the template dynamically. This ensures that your diagram stays current with minimal manual intervention.
You can enhance the depth of your diagram by integrating relevant artifacts such as notes, comments, or links onto the Miro board. This provides additional context for your team.
Why should you use a business intelligence architecture Template?
Simplify complex concepts to enhance understanding and communication within the team. Encourage efficient collaboration among team members.
Collaboration is made easier with a visual roadmap, which helps prevent misunderstandings and facilitates decision-making, saving time.
Save time on project planning with professional diagrams.
Miro's automated diagramming features help businesses adapt effortlessly to evolving intelligence landscapes.
Can I customize the colors and shapes in the template?
The template is entirely customizable. Users can change colors, shapes, and labels to align with their preferences and organizational standards.
How frequently should I update my business intelligence architecture diagram?
Regular updates are advisable, particularly when changes occur in data sources, tools, or processes, ensuring the diagram accurately reflects the current state of the business intelligence system.
Get started with this template right now.
Cycle Diagram Template
Works best for:
Diagramming
The cycle diagram template empowers professionals to visually represent complex cycles with precision and clarity. This template maps out cyclical processes, relationships, or events, ensuring that complex concepts are communicated seamlessly. One key benefit that sets this template apart is its ability to streamline communication and enhance understanding. By crafting visually appealing cycle diagrams, professionals can distill complex information into a clear visual language, making it easier for teams and stakeholders to grasp complex relationships. This ultimately fosters more effective collaboration and decision-making.
Miro for AWS Well-Architected Framework Reviews
Works best for:
Diagramming, AWS
This AWS Well-Architected Framework Review (WAFR) template provides you and your team with a dedicated space to conduct a Well-Architected Framework Review with a client.
UML Sequence Deployment Pipeline Template
Works best for:
UML
The UML Sequence Deployment Pipeline Template in Miro visually maps the sequence of steps in an automated deployment pipeline, helping teams in software development and deployment. It helps identify bottlenecks, standardizes the deployment process, and facilitates new member onboarding for continuous improvement.
CI/CD Pipeline Diagram Template
Works best for:
Diagramming, Development
The CI/CD template is a well-designed roadmap for software deployment that enables a smooth and automated flow from development to production. This strategic layout includes critical elements such as source code management, automation servers, container orchestration, staging environments, and the final deployment to production. One of the key benefits of using such a template is that it builds a robust deployment pipeline, which significantly reduces manual intervention and human error. By visualizing each step and integrating automation throughout, teams can achieve faster deployment cycles, ensuring that new features, updates, and fixes are delivered to users promptly and reliably. This enhanced pace does not compromise quality, as the template inherently supports continuous testing and quality assurance, ensuring that each update is quick but also secure and stable before it is delivered to the end user.
Serverless Image Handler on AWS Template
Works best for:
AWS
The Serverless Image Handler on AWS template is designed to facilitate the management and transformation of images in cloud-based projects without the need for server infrastructure management. It is particularly useful for applications and projects that require dynamic image management, offering benefits like efficiency, scalability, and seamless integration with AWS services. By incorporating this template into Miro boards or projects, teams can streamline their workflows, especially when dealing with digital assets or dynamic content, ensuring that their image-handling needs are met efficiently as they scale.
Onion Diagram Template
Works best for:
Diagramming, Mapping and Diagramming
The Onion Diagram Template is a distinct tool designed to visually represent layers of a specific concept, system, or process, akin to the layers of an onion. Each concentric layer of the diagram provides insights into a different aspect or phase of the topic at hand, moving from the core foundational element outwards to more peripheral components. One of the prime benefits of this template is its ability to offer hierarchical clarity. Users can immediately discern the importance, sequence, or interrelation of different elements within a system, facilitating enhanced comprehension and efficient decision-making.