AWS Git to S3 Webhooks Template
You can now have an overview of your AWS architecture with Miro’s AWS Git to S3 Webhooks Template, track your cloud solutions easily, and optimize processes like never before.
About the AWS Git to S3 Webhooks diagram Template
The AWS Git to S3 Webhooks Template is a visual representation of Git webhooks with AWS services Quick Start architecture. You can now have an overview of your AWS architecture with Miro’s AWS Git to S3 Webhooks Template, track your cloud solutions easily, and optimize processes like never before.
Keep reading to learn more about AWS Git to S3 Webhooks diagram Template.
What is an AWS Git to S3 Webhooks diagram Template
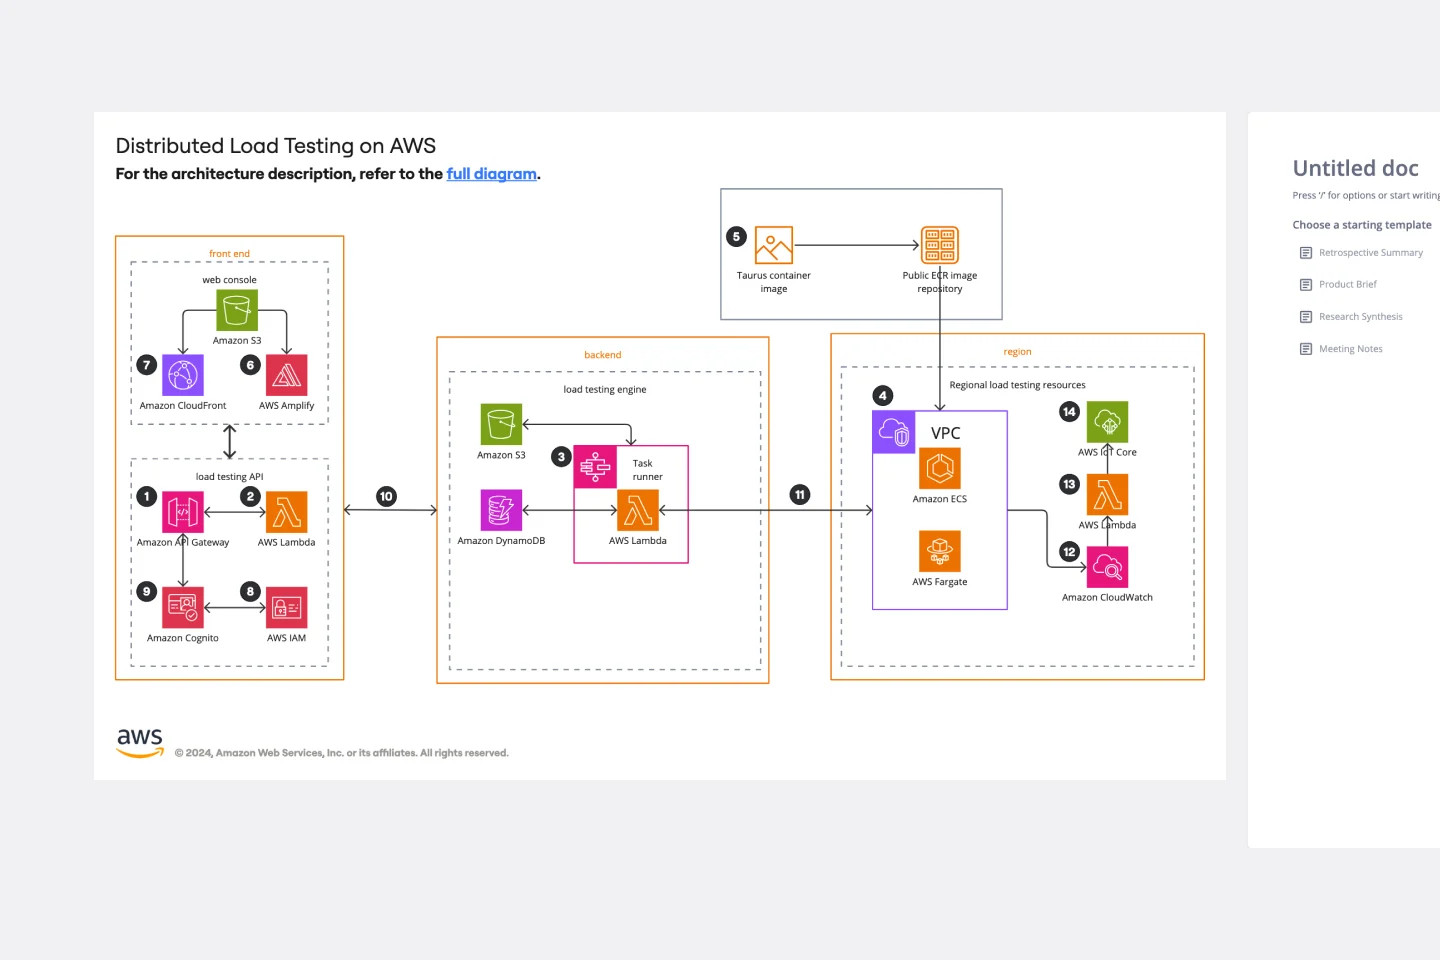
The AWS Git to S3 Webhooks Template, like any other diagram, visually shows the necessary steps of Git webhooks with AWS services Quick Start architecture. The AWS Git to S3 Webhooks has unique icons, symbols, and arrows that you can use for planning, designing, or auditing an architecture before or after deployment.
When to use AWS Git to S3 Webhooks Template
The AWS Git to S3 Webhooks architecture system key elements include:
Shapes: including service, resource, or general resource icons from AWS.
Connectors: including arrows that describe a flow of information or connect different parts of the diagram. They have a predetermined color.
Layout and grouping: the groups show the connection between multiple services or resources.
Styling and semantics: the colors mean the types of AWS functions and they are predetermined. When selecting an icon from the library, the right color will automatically be used.
When to use AWS Git to S3 Webhooks Template
You can use the AWS Git to S3 Webhooks Template to see the architecture of your AWS services configuration. Use it to configure a webhook to link your Git and AWS services.
How to create an AWS Git to S3 Webhook Template:
To create your AWS Git to S3 Webhook in Miro, follow the steps:
Lay out the structure: select the groups to use.
Open AWS Icon Set to add Architecture service and resource icons.
Add other steps: Does your diagram include external users or devices? Use resources to add depth or context to your diagram.
Connect the steps with arrows: use the arrows to connect the steps and describe the workflow.
In the AWS Git to S3 Webhook Template you will find the following AWS icons:
AWS Lambda: a serverless compute service that runs your code in response to events and automatically manages the underlying compute resources for you. Git webhook: allows you to build or set up integrations, such as GitHub Apps or OAuth Apps. AWS S3 key bucket: a key is a unique identifier for an object within a bucket.
Get started with this template right now.
Six Thinking Hats Template
Works best for:
Ideation, Brainstorming
The Six Thinking Hats by Dr. Edward de Bono was created as an alternative to argument, it is designed to help teams explore and develop ideas collaboratively. Use this template to boost creative thinking and get different perspectives so you and your team can make better-informed decisions.
Google Cloud Architecture Diagram Template
Works best for:
Software Development, Diagrams
Use the Google Cloud Architecture Diagram template to clearly visualize the deployment of your application and allow you and your team to optimize processes. The GCP template gives you a great overview of your application architecture, and it helps you to iterate quickly and better manage your application development, deployment, and documentation. Try it out and see if it works for you.
Cisco Network Diagram Template
Works best for:
Software Development, Diagrams
Cisco offers data center and access networking solutions built for scale with industry-leading automation, programmability, and real-time visibility. The Cisco Data Network Diagram uses Cisco elements to show the network design of Cisco Data Networks visually.
HEART Framework Template
Works best for:
Desk Research, Project Management, User Experience
Happiness, Engagement, Adoption, Retention, and Task Success. Those are the pillars of user experience — which is why they serve as the key metrics in the HEART framework. Developed by the research team at Google, this framework gives larger companies an accurate way to measure user experience at scale, which you can then reference throughout the product development lifecycle. While the HEART framework uses five metrics, you might not need all five for every project — choose the ones that will be most useful for your company and project.
Context Diagram Template
Works best for:
Business Management, Mapping, Diagrams
A context diagram is a perfect tool to view an entire system as a single process and understand how external factors interact with it. These external factors can include customers, developers, management, and more. The Context Diagram Template is your tool for creating this diagram.
Pie Chart Template
Works best for:
Education, Operations
Pie charts are an excellent way to present relationships between datasets graphically, where you can quickly compare information and see contrast right away. Professionals from many fields use pie charts to support their presentations and enrich their storytelling as it’s one of the most commonly used data charts.