AWS Cloud Infrastructure Optimization Template
Import your AWS infrastructure, evaluate cost impact, and align on an optimal solution.
About the AWS Cloud Infrastructure Optimization Template
The AWS Cloud Infrastructure Optimization Template is part of Miro's Intelligent Templates collection, designed to streamline and enhance the management of your AWS cloud resources. This template leverages Miro's advanced diagramming tools and integrates seamlessly with AWS to provide real-time data visualization, cost analysis, and performance optimization. It is an invaluable resource for cloud architects, AWS practitioners, and DevOps engineers looking to optimize their cloud infrastructure efficiently.
How to use the AWS Cloud Infrastructure Optimization Template
Connect to AWS: Begin by linking your AWS account to Miro. This integration allows the template to fetch real-time data from your AWS environment.
Import data: Use the template to import your existing AWS infrastructure data. This can be done manually or automatically through the integration.
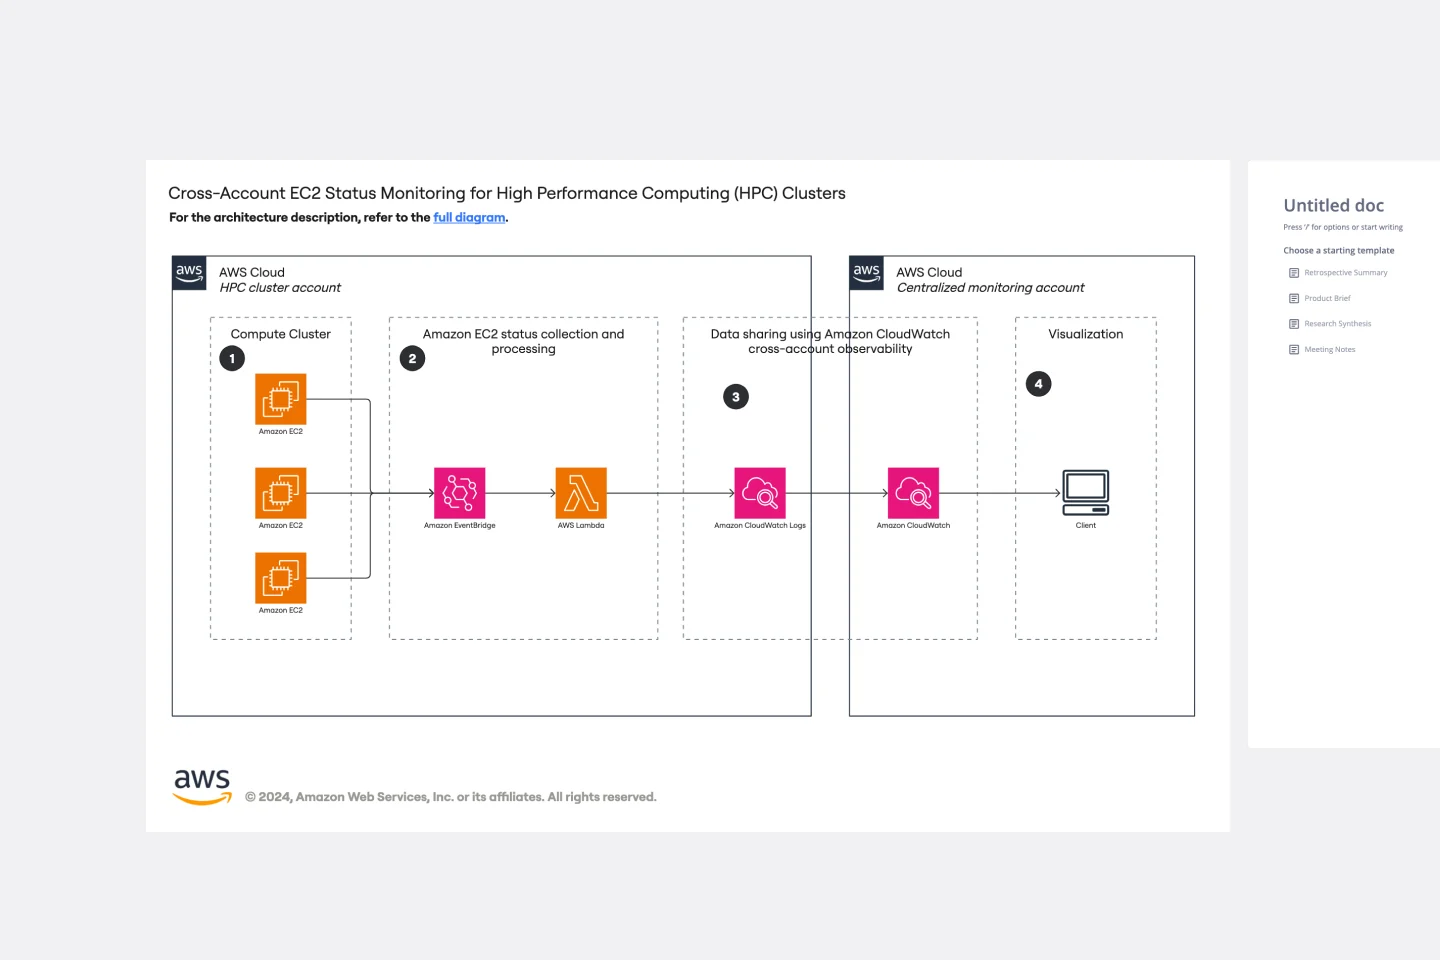
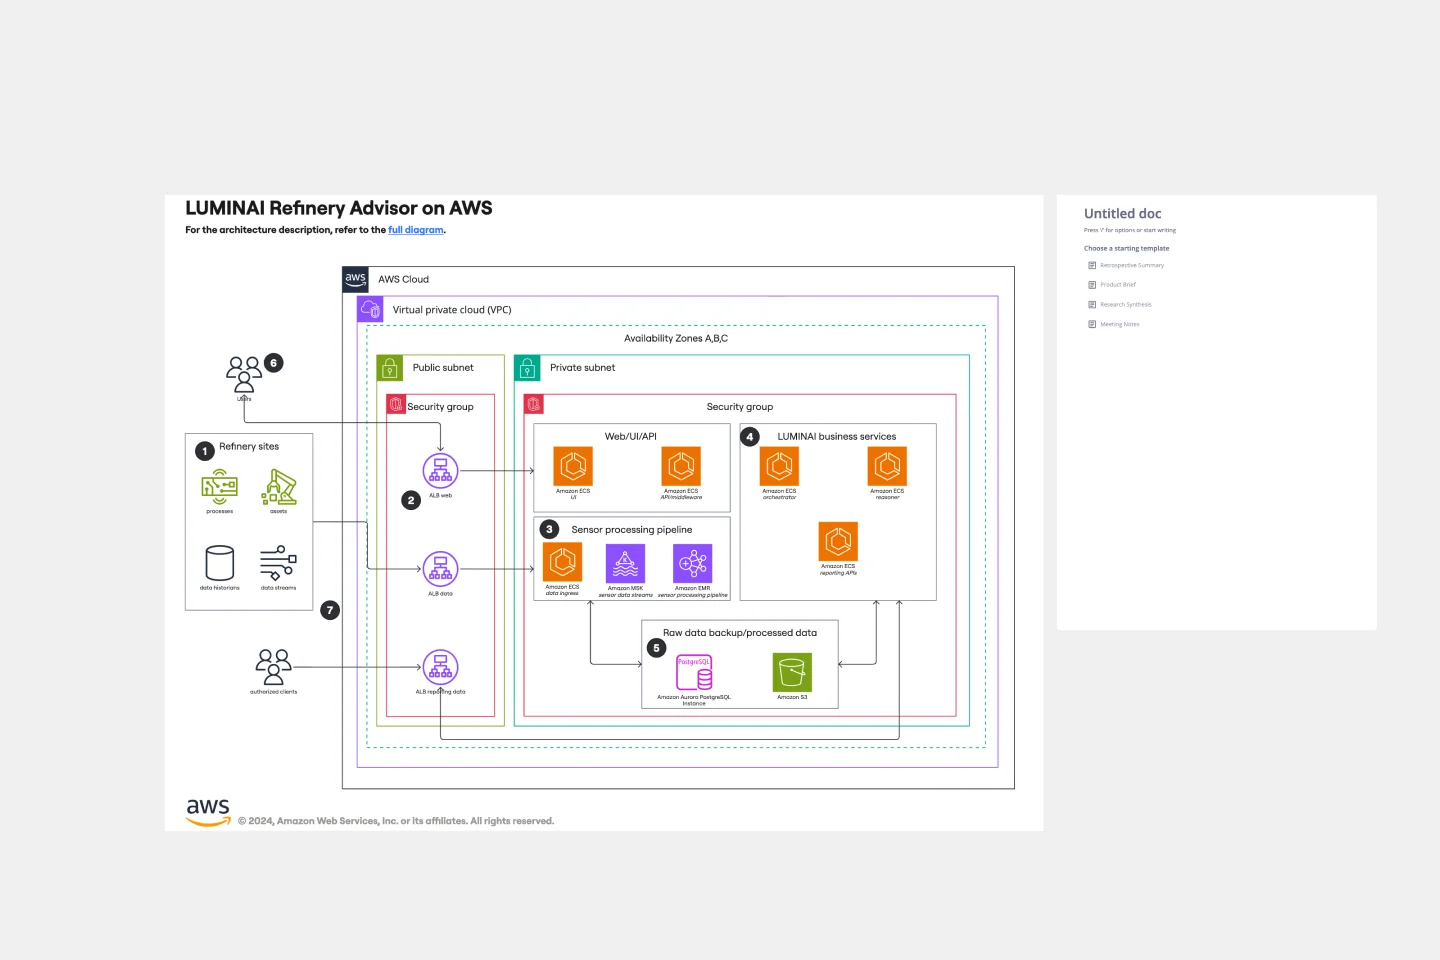
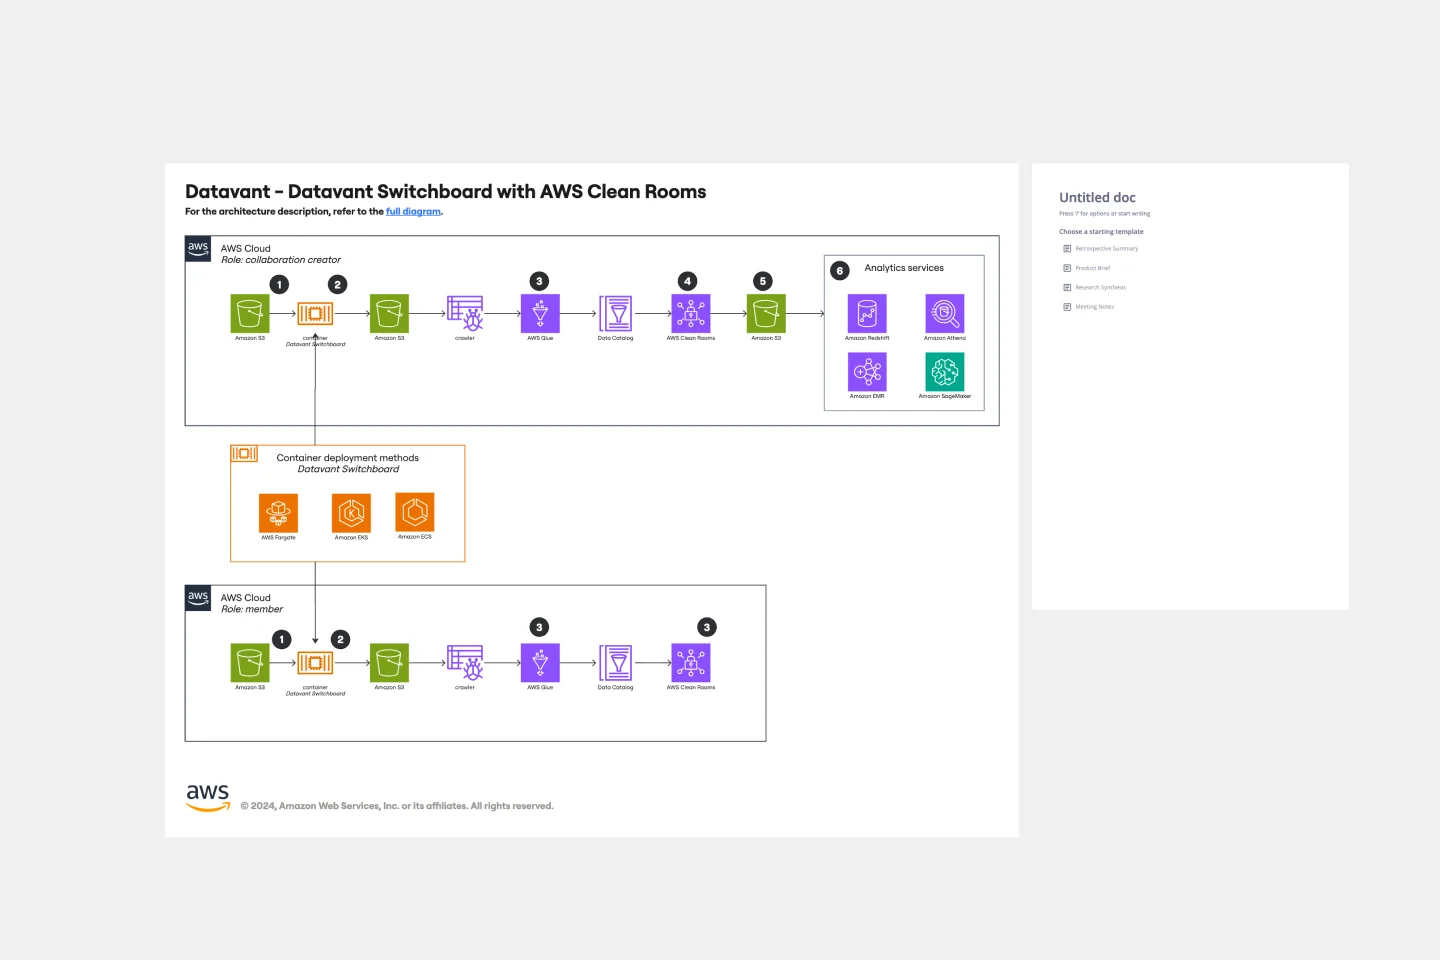
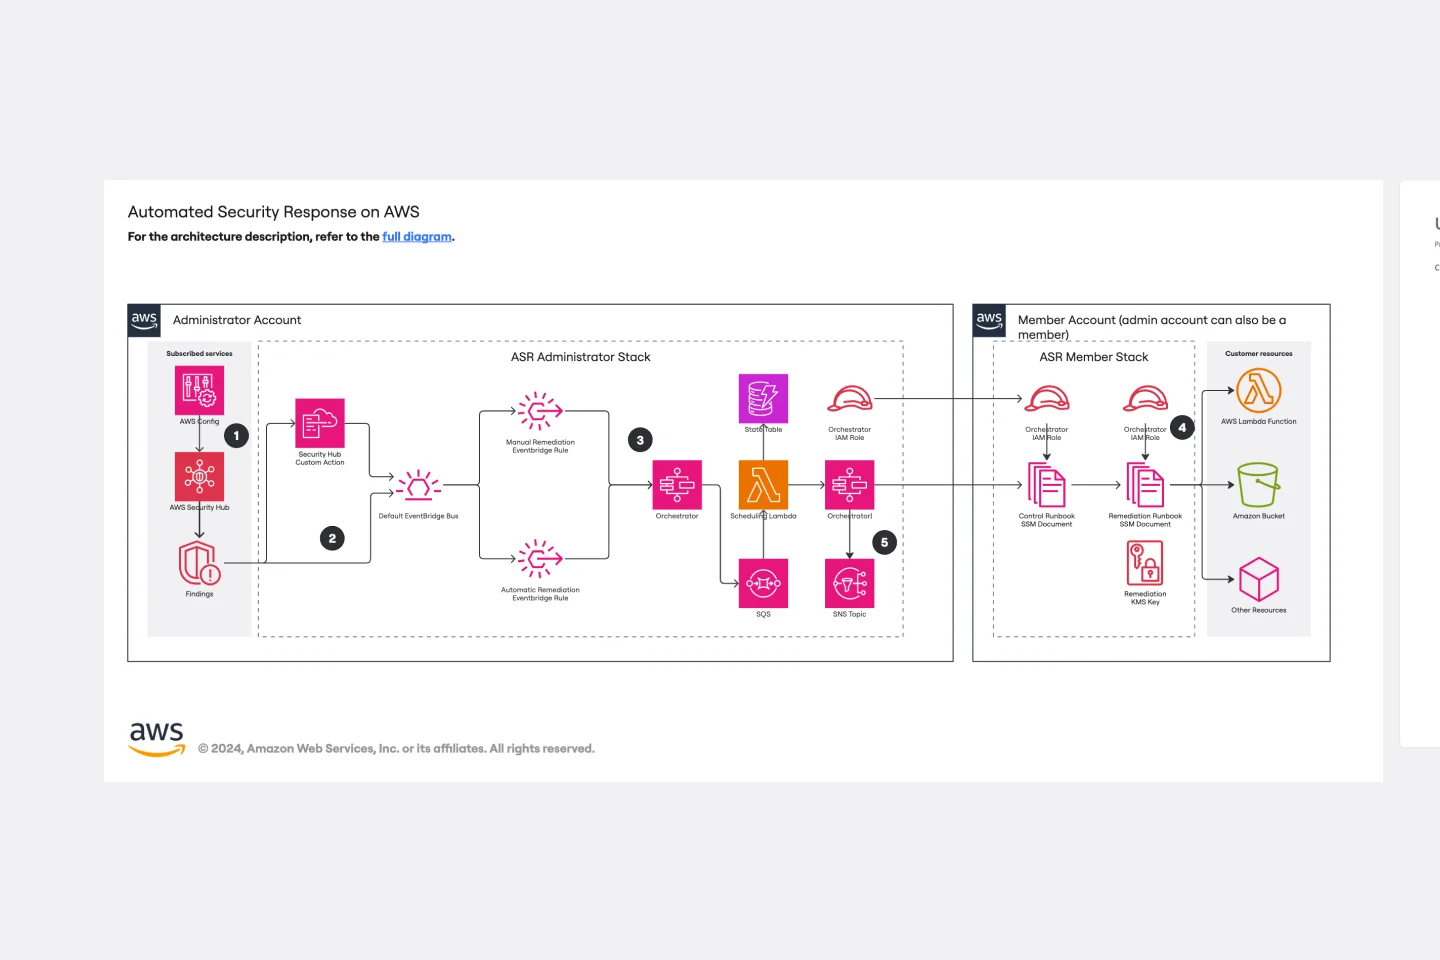
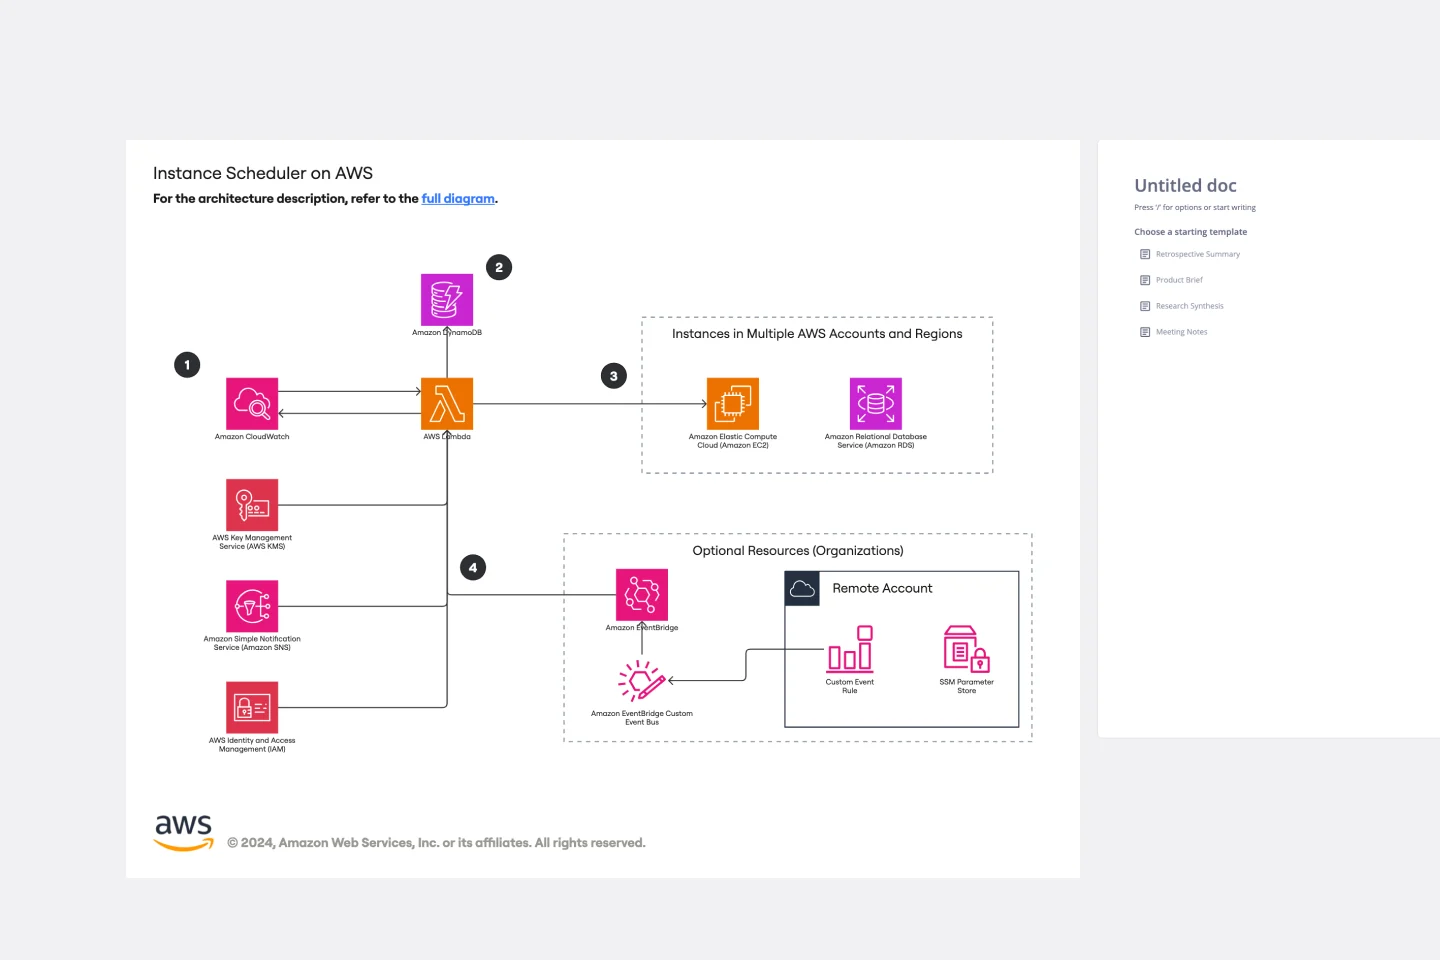
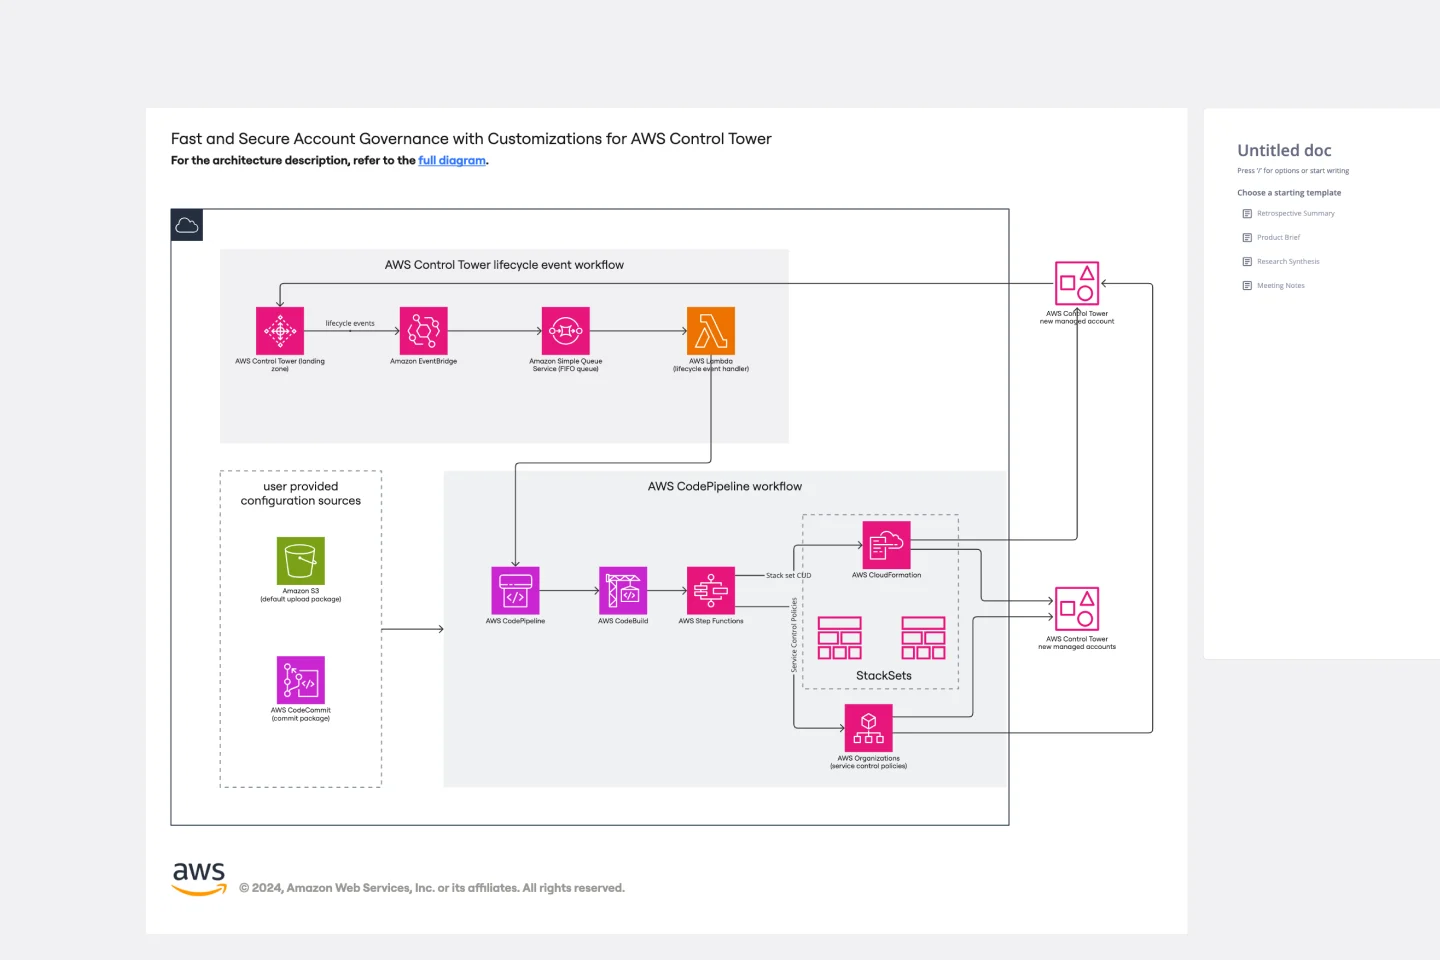
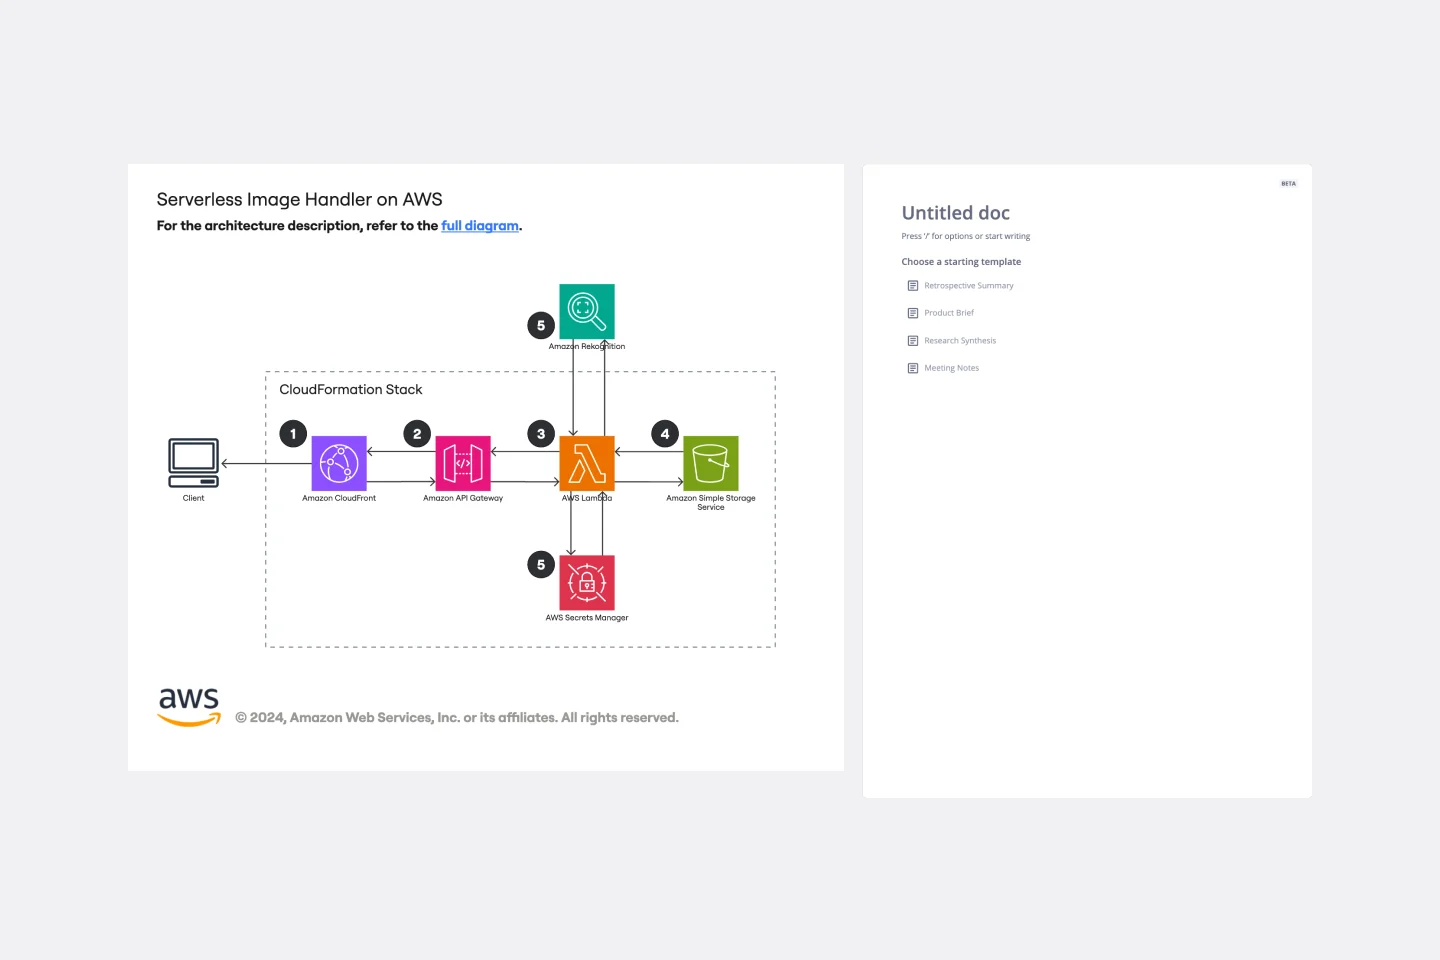
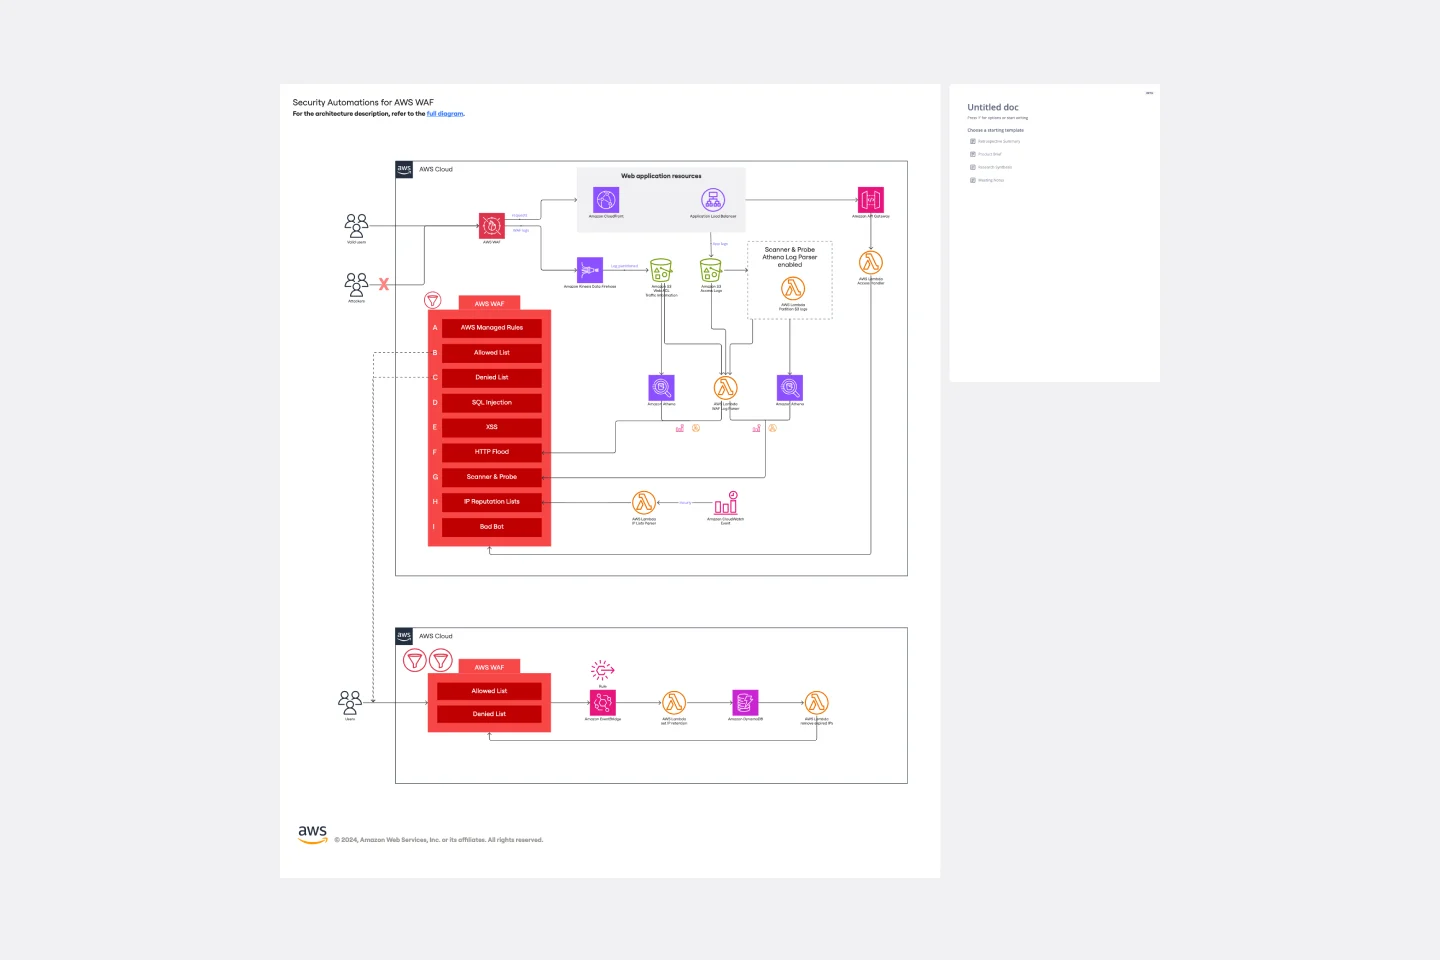
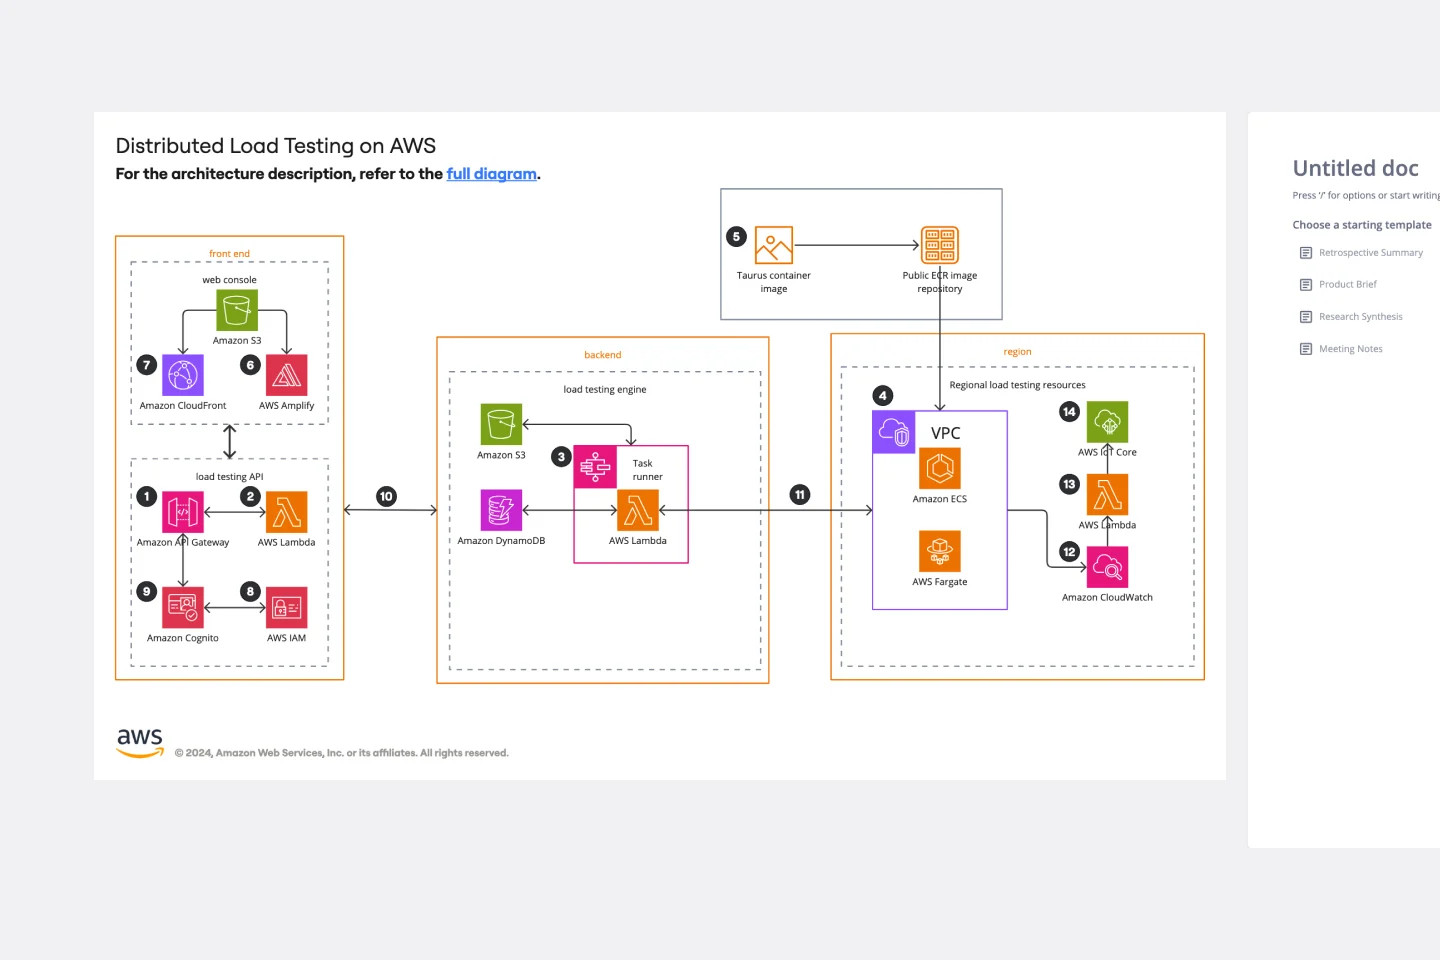
Visualize infrastructure: The template will auto-generate a detailed diagram of your current AWS setup, providing a clear visual representation of your architecture.
Optimize costs: Use the built-in AWS cost calculator to estimate and compare costs across different configurations. This feature supports a wide range of AWS services, ensuring comprehensive cost management.
Performance enhancements: Identify performance bottlenecks and optimize your infrastructure for better reliability and efficiency. The template offers insights and suggestions for performance improvements.
Collaborate and share: Use Miro's collaborative features to share the infrastructure diagrams with your team, gather feedback, and make informed decisions collectively.
Why use the AWS Cloud Infrastructure Optimization Template
Efficiency: Save time by automating the creation of infrastructure diagrams and cost calculations. The template reduces the manual effort required to visualize and optimize your AWS setup.
Cost management: With detailed cost analysis and comparison features, you can gain better control over your cloud spending and make more cost-effective decisions.
Performance optimization: Improve the performance and reliability of your cloud infrastructure by identifying and addressing potential issues.
Collaboration: Enhance team collaboration with Miro's interactive and real-time editing capabilities. Share insights and work together to optimize your cloud environment.
Comprehensive view: Get a holistic view of your AWS infrastructure, making it easier to manage and scale your cloud resources effectively.
The AWS Cloud Infrastructure Optimization Template, as part of Miro's Intelligent Templates, simplifies the complex task of managing cloud infrastructure, making it accessible and efficient for all users.
Get started with this template right now.
Use Case Diagram Template
Works best for:
Marketing, Market Research, Diagrams
A use case diagram is a visual tool that helps you analyze the relationships between personas and use cases. Use case diagrams typically depict the expected behavior of the system: what will happen and when. A use case diagram is helpful because it allows you to design a system from the perspective of the end user. It’s a valuable tool for communicating your desired system behavior in the language of the user, by specifying all externally visible system behavior.
Miro x AWS: Accelerate your cloud journey
Works best for:
Diagramming
The Miro x AWS: Accelerate your cloud journey template offers a visual framework for planning and executing cloud migration and optimization projects using Amazon Web Services (AWS). It provides elements for mapping out cloud architectures, migration strategies, and cost optimization initiatives. This template enables teams to collaborate effectively, align on objectives, and accelerate their cloud journey with AWS services. By promoting collaboration and alignment, the Miro x AWS template empowers organizations to leverage AWS cloud technologies efficiently and achieve their business objectives effectively.
Chat-Bot
Works best for:
Diagramming
The Chat Bot template is a visual tool for designing and mapping out chatbot interactions and functionalities. It provides a structured framework for visualizing conversation flows, user inputs, and bot responses. This template enables teams to collaborate on designing chatbot experiences that are intuitive and user-friendly, driving engagement and satisfaction. By promoting clarity and alignment, the Chat-Bot template empowers organizations to create effective chatbot solutions that meet user needs and business objectives.
Dependency Diagrams Educational Board
Works best for:
Diagramming
The Dependency Diagrams Educational Board template provides a visual tool for teaching and learning about dependency relationships between components in systems. It offers a structured framework for illustrating dependencies, connections, and interactions within a system or process. This template enables educators to explain complex concepts effectively and engage learners in interactive activities. By promoting visual learning and understanding of dependencies, Dependency Diagrams empower students to grasp fundamental principles of systems thinking and analysis.
4-Circle Venn Diagram Template
Works best for:
Diagramming, Mapping, Brainstorming
The 4-Circle Venn Diagram Template has an easy, interactive, and dynamic way to visualize complex relationships between data sets. Empower your team's collaboration and communication with this powerful tool.
OutSystems Architecture Diagram
Works best for:
Diagramming
The OutSystems Architecture Diagram template offers a visual tool for designing and documenting software architectures using the OutSystems platform. It provides elements for modeling application components, data structures, and integration points. This template enables teams to visualize and communicate the architecture of their OutSystems applications, facilitating collaboration and alignment among developers and stakeholders. By promoting clarity and understanding of system architecture, the OutSystems Architecture Diagram empowers teams to build scalable, maintainable, and high-performance applications effectively.