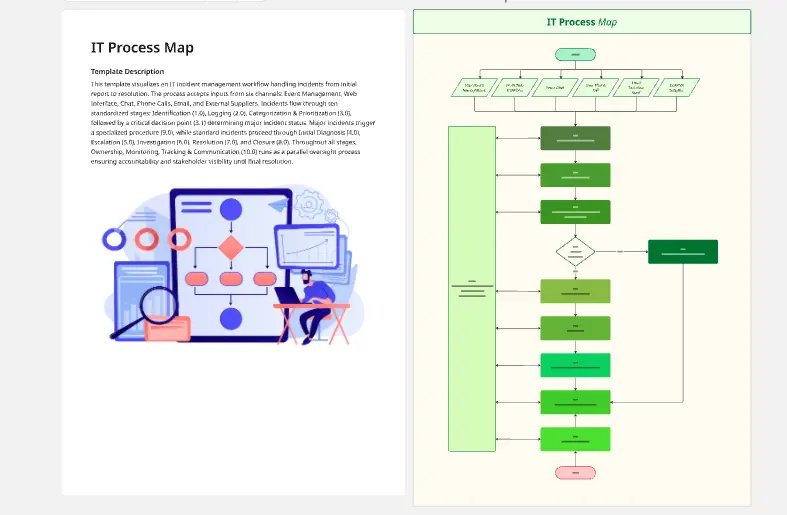
About the Process Map Templates
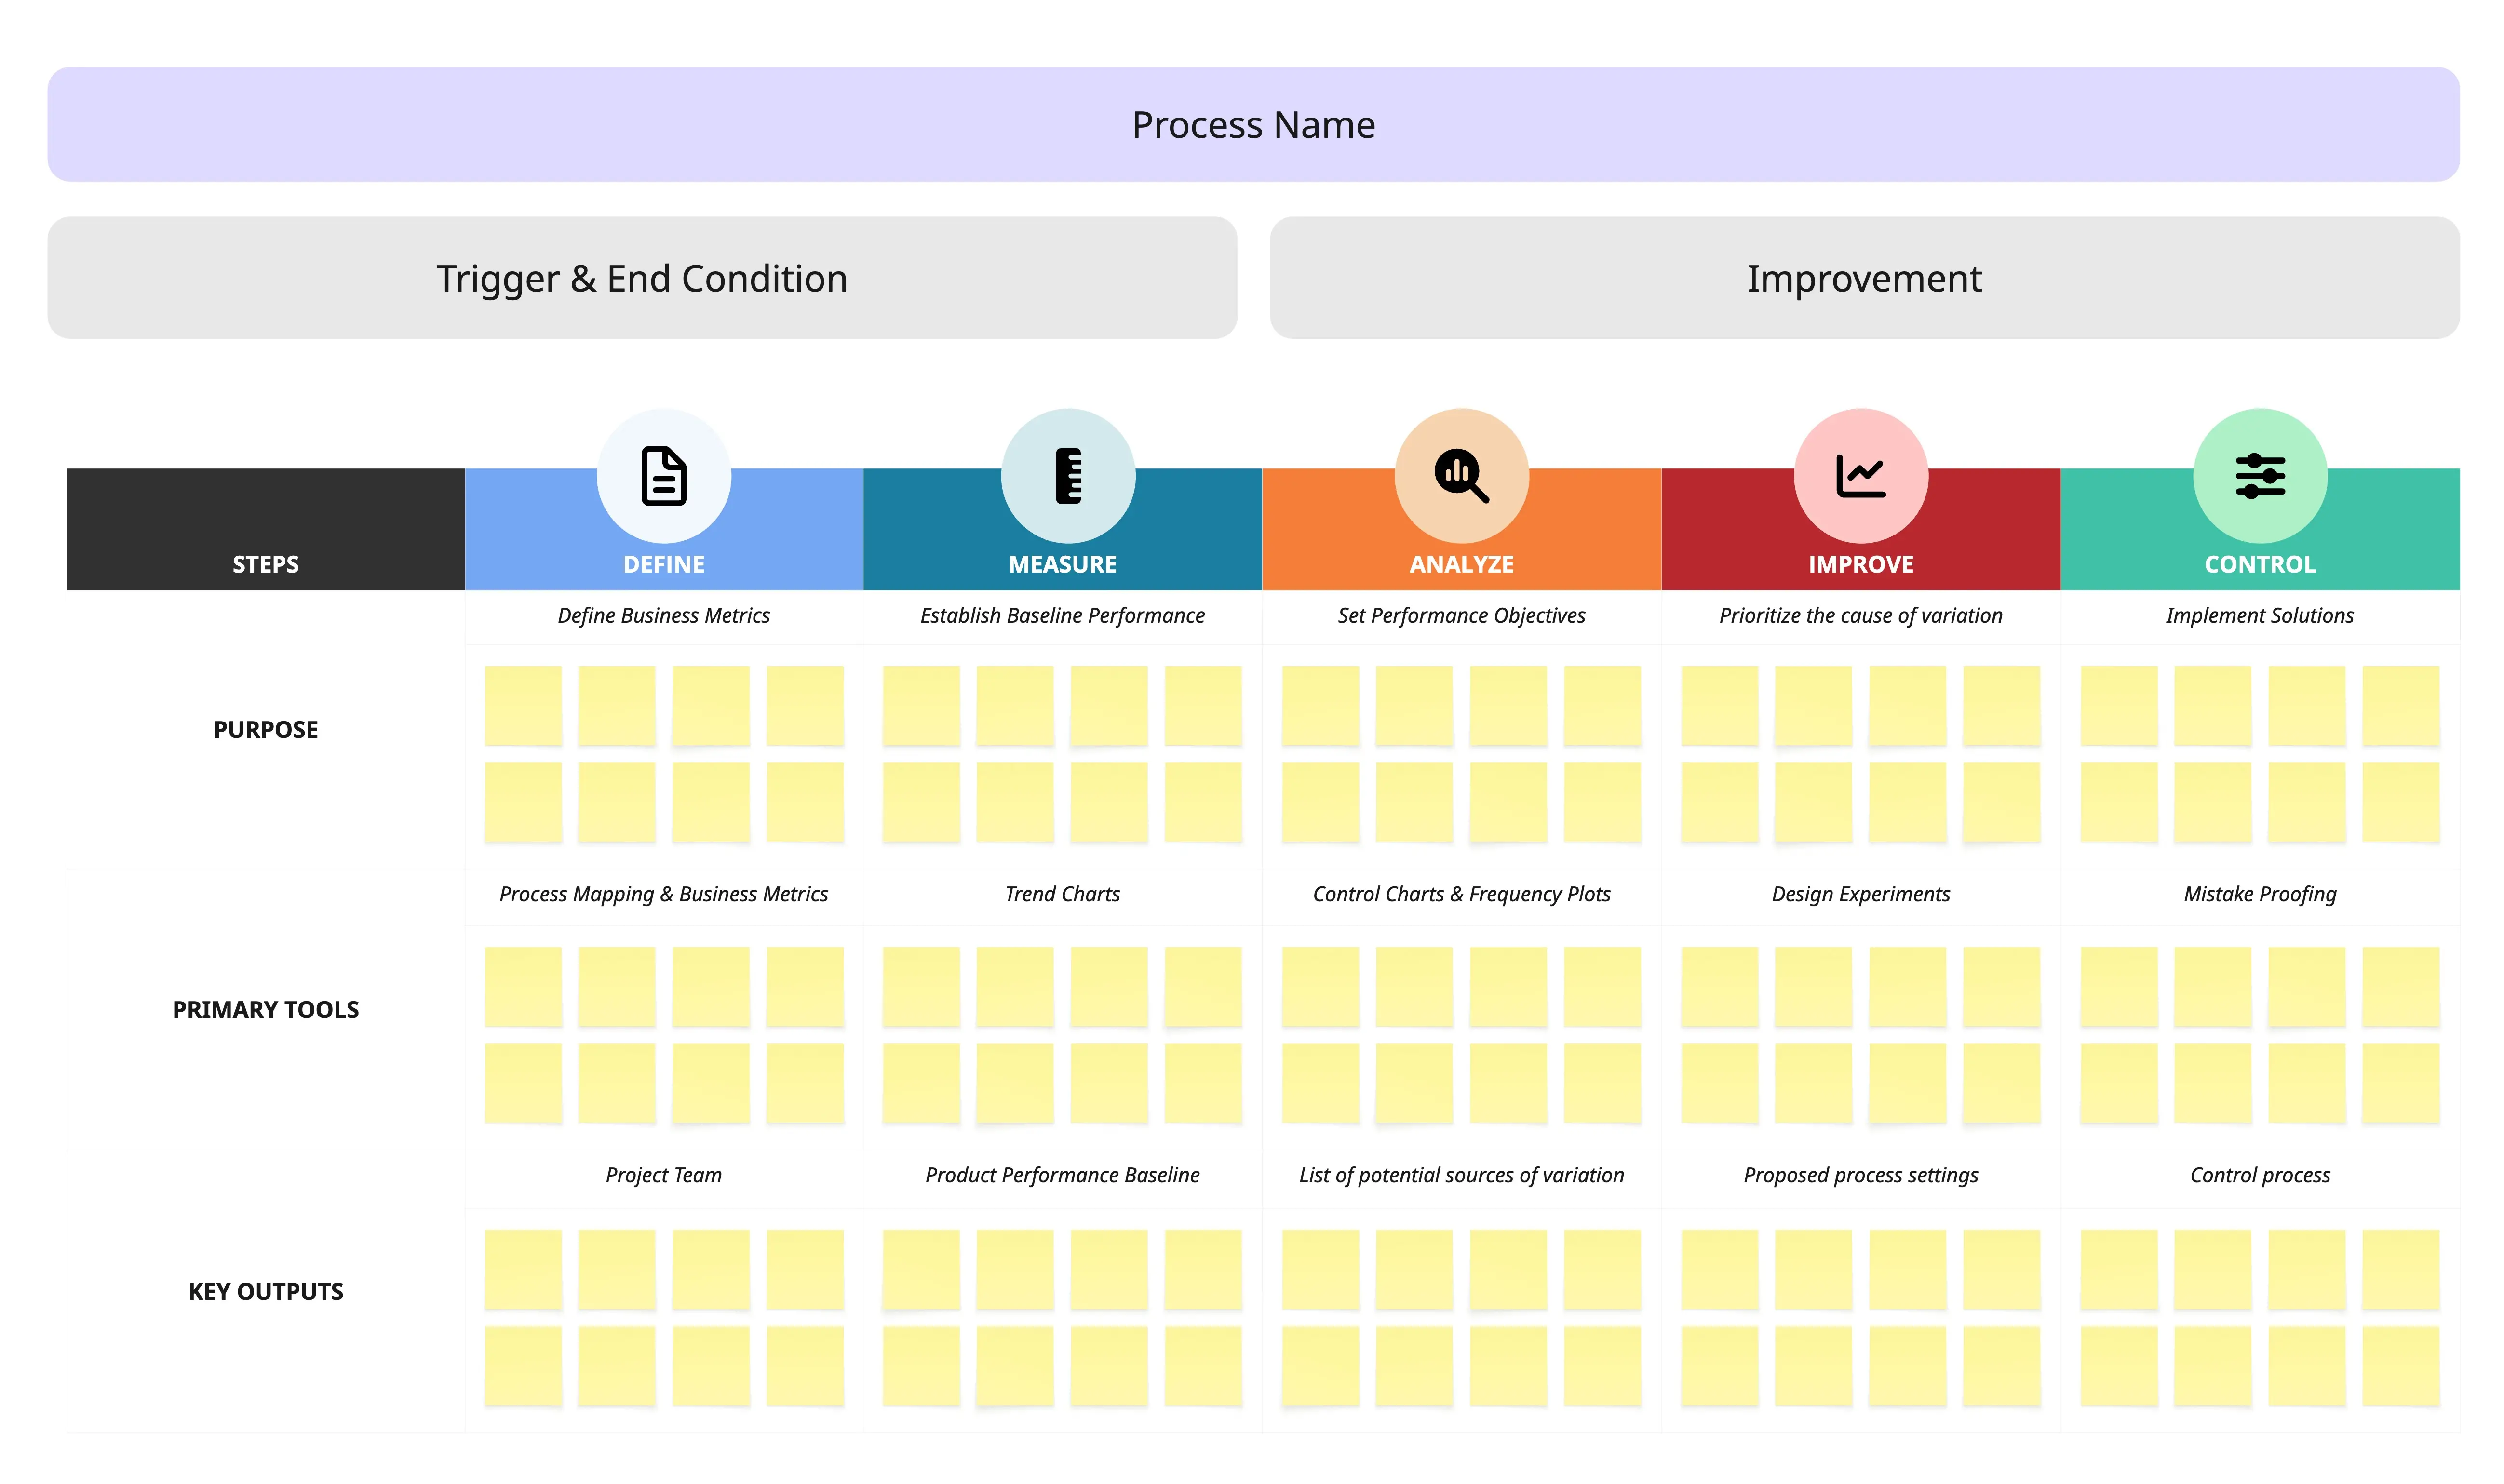
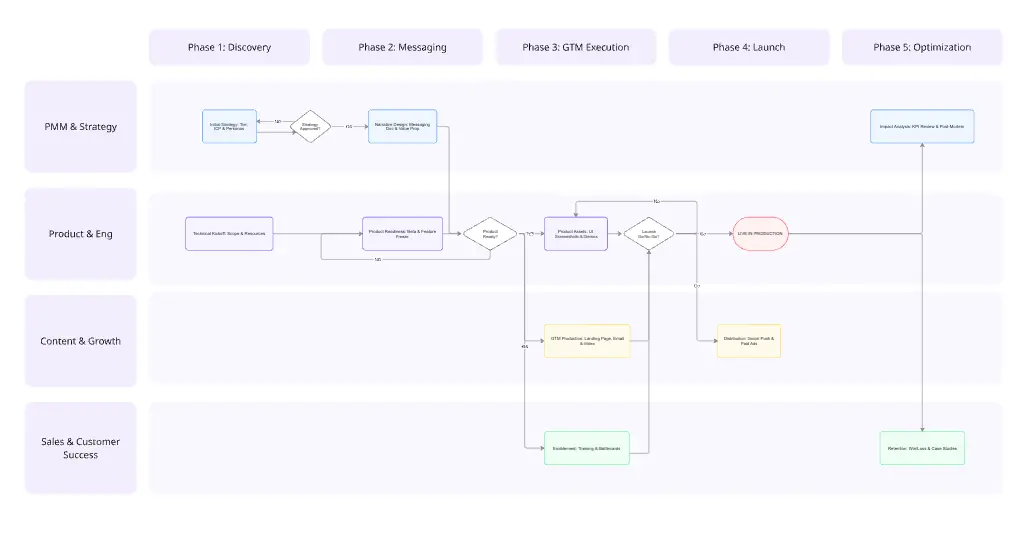
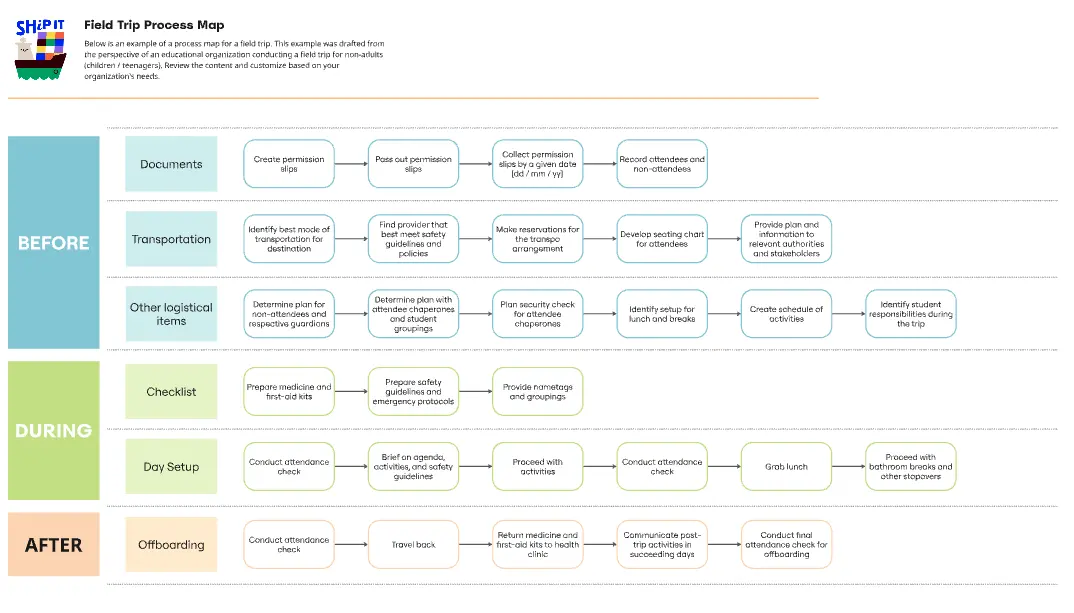
A process map template is valuable to document, analyze, and better understand your team’s business processes and associated outcomes. This process map template is organized by stages to help you record the objectives, activities, and deliverables during each step of a process. Use the template to improve your team’s organization, productivity, and communication by coming to a shared understanding of any kind of process.
What is the purpose of process mapping?
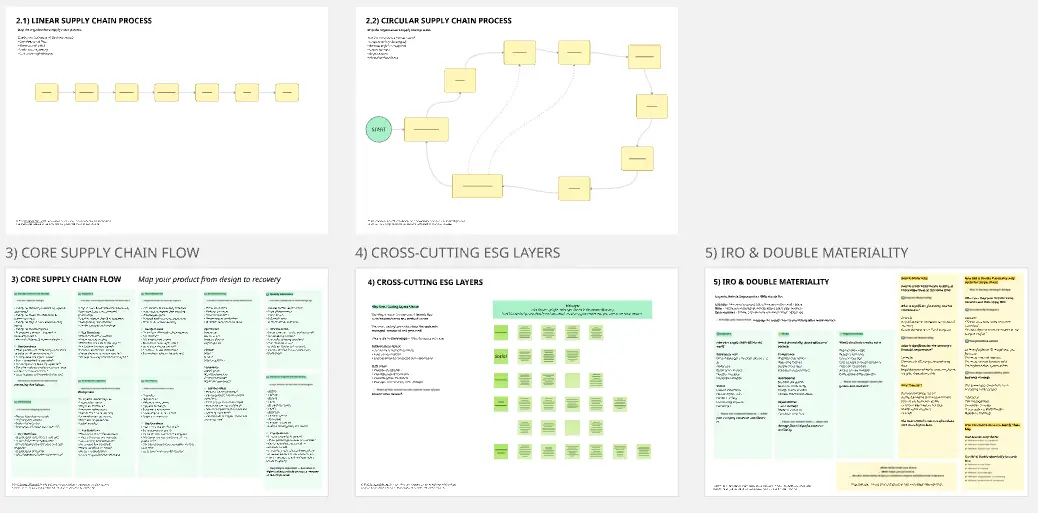
You would never think about setting out into the unknown without a map. A process map is no different. Process mapping is an effective exercise to assess, document, or strategize around any plan or approach your team might have. By breaking down the objectives, activities, and deliverables at any stage of a project, you can gain insight into whether you are on track or effectively working through a problem.
When to use the process mapping template
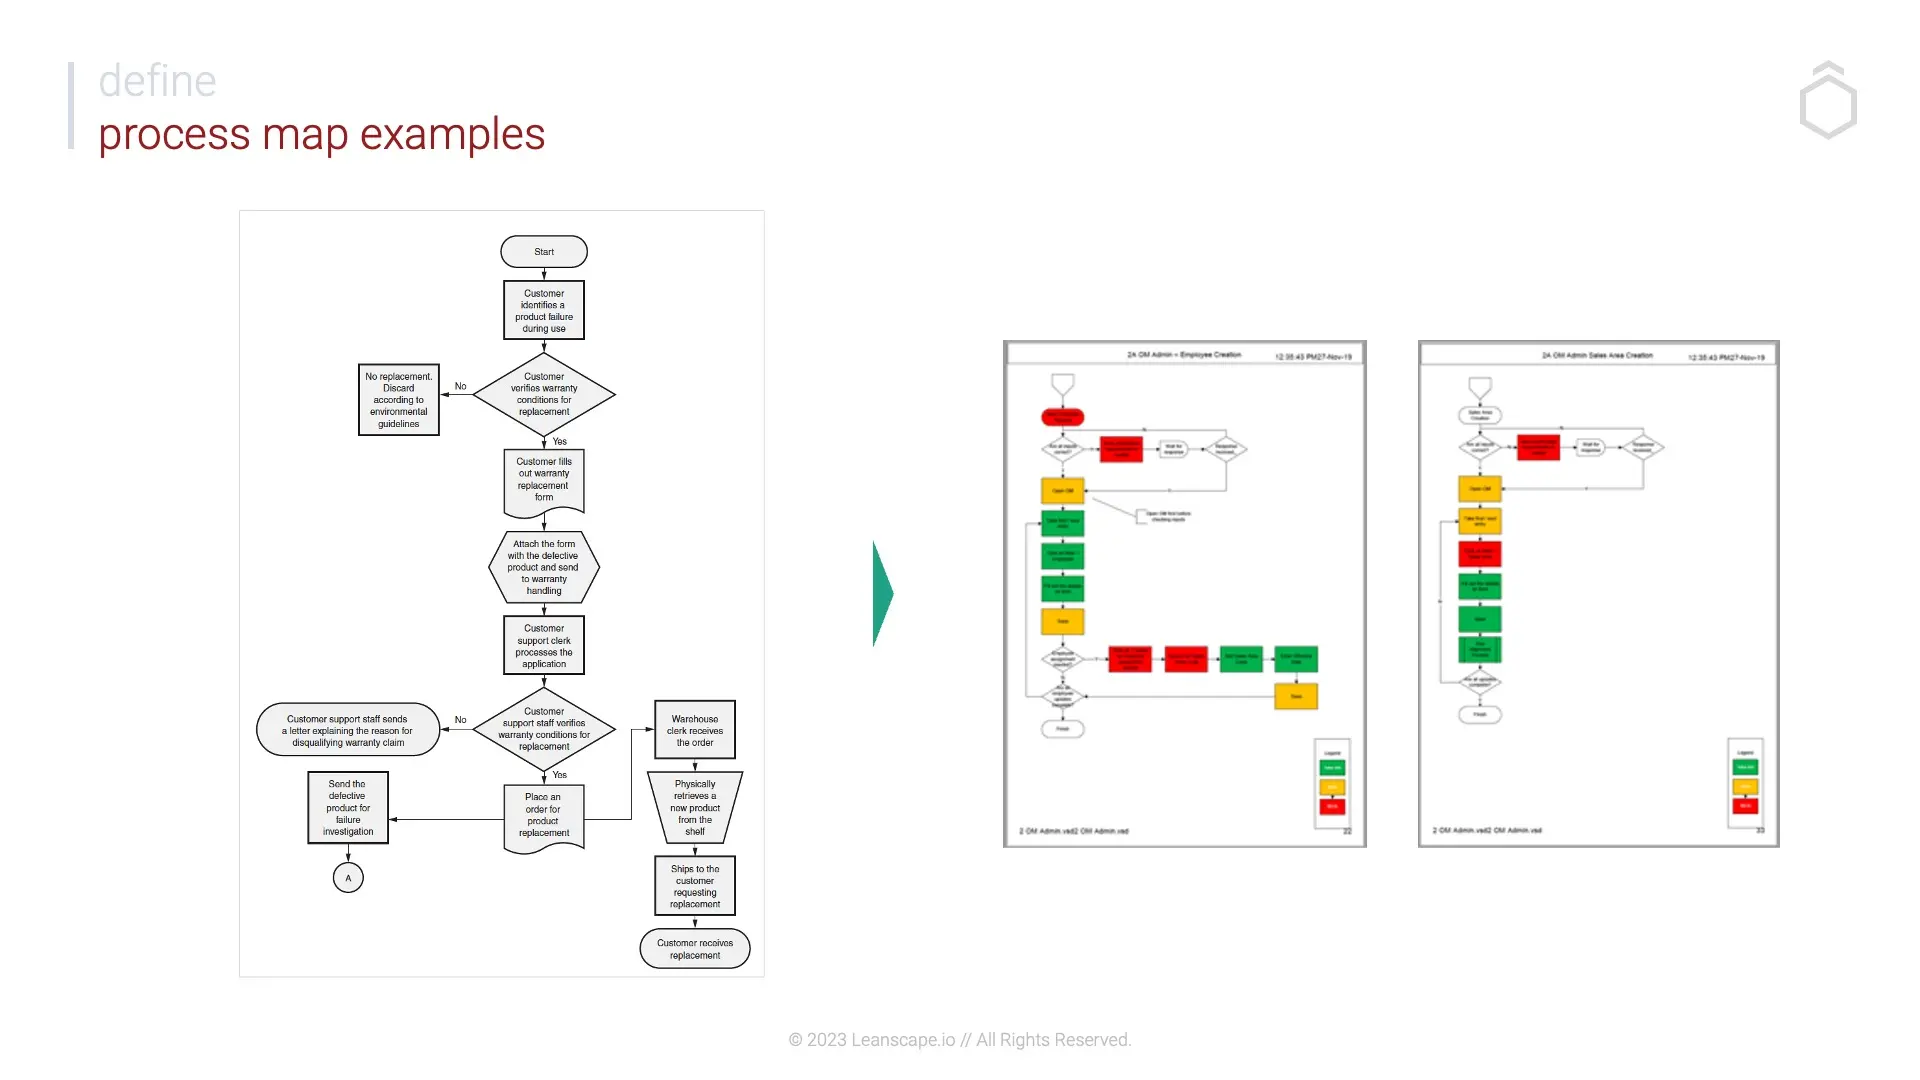
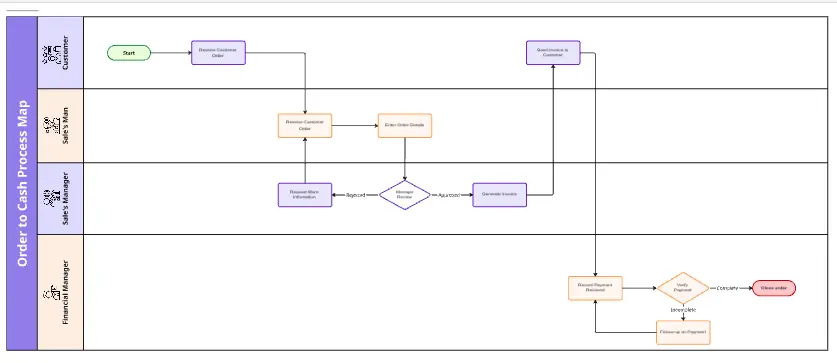
These process map examples are set up to help teams increase efficiency. By seeing a process laid out on the page, teams can identify areas for improvement: how to streamline the process, improve communication, and create better documentation. Use process mapping tools when you need to assign stakeholders, define ownership and boundaries, clarify responsibilities, and establish metrics.
How to use the process map templates
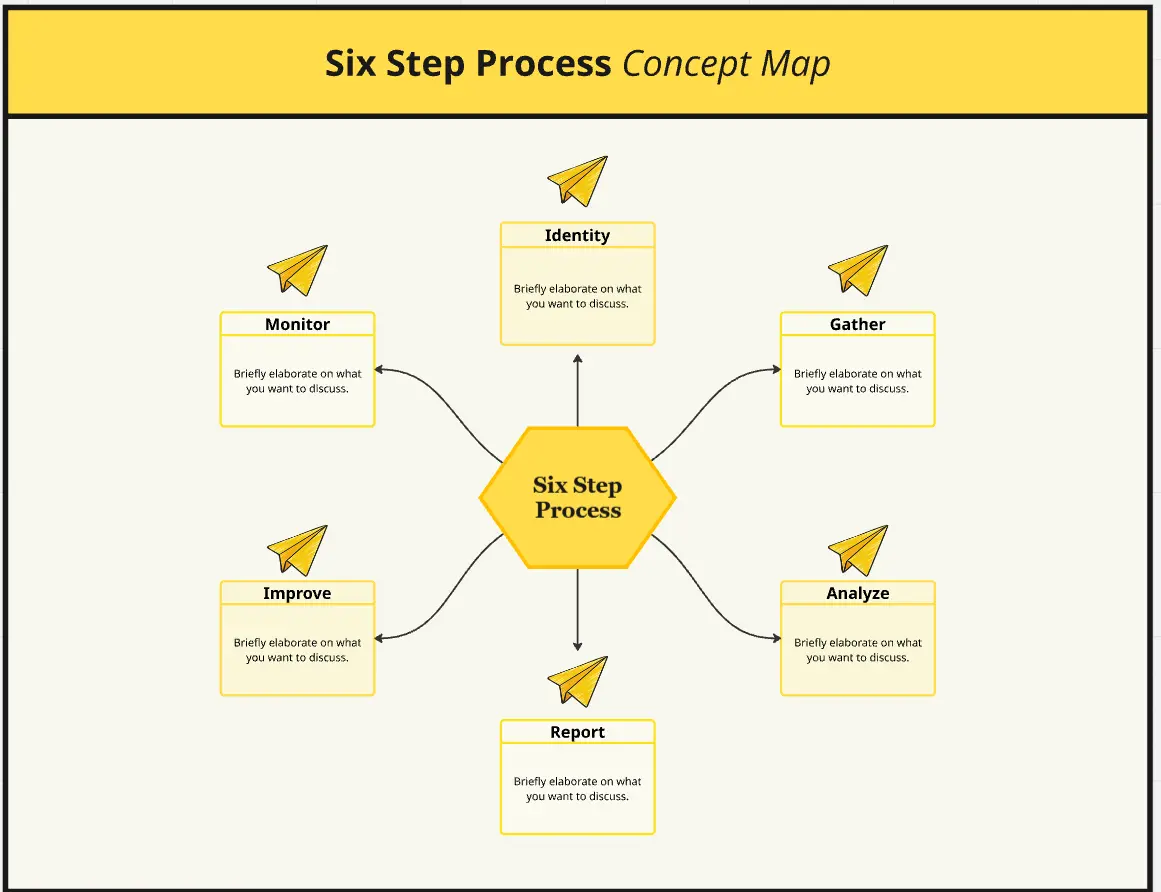
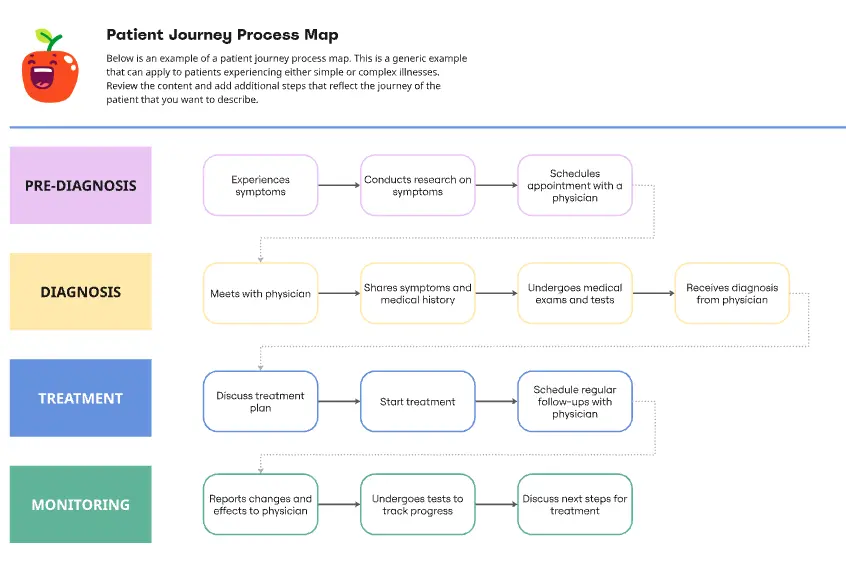
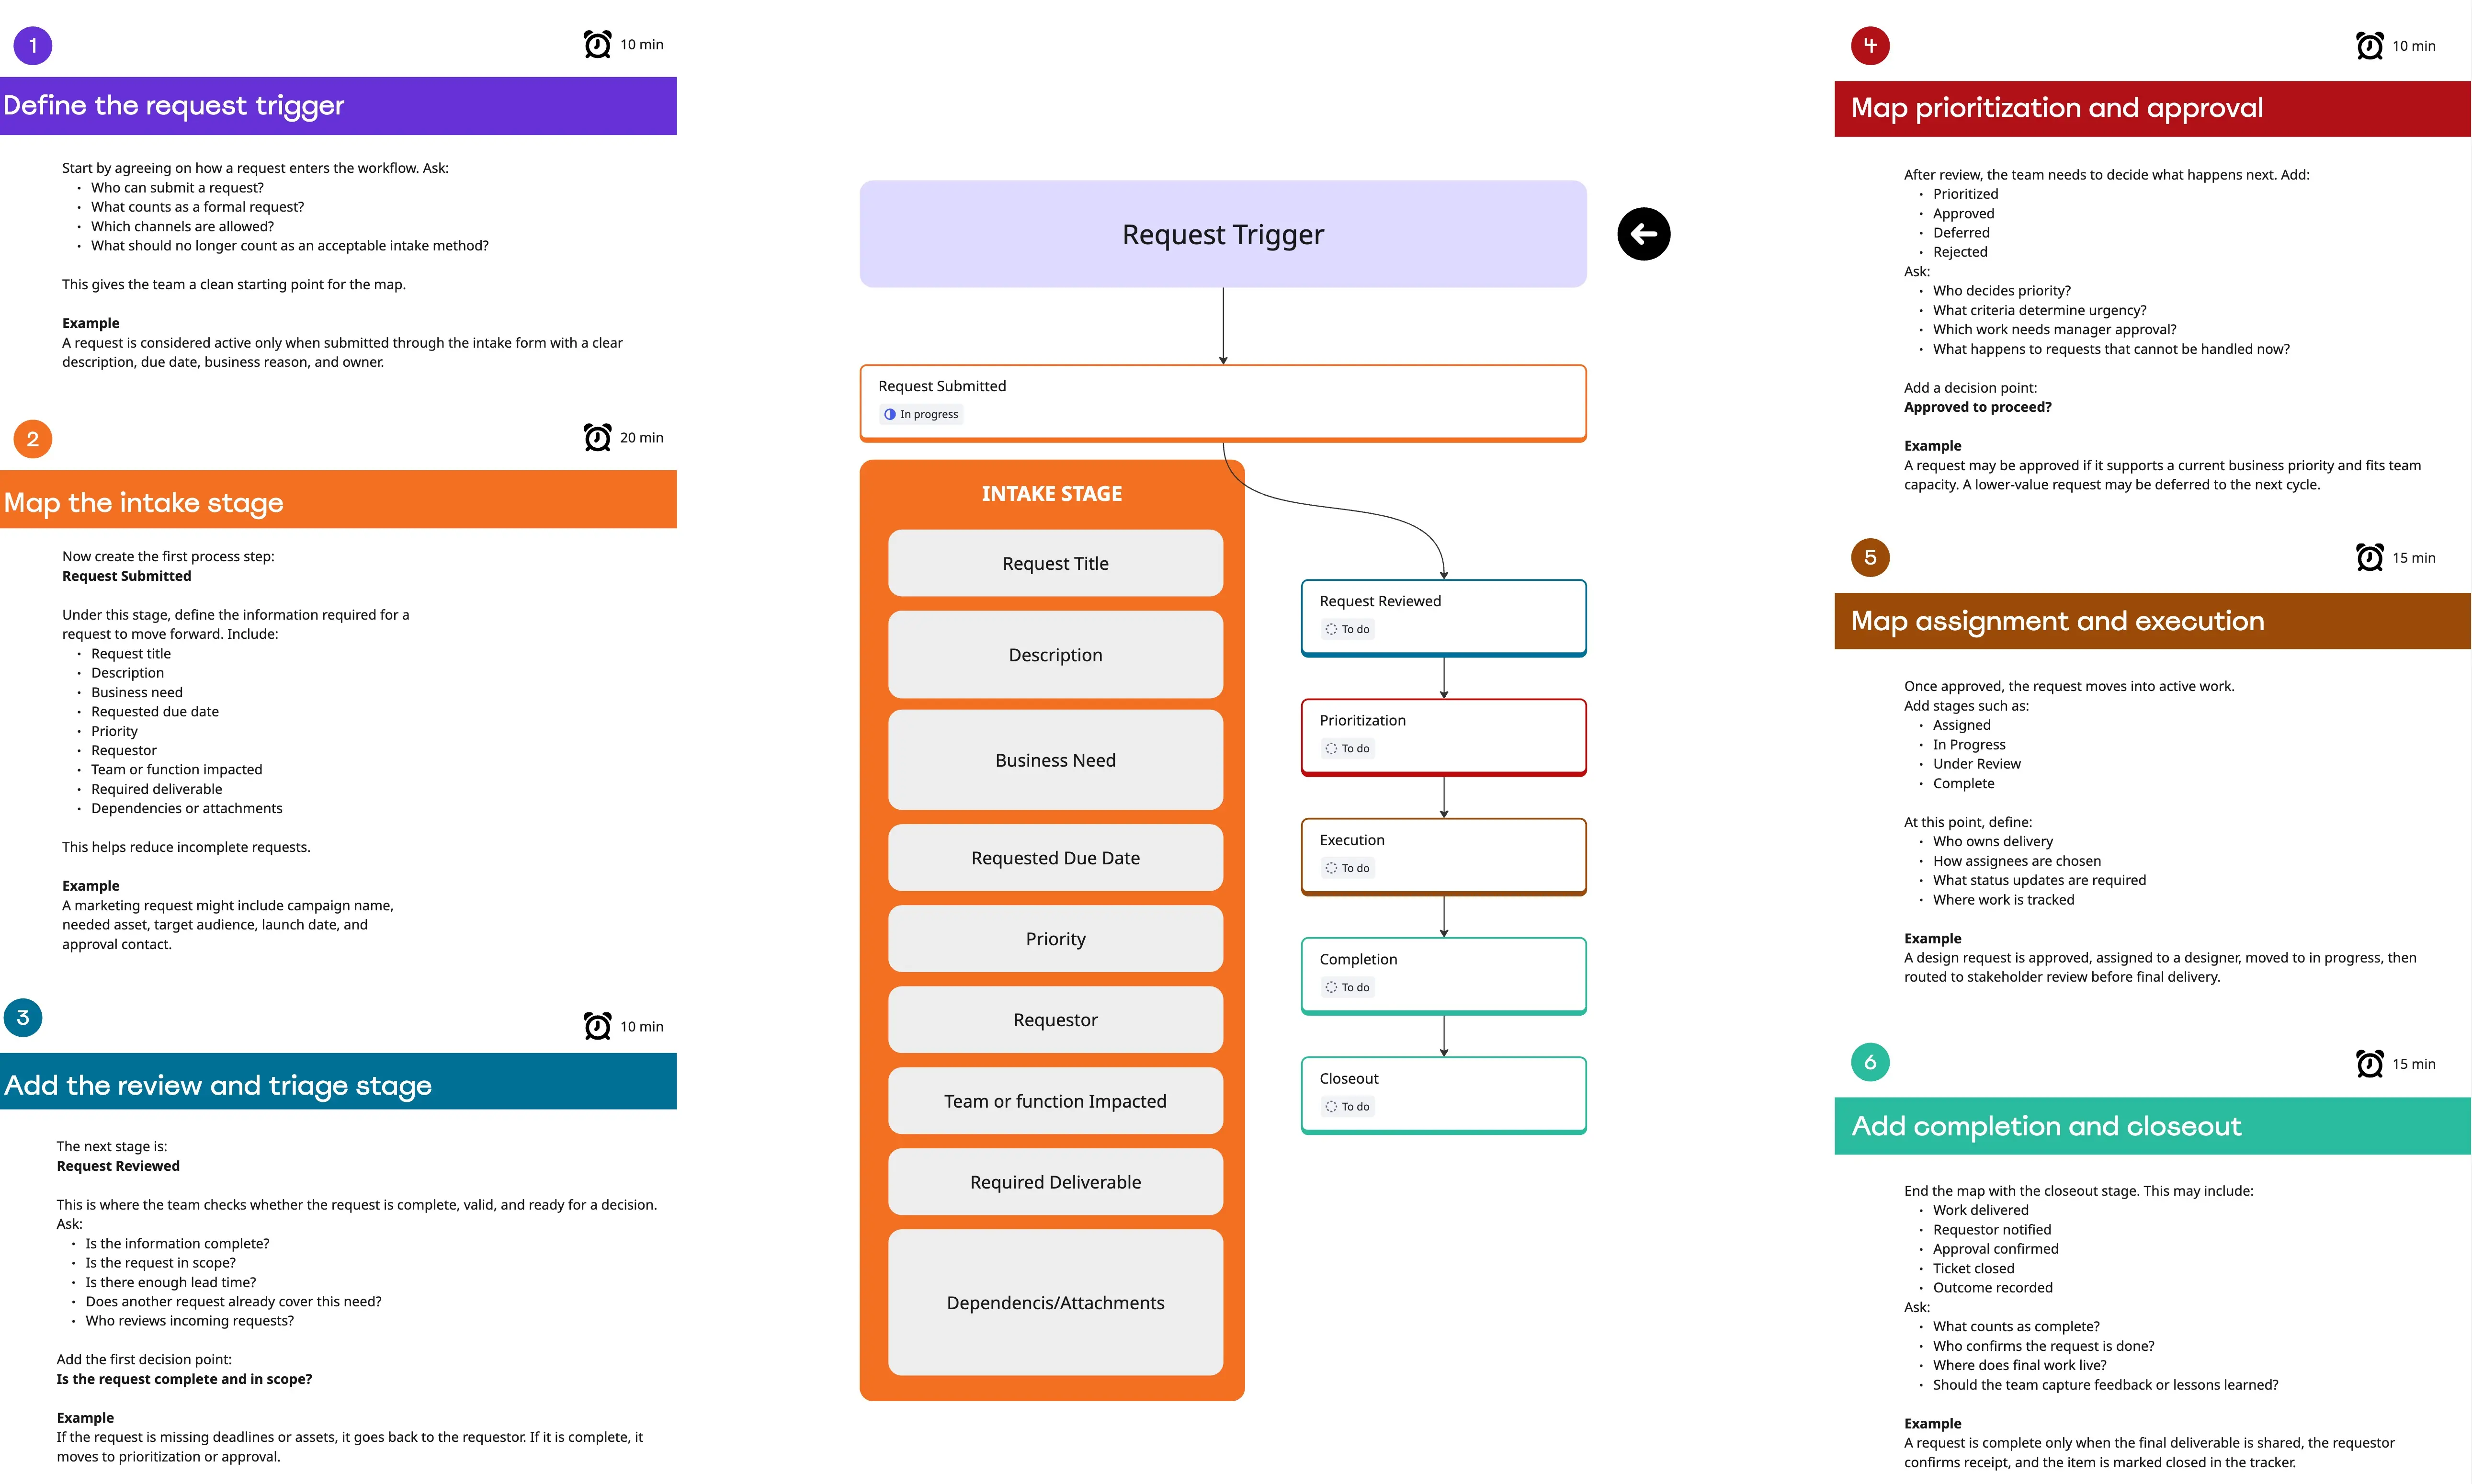
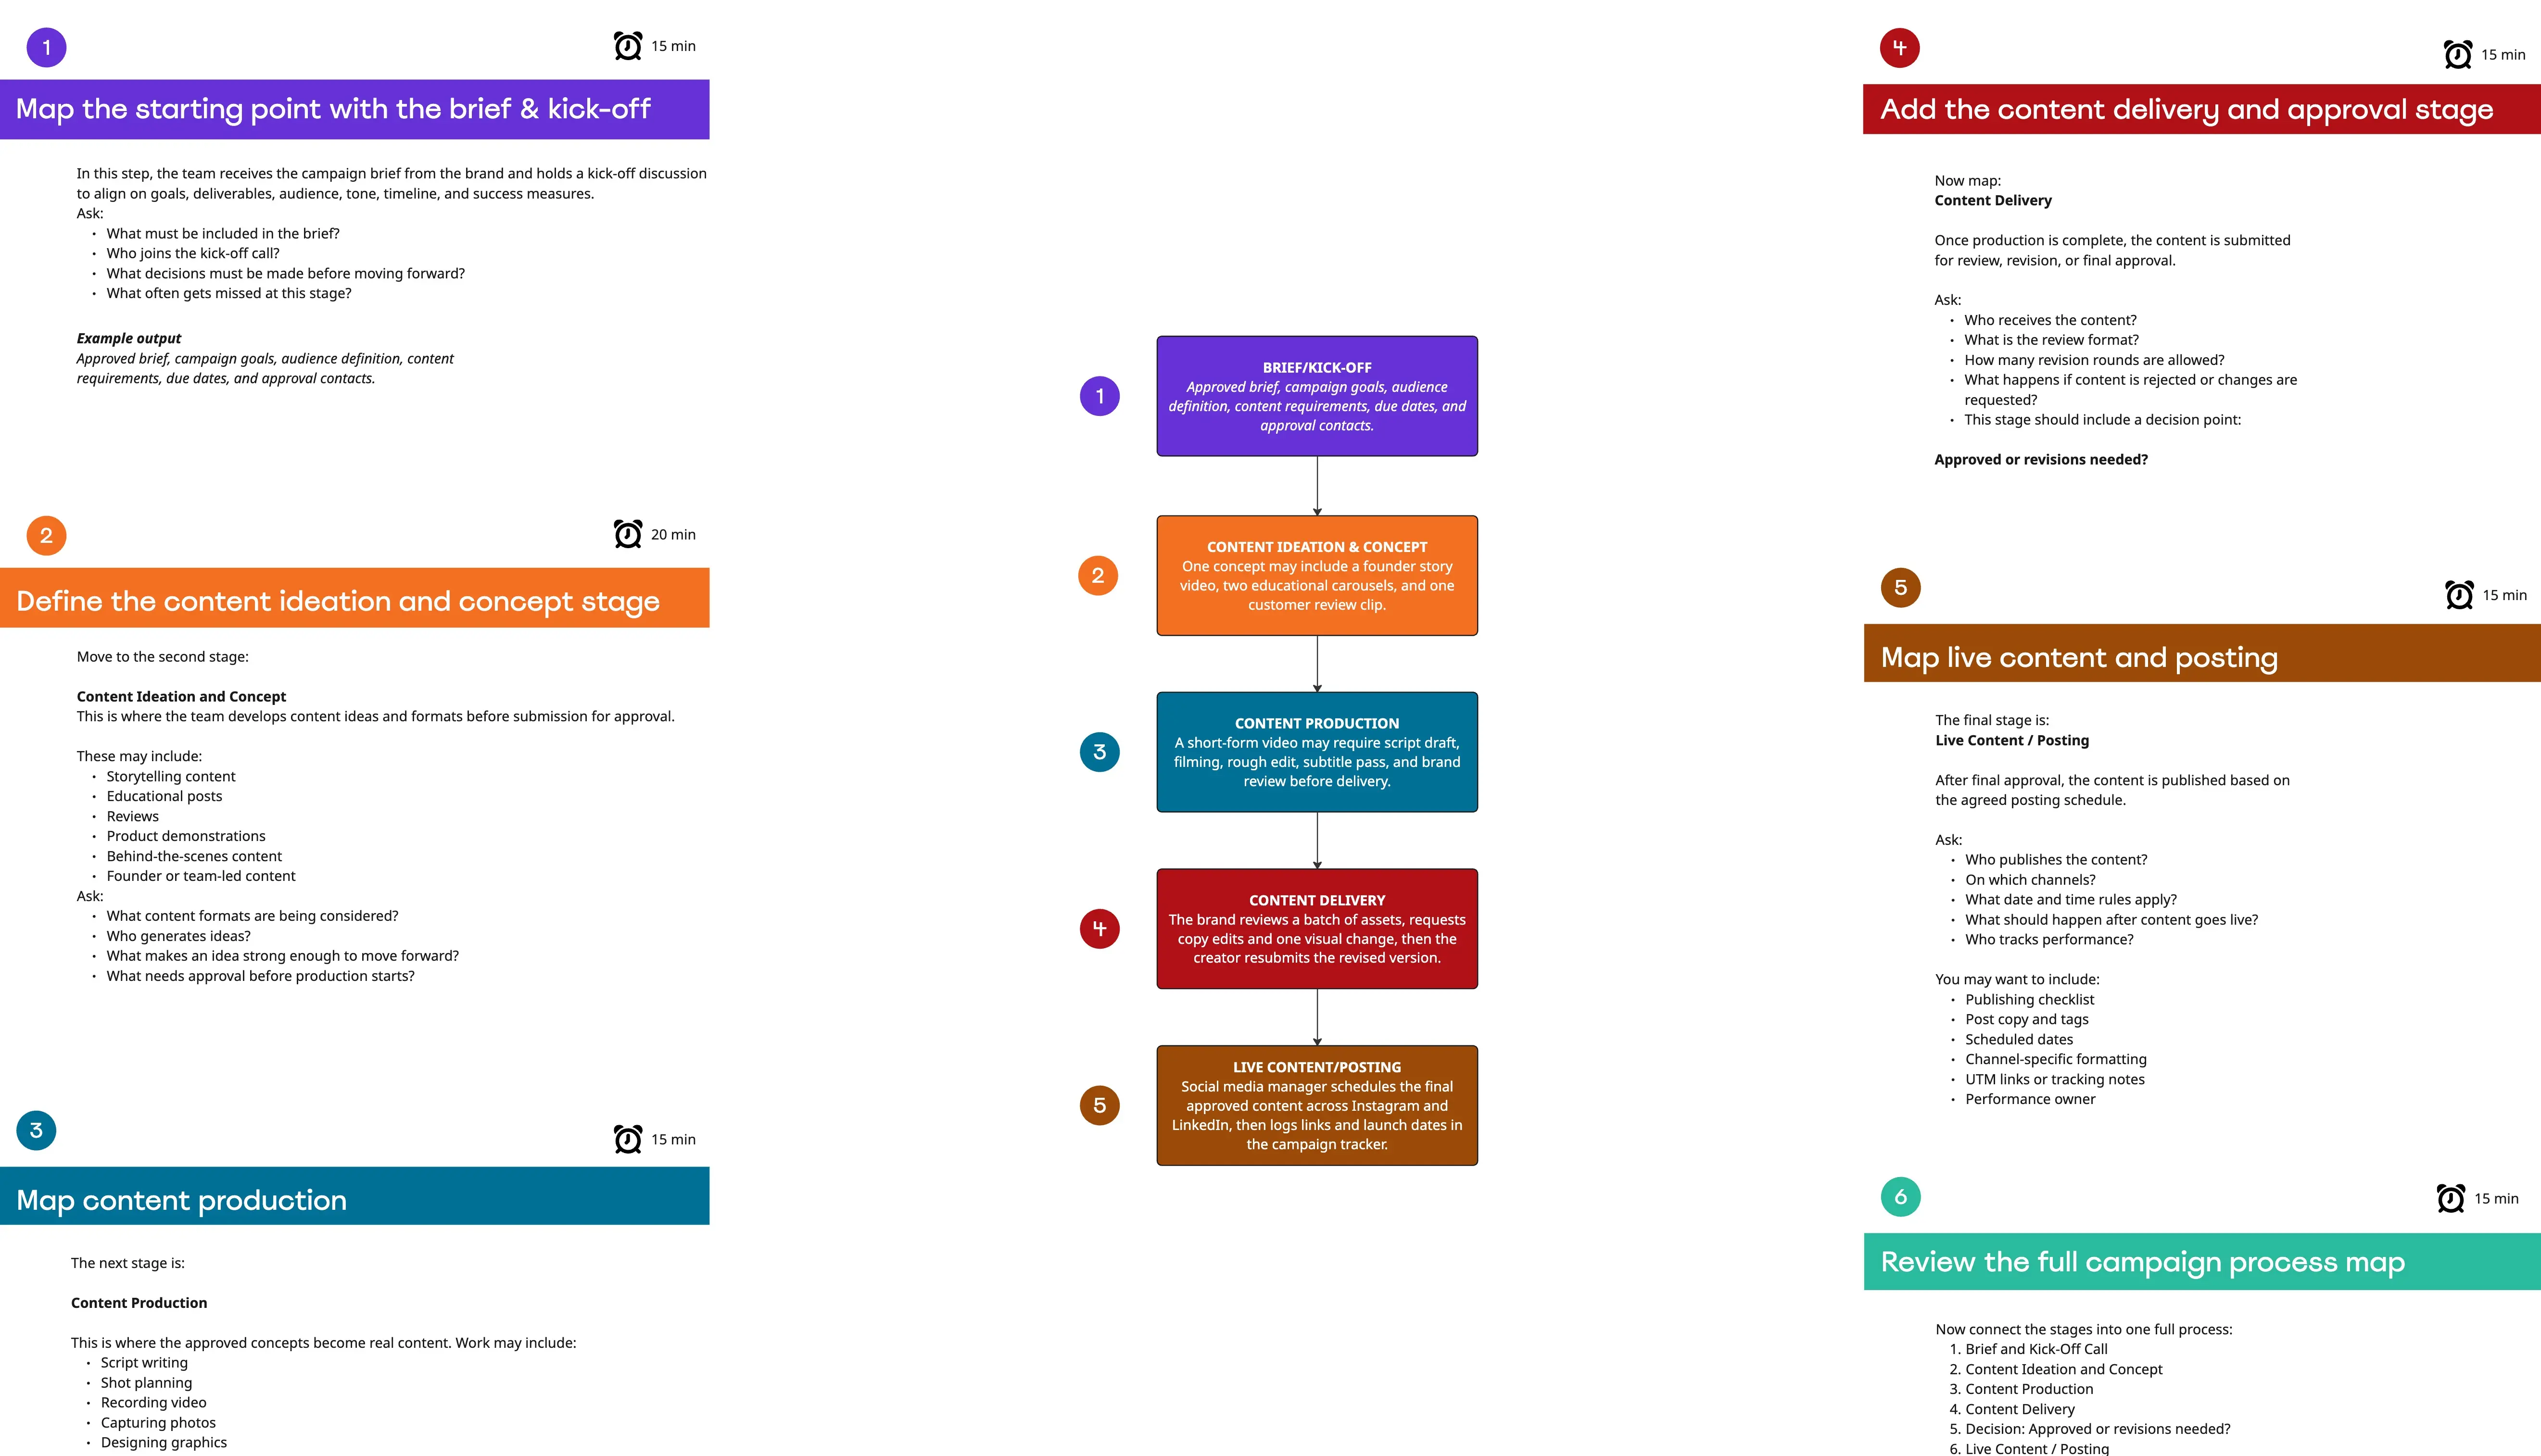
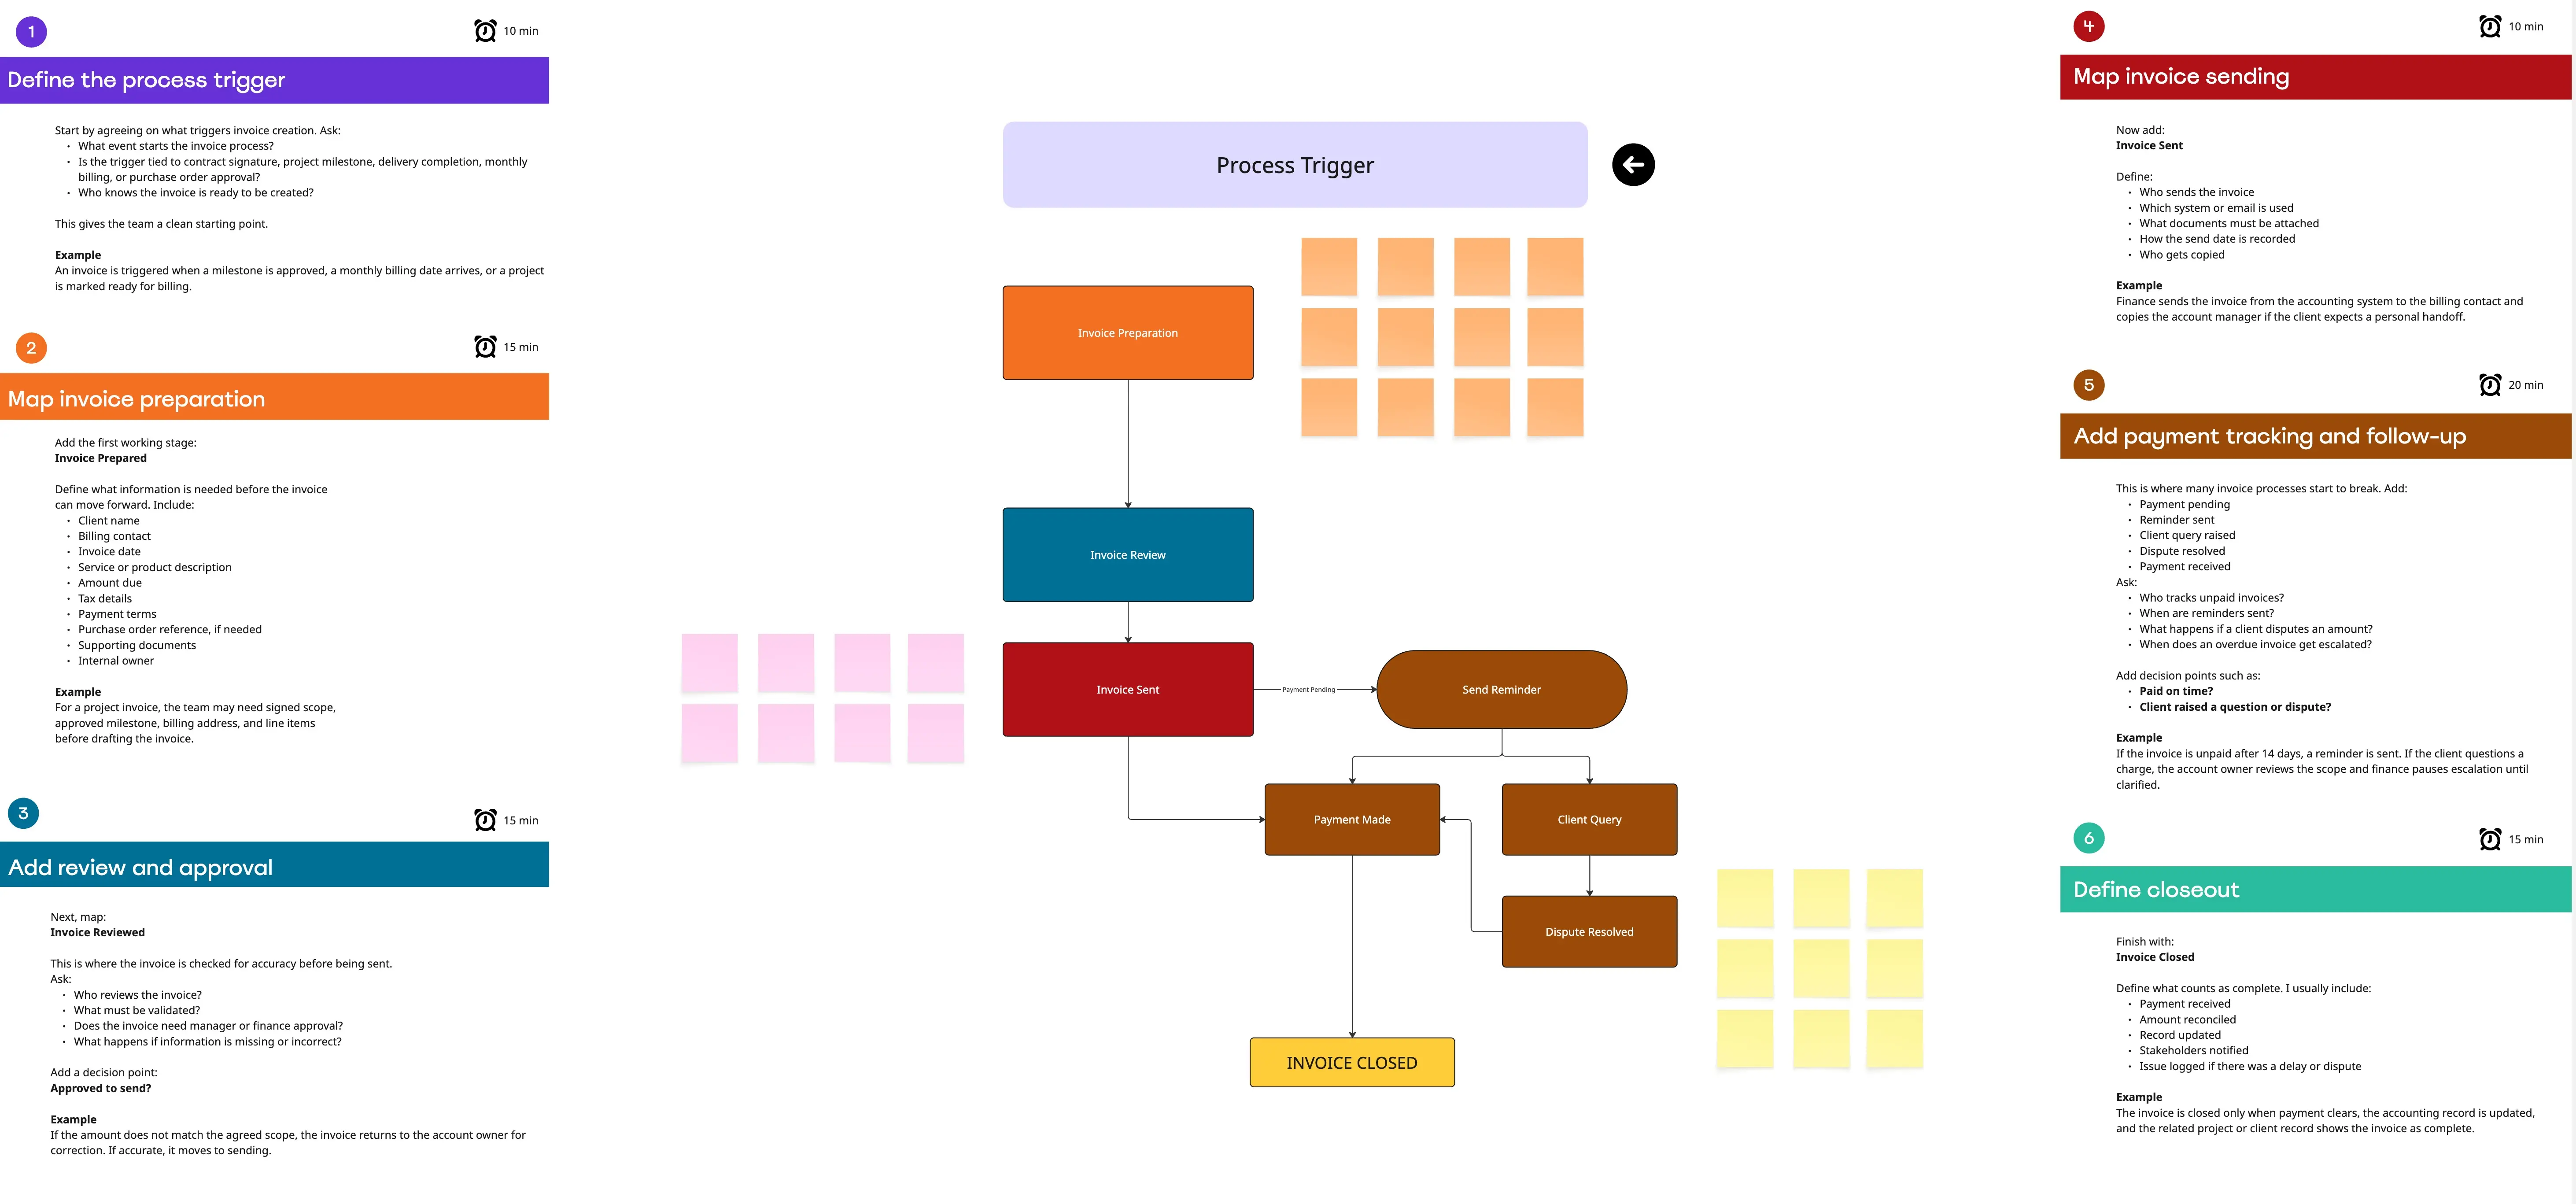
The goal of process mapping is to break down your project so that your teammates understand your objectives and how you plan to achieve them. By dividing the project into stages, you can avoid misunderstandings and ensure everyone is aligned before moving forward. Follow these steps to use the process map template:
Step 1: Define your goal
What is the problem you would like to solve? What’s the process you would like to visualize?
This is the time to think big. As you advance through your process map template, you’ll spend more and more time cutting your project up into bite-sized chunks. For now, though, feel free to set a broad goal.
Step 2: Brainstorm
What steps will you need to take to solve this problem? How will the process unfold?
Don’t get too bogged down in the order you must undertake the process. Focus on getting all the steps down on the board. Think about the stakeholders you will need to involve in this project. You can also brainstorm resources you’ll need to get the job done.
Step 3: Define success
How will you know when you’ve solved the problem? When is the process over?
Many teams skip this step, but it’s important not to neglect it. By defining clear metrics for success ― or even just a stopping point ― you give yourself something to work toward.
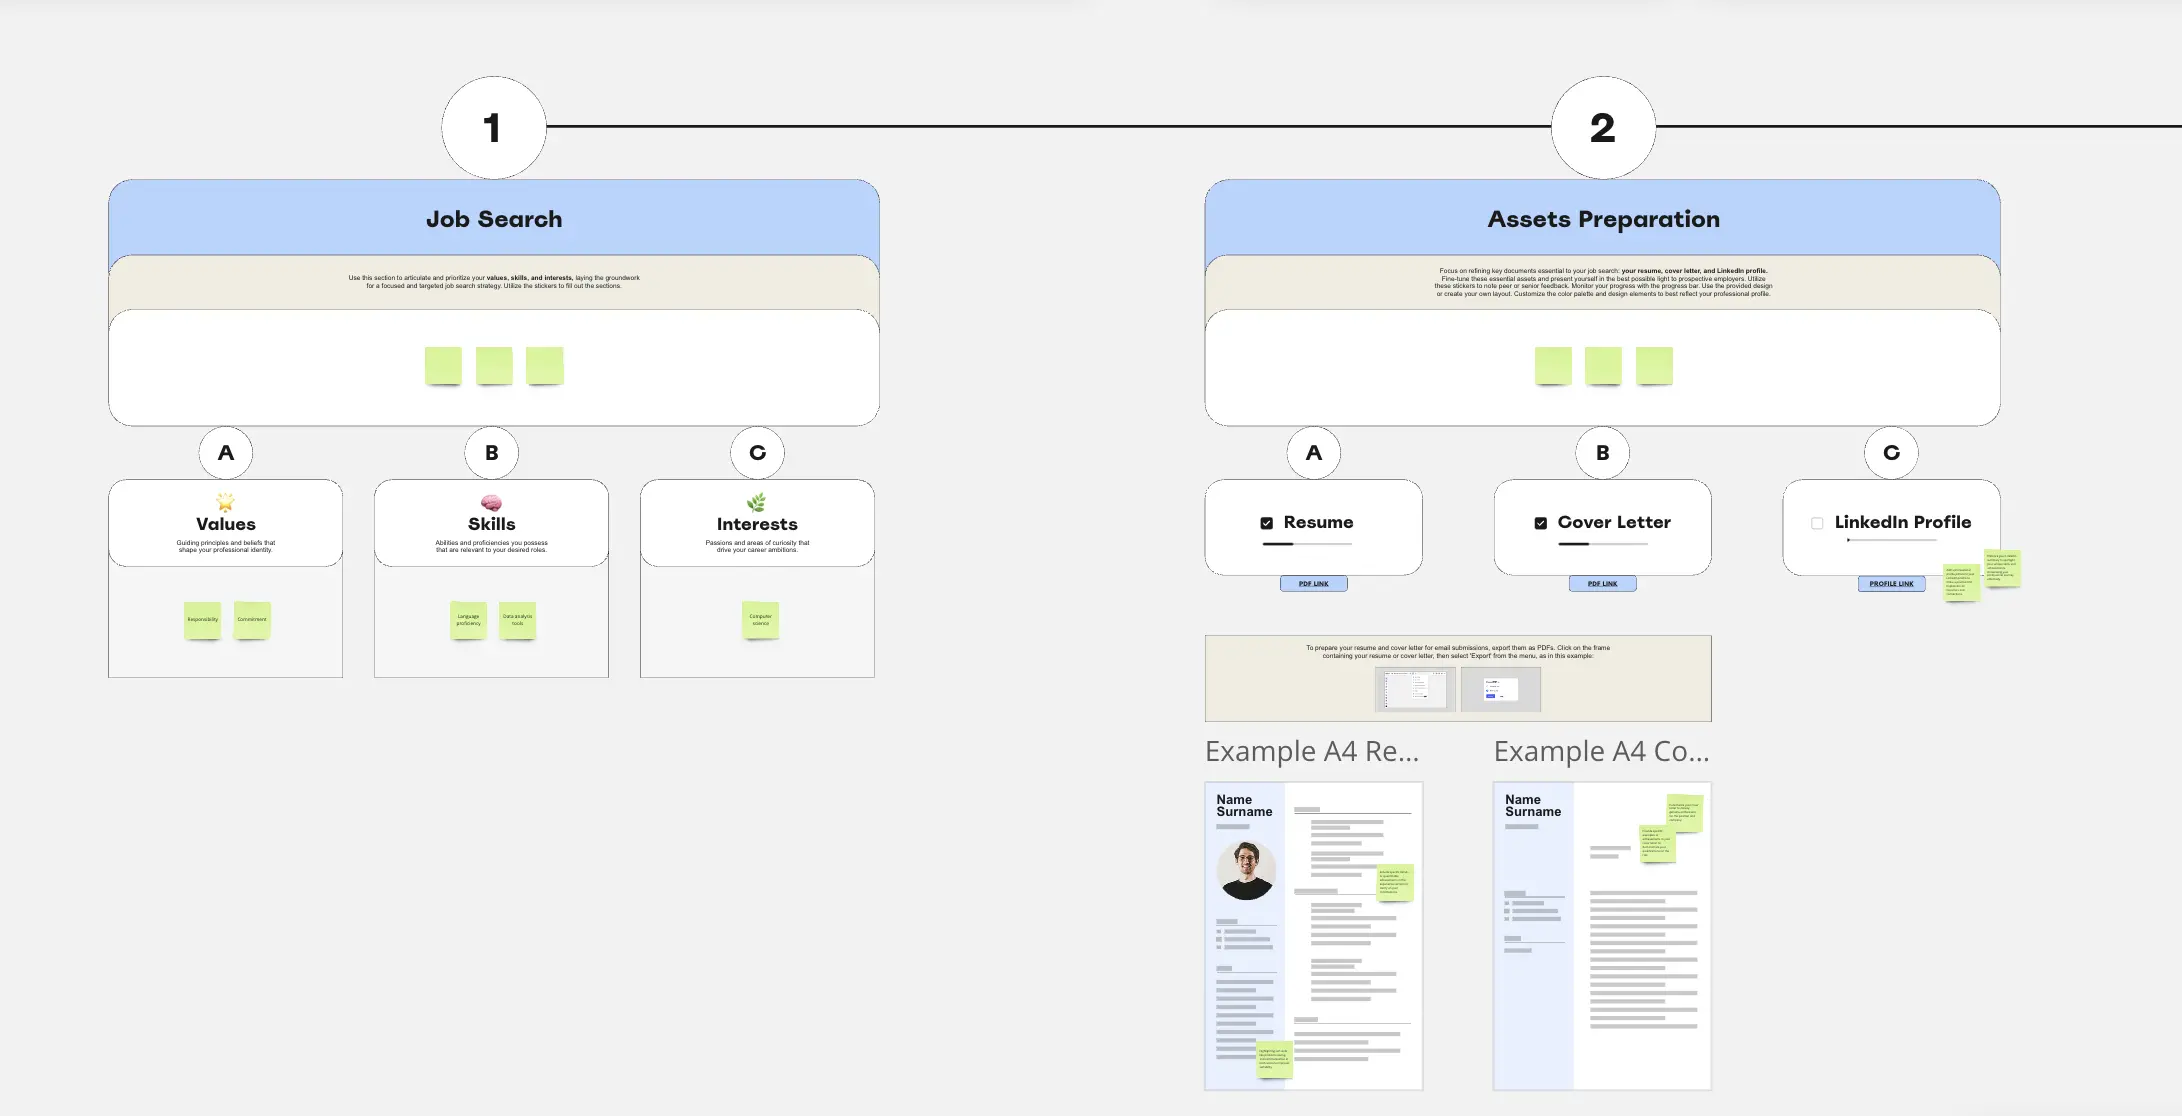
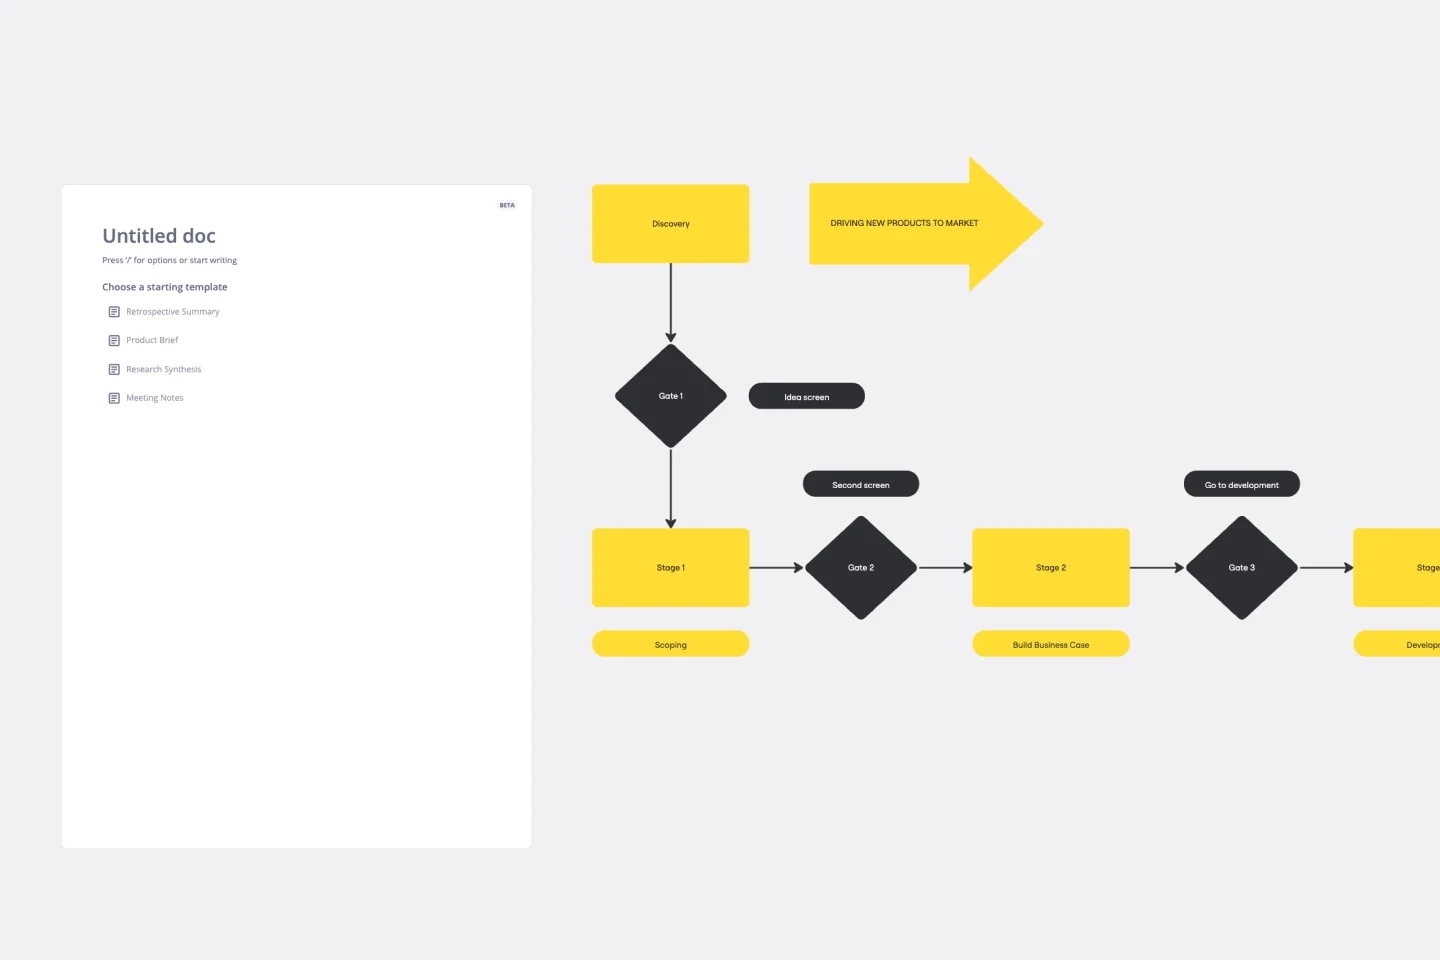
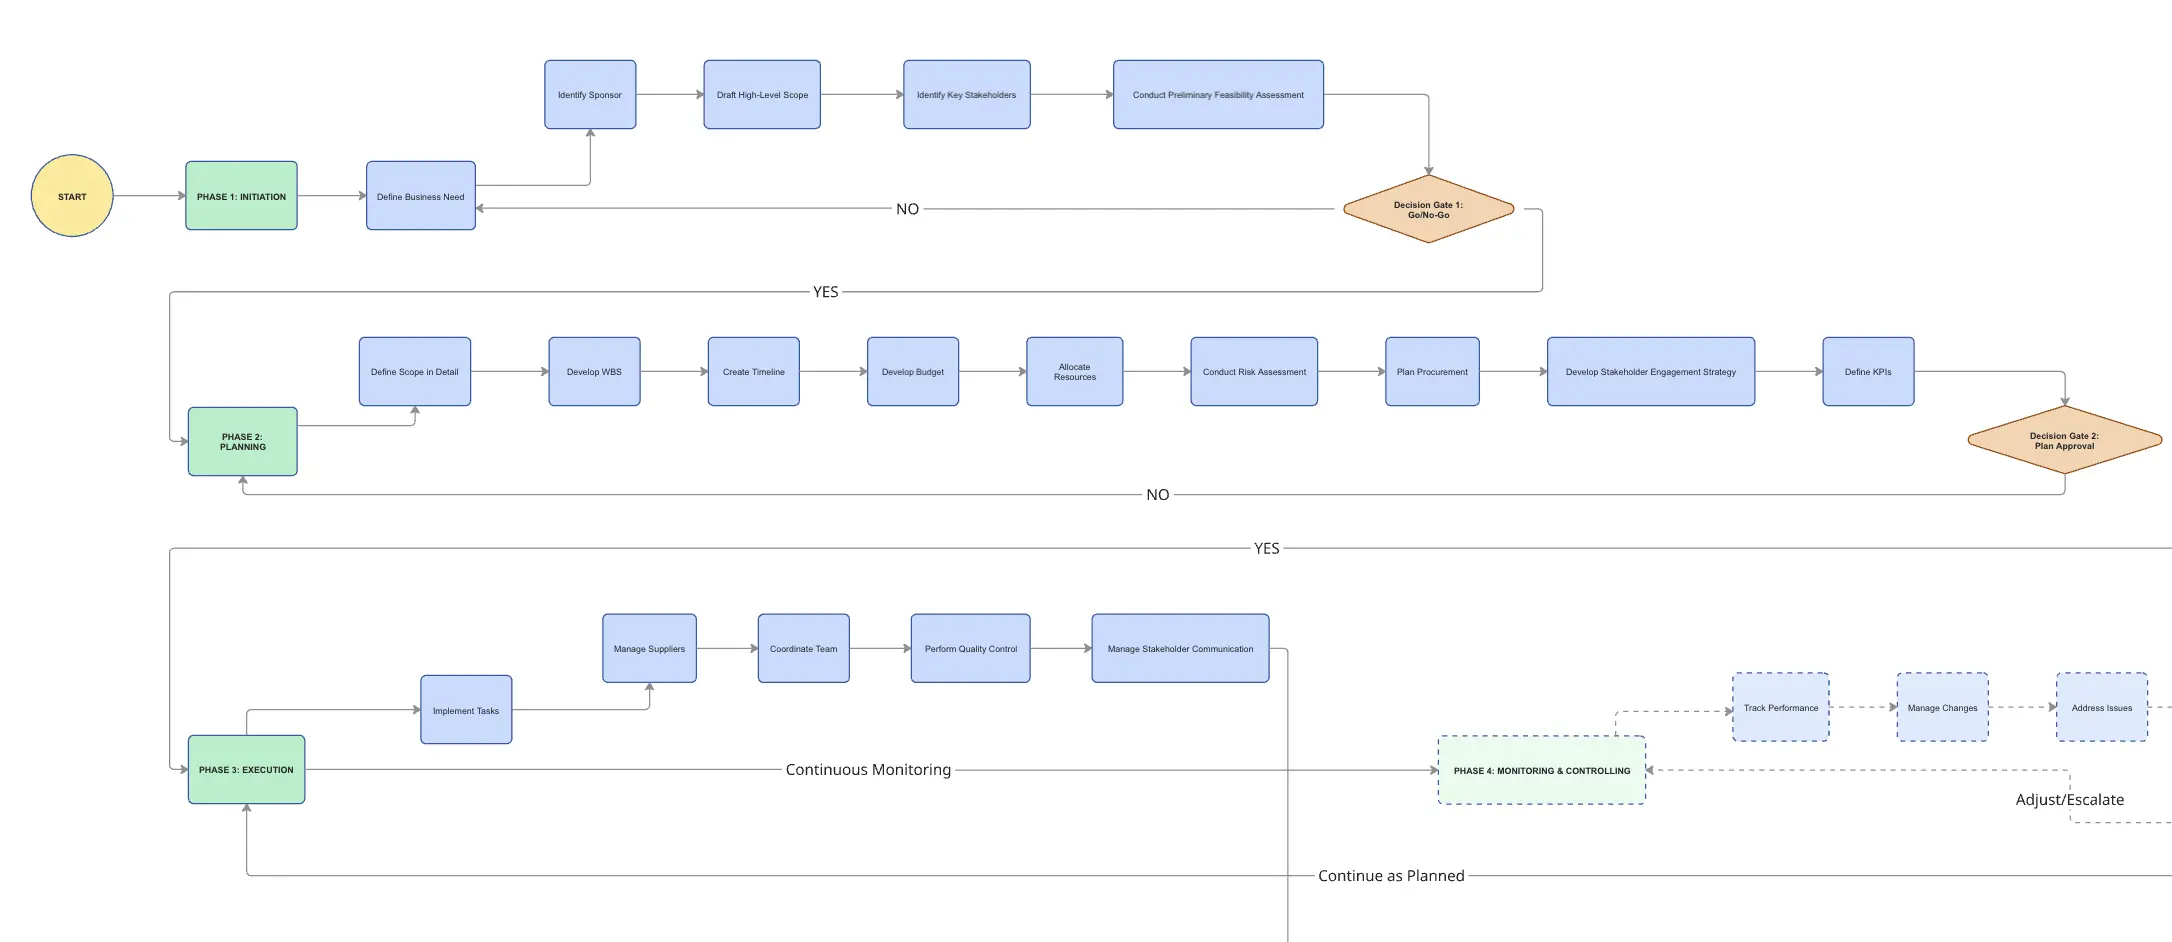
Step 4: Put things in order
What steps will you take to solve the problem? What is the order in which you must work to make sure the process gets done?
Now is the time to think linearly. Take all the raw material from your brainstorm and start putting things in order. If it’s too daunting to work linearly, start by defining what you’ll need to do first and last, and then work on everything in between.
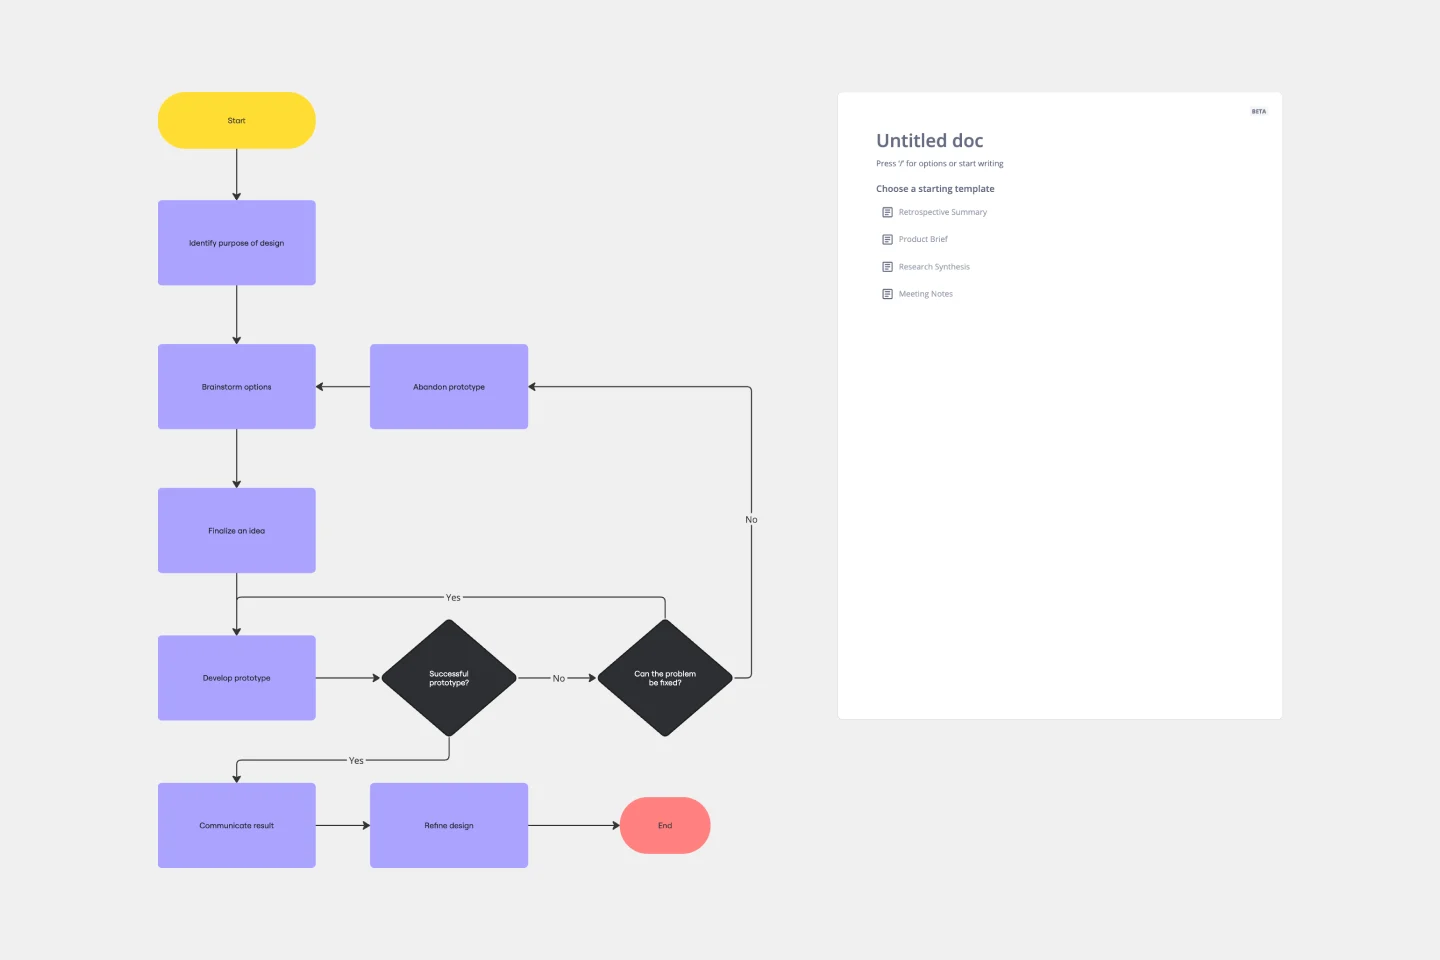
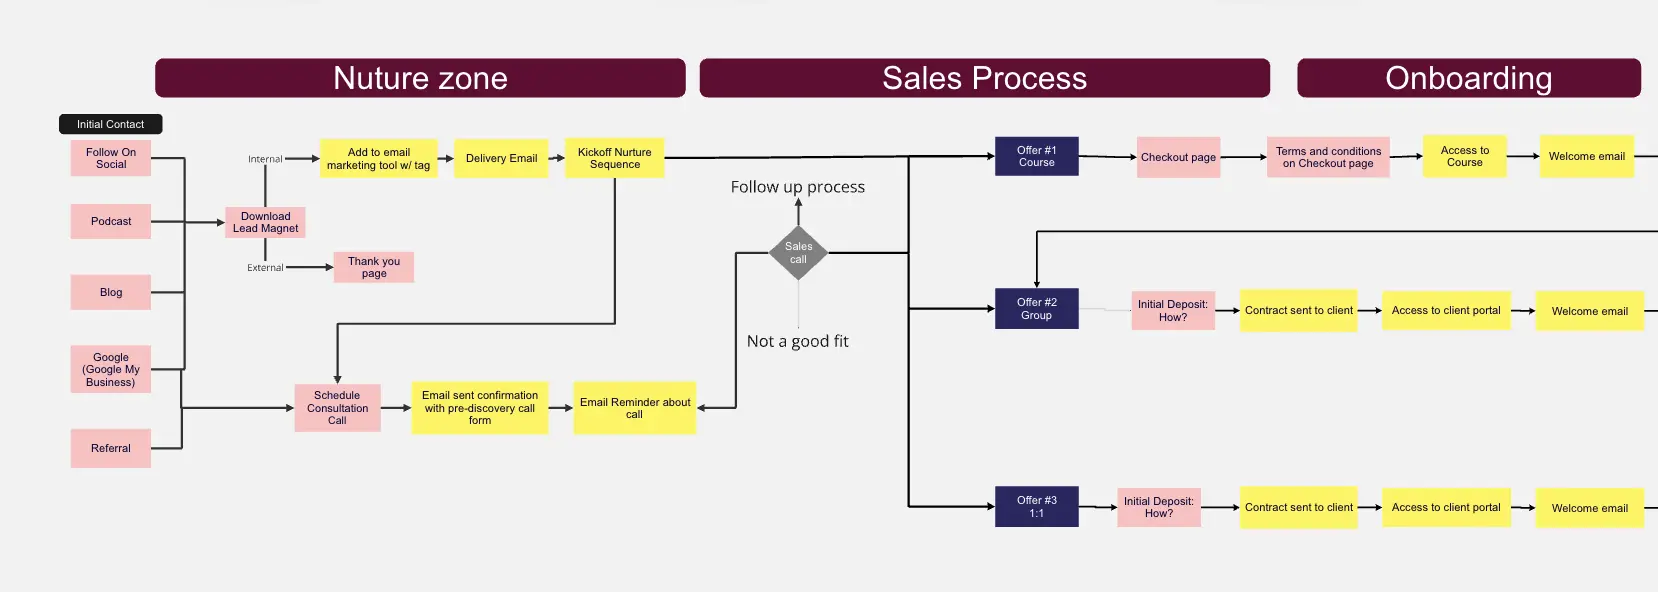
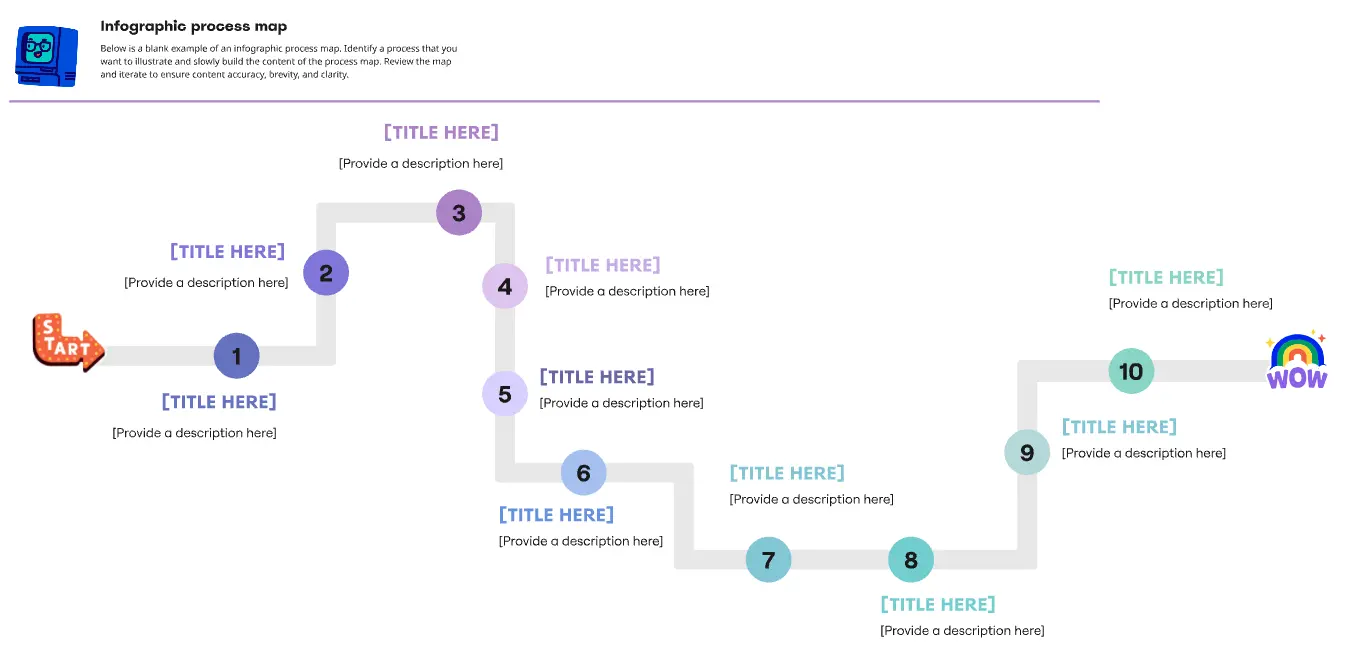
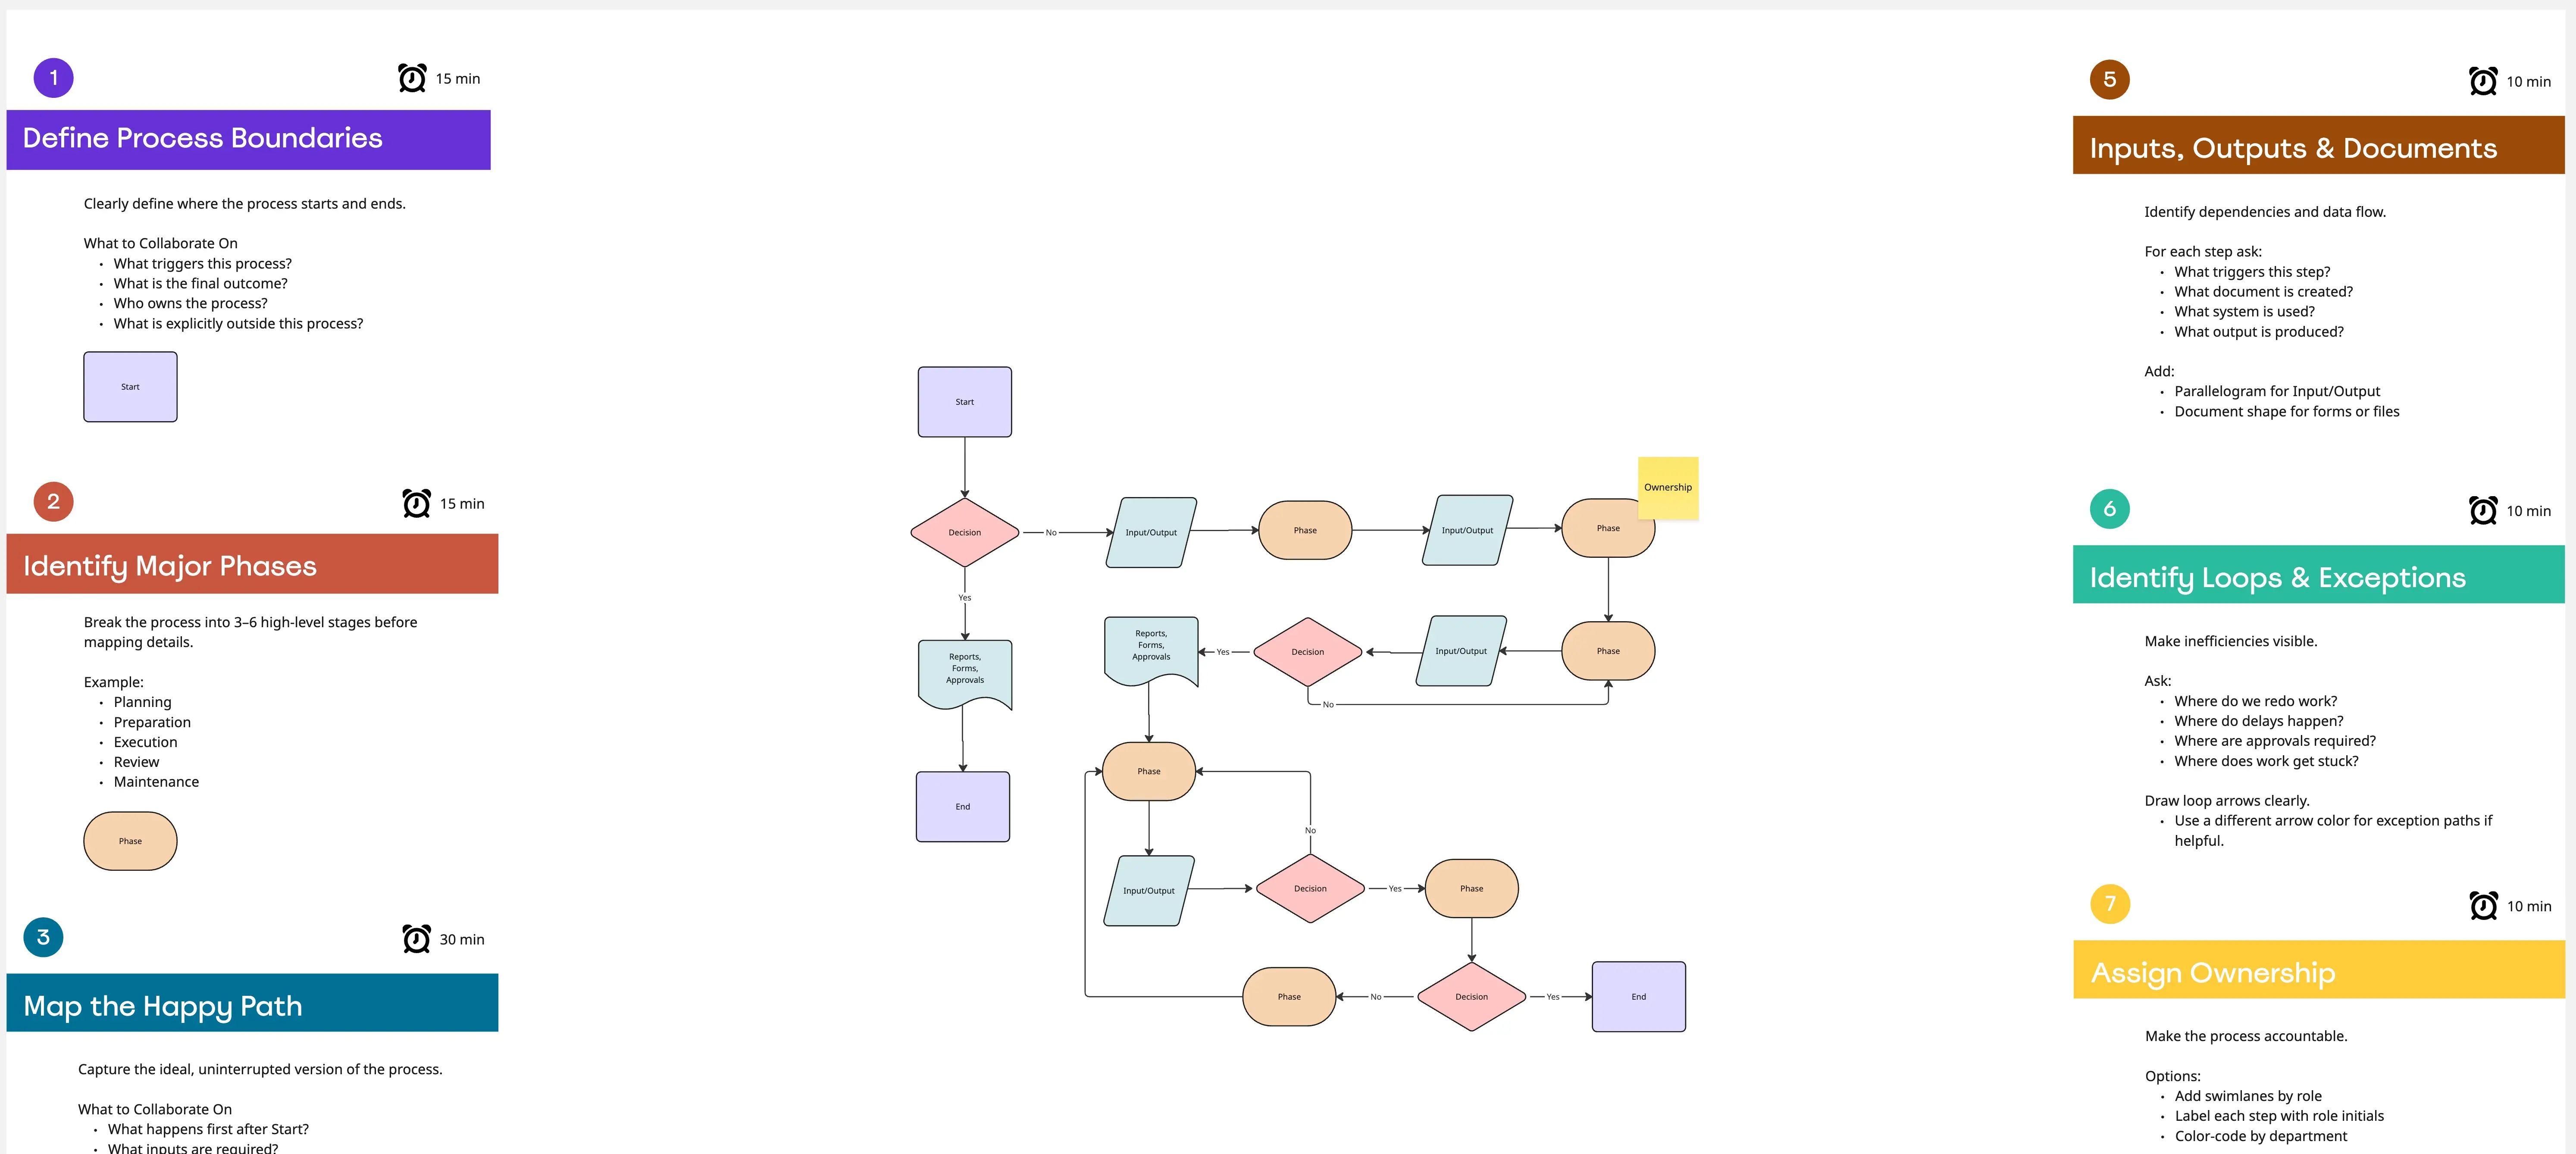
Step 5: Draw it out
What does the problem look like? How can you visualize the process?
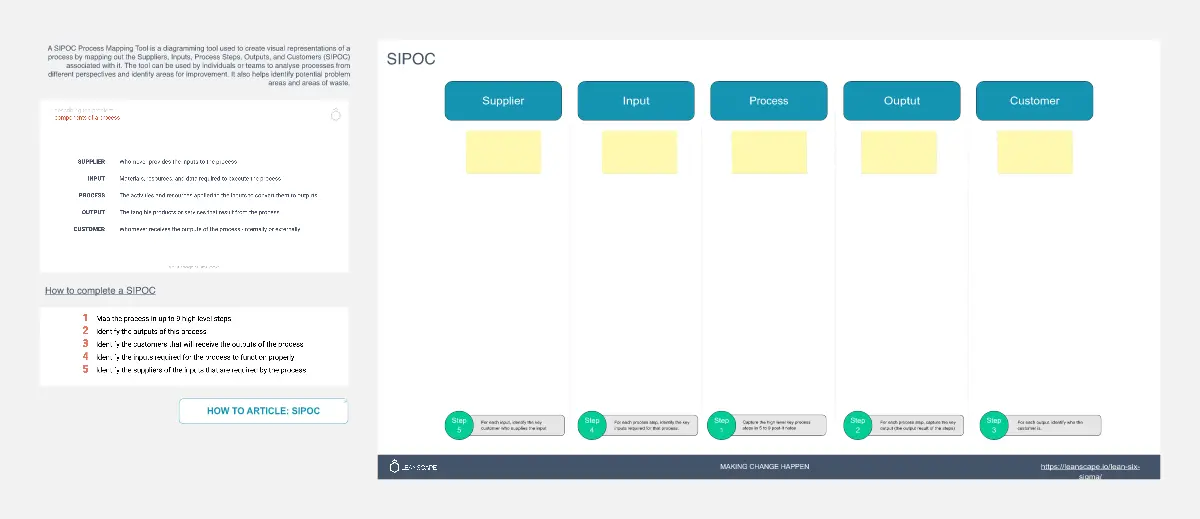
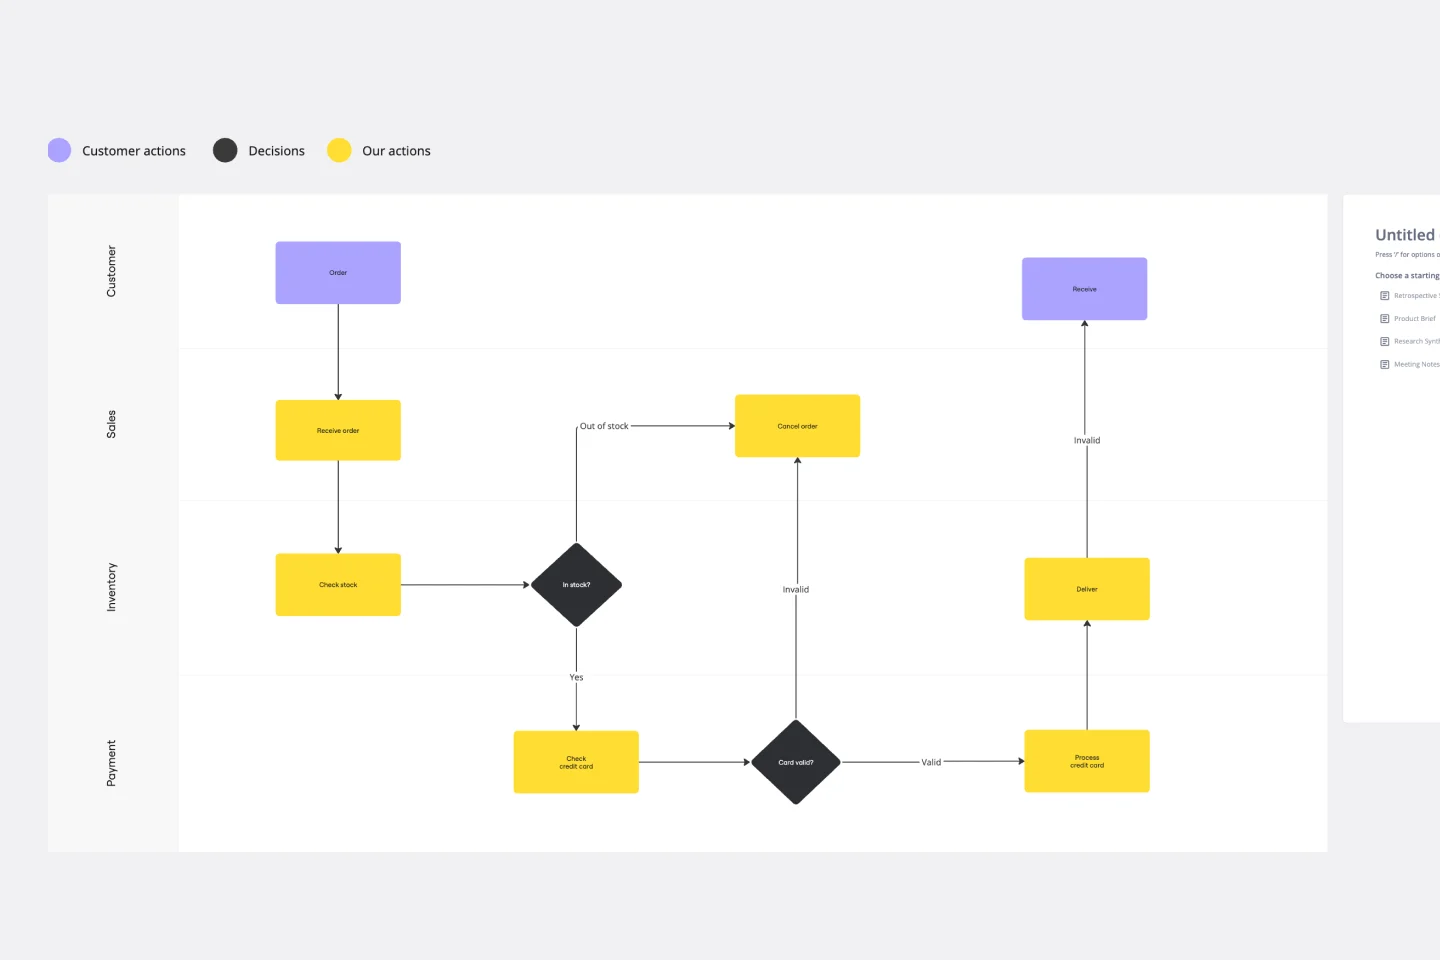
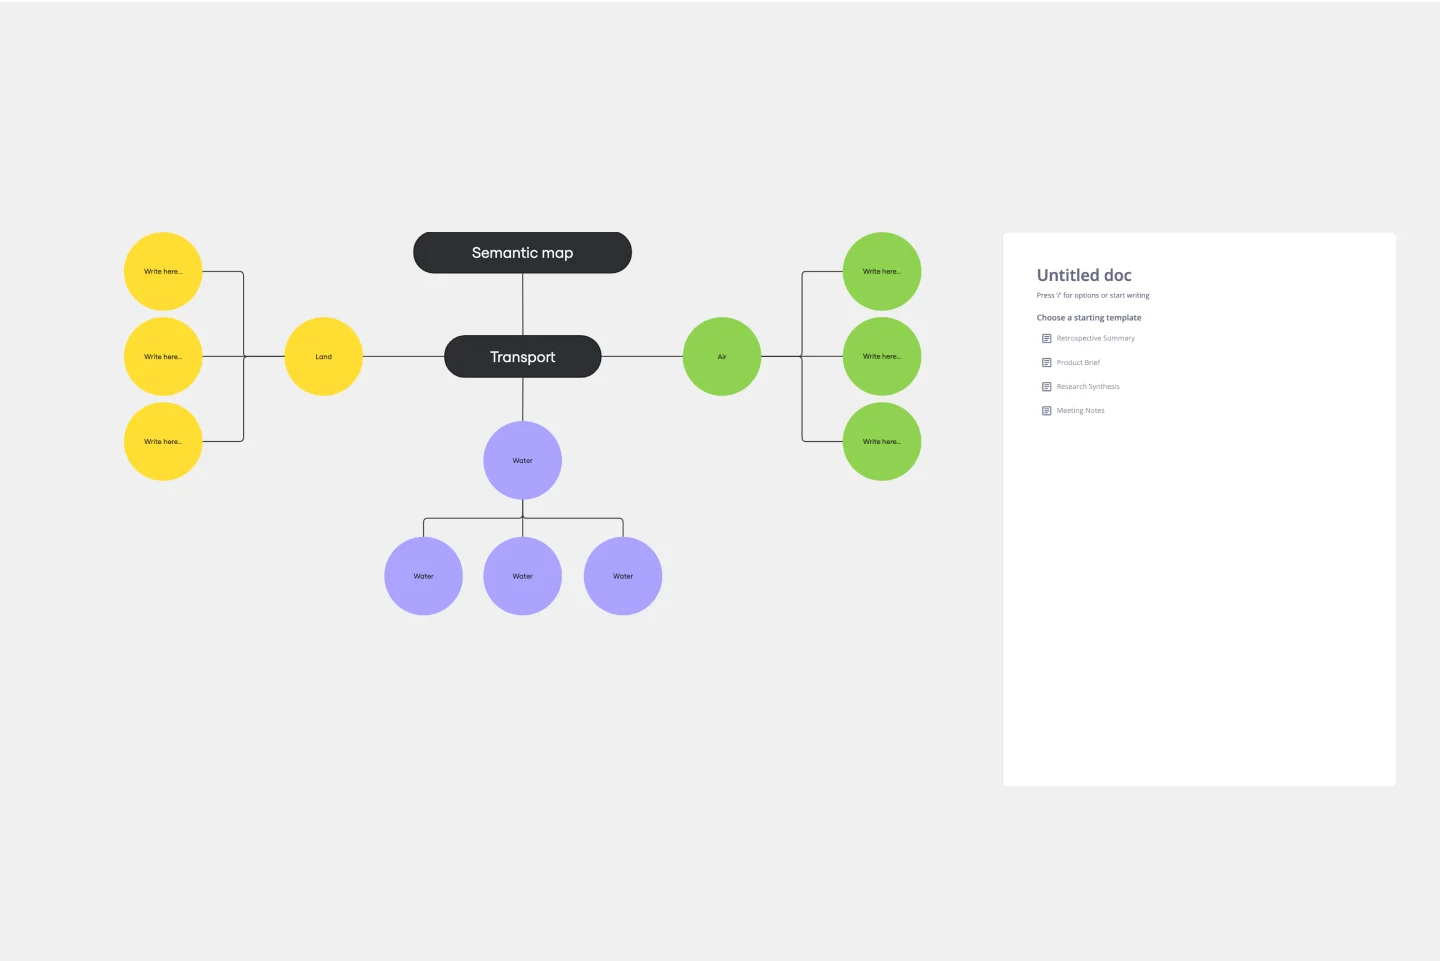
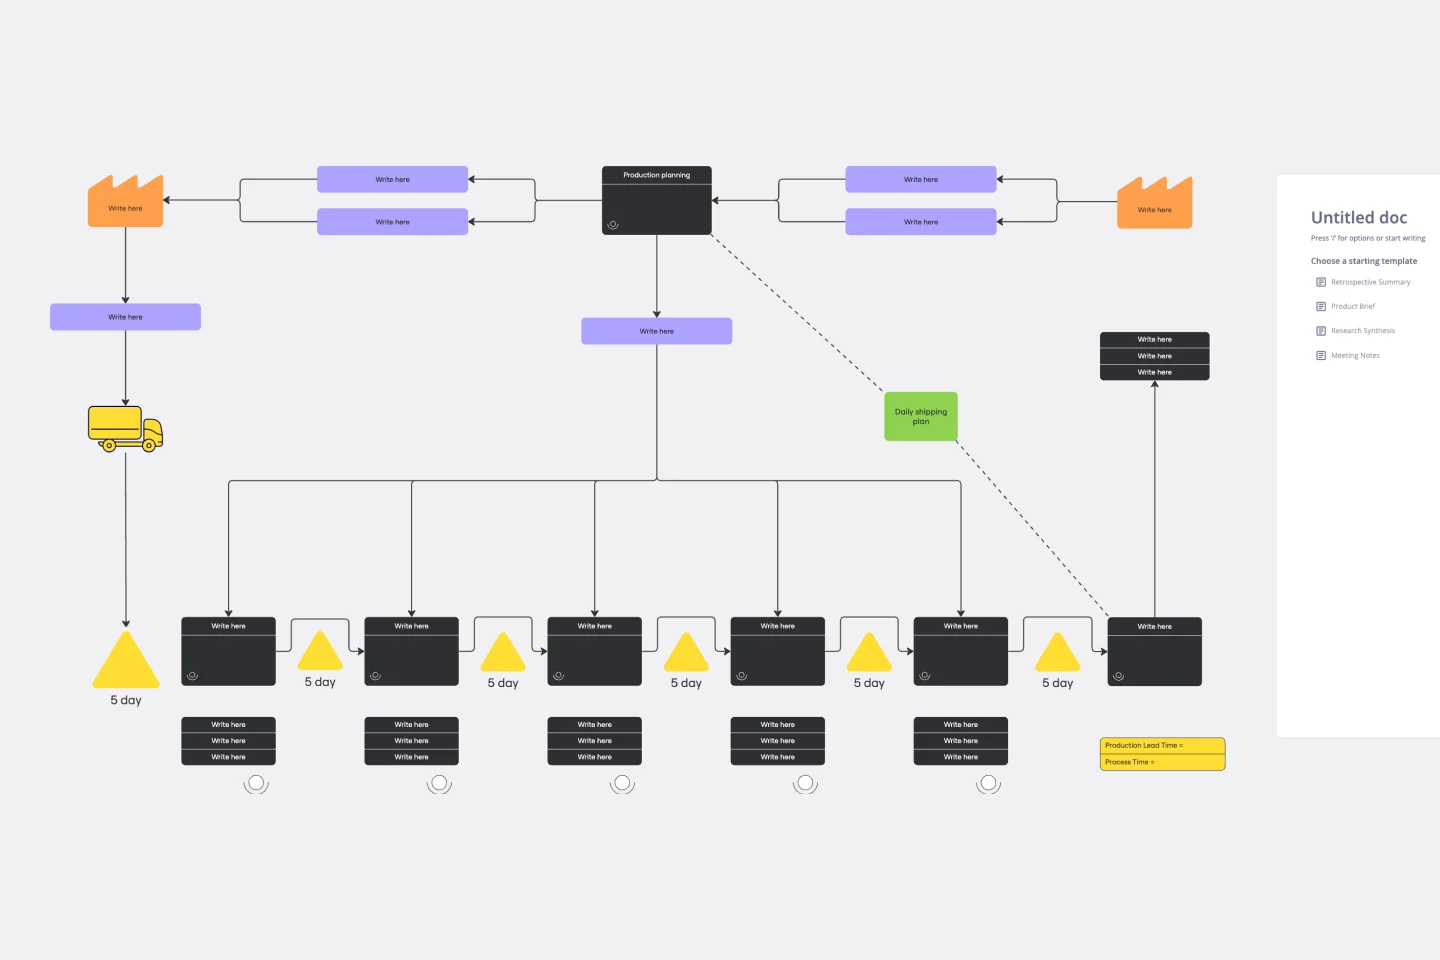
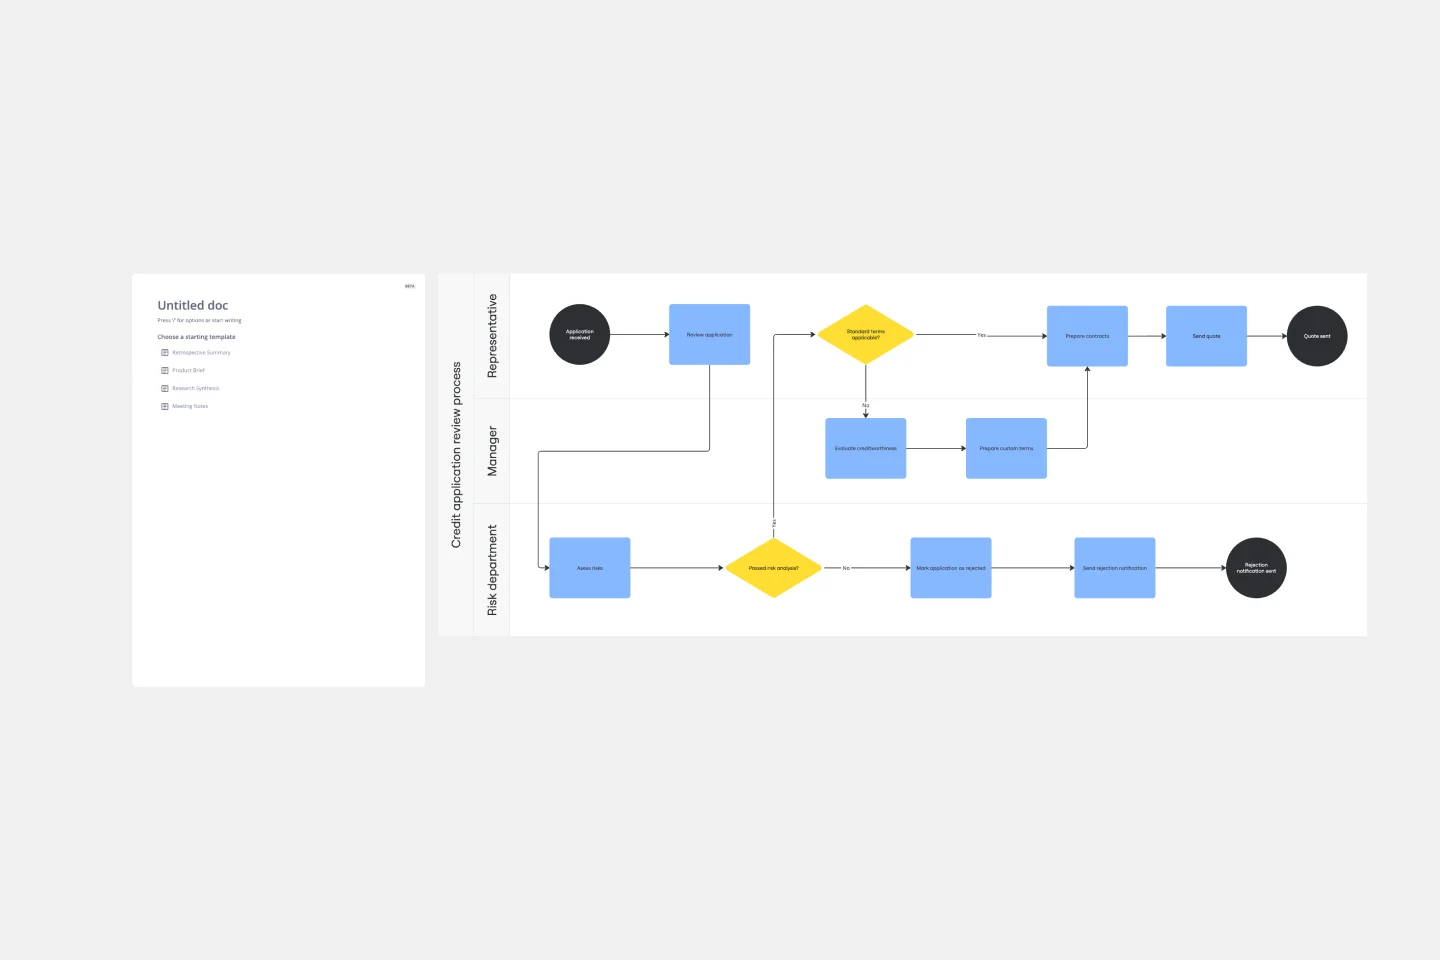
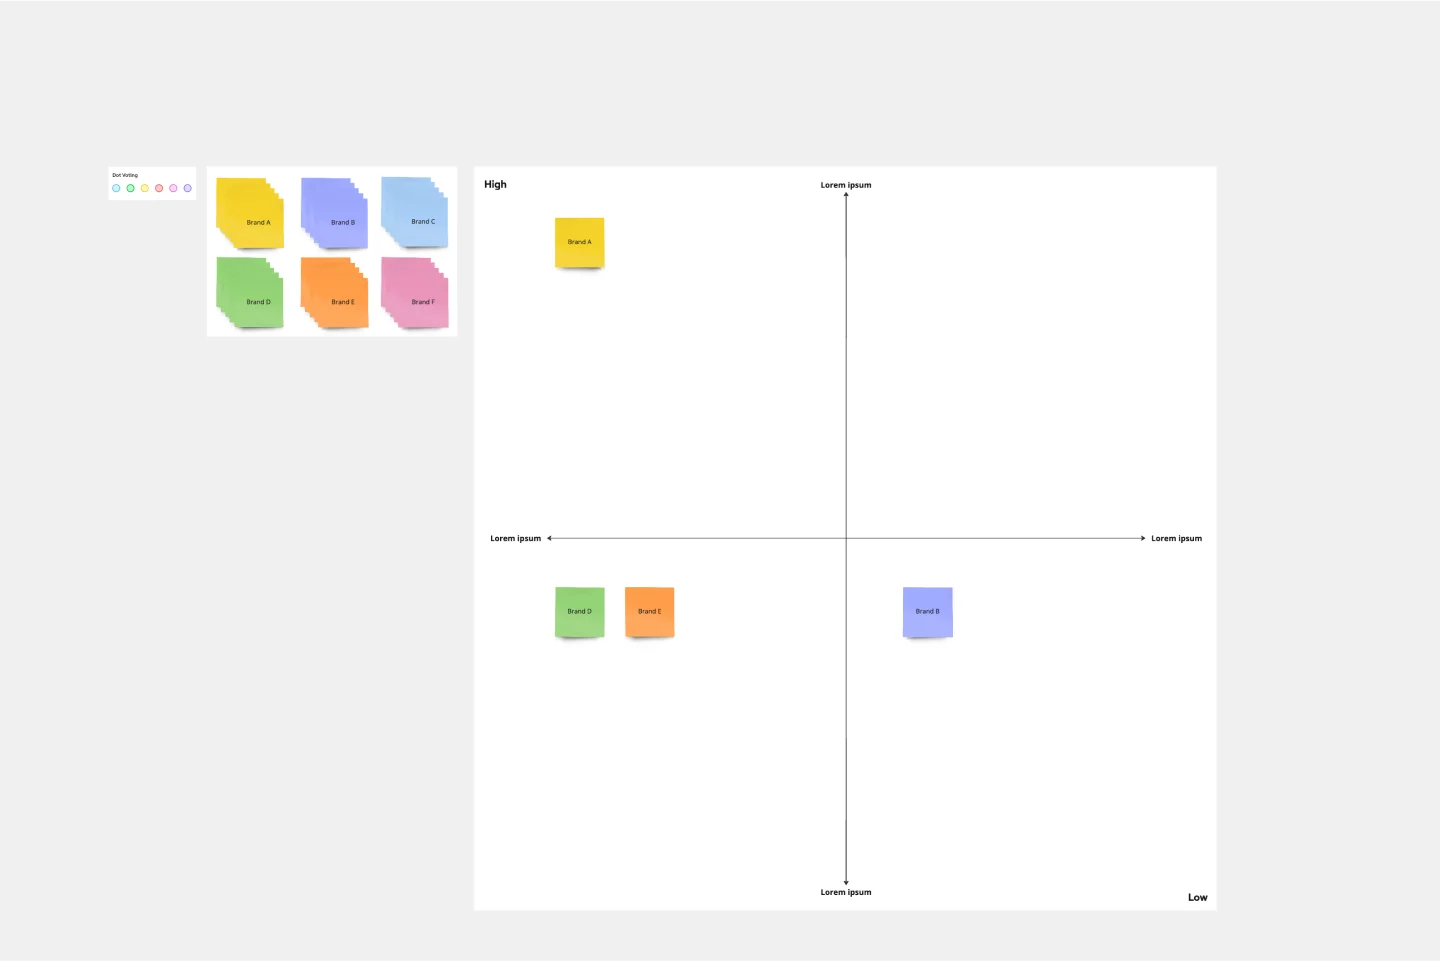
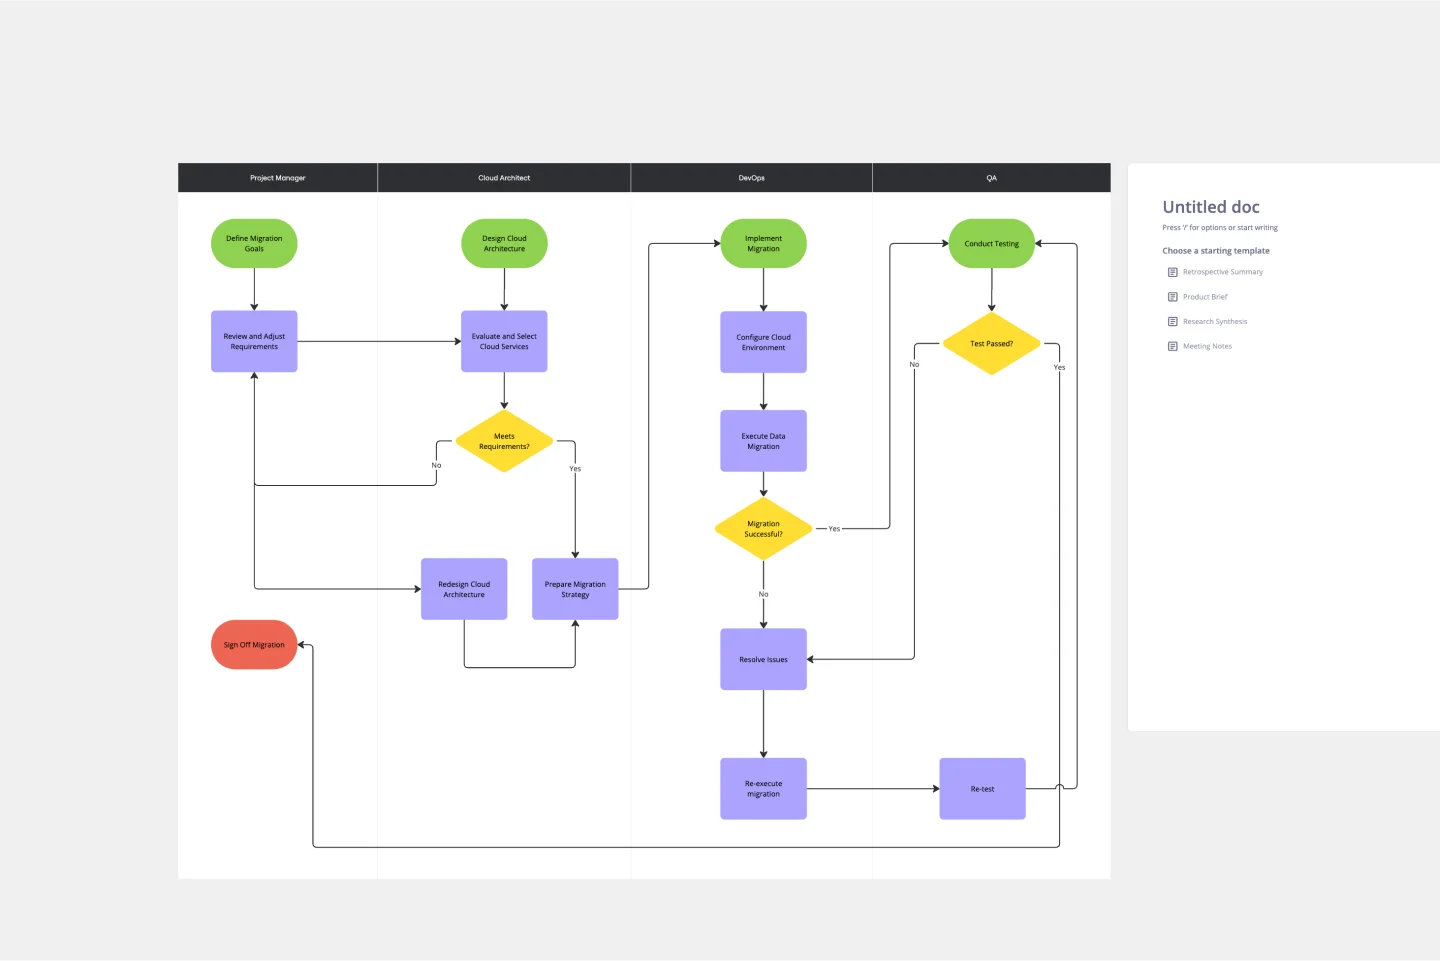
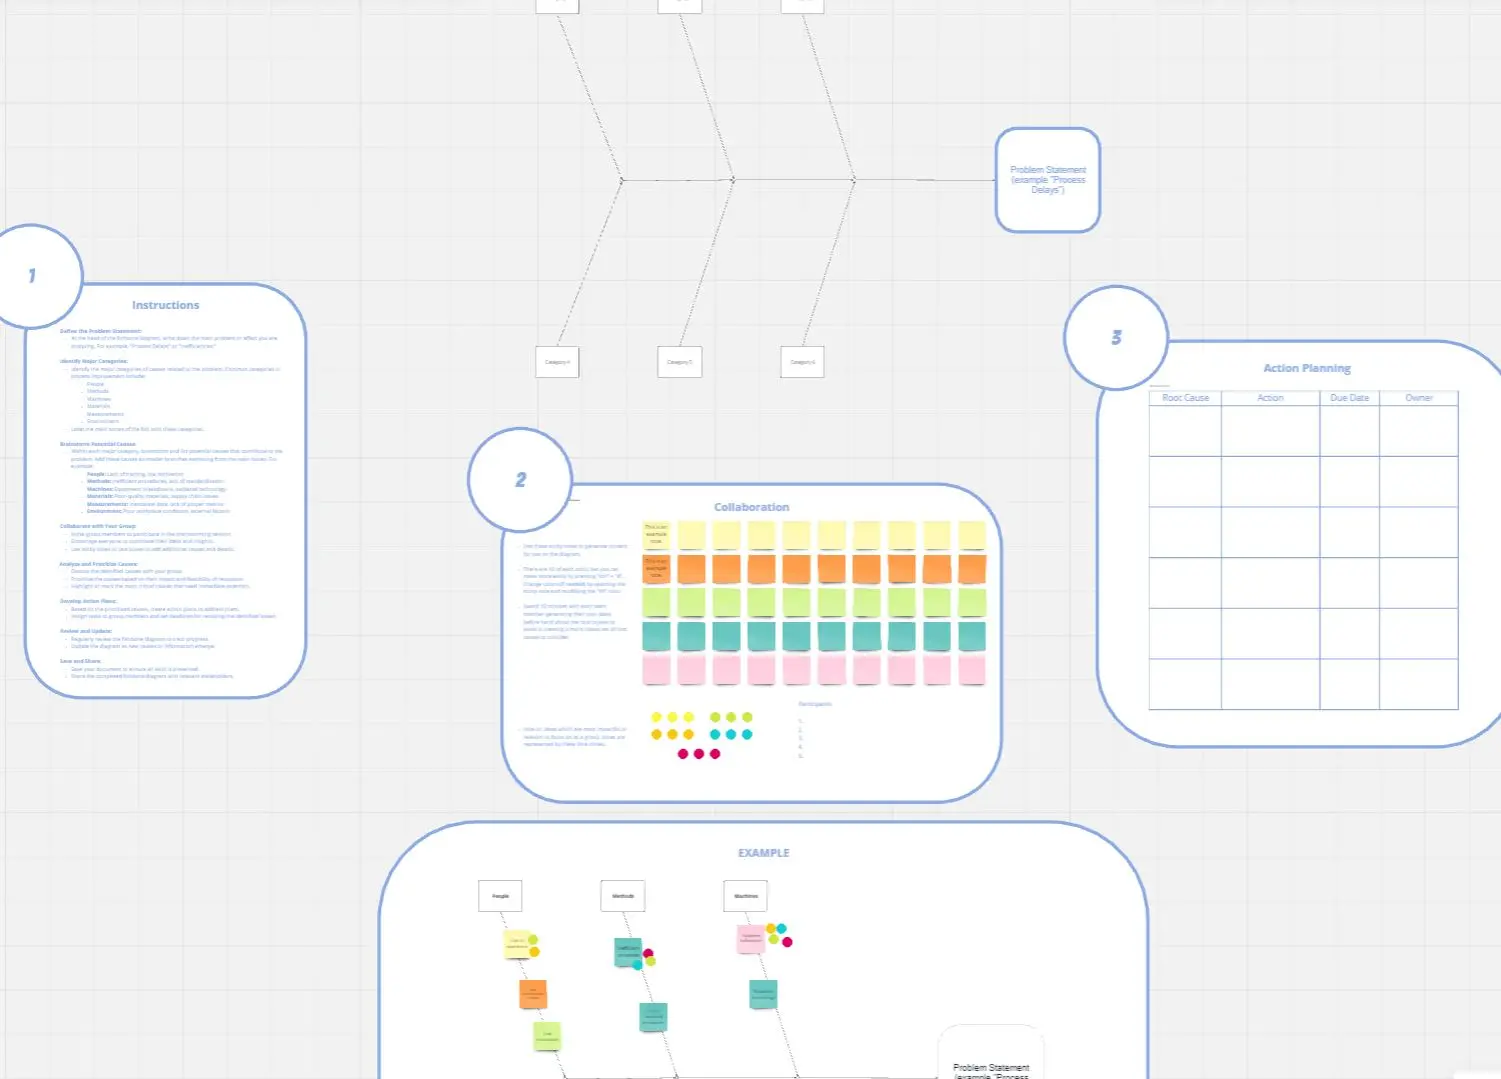
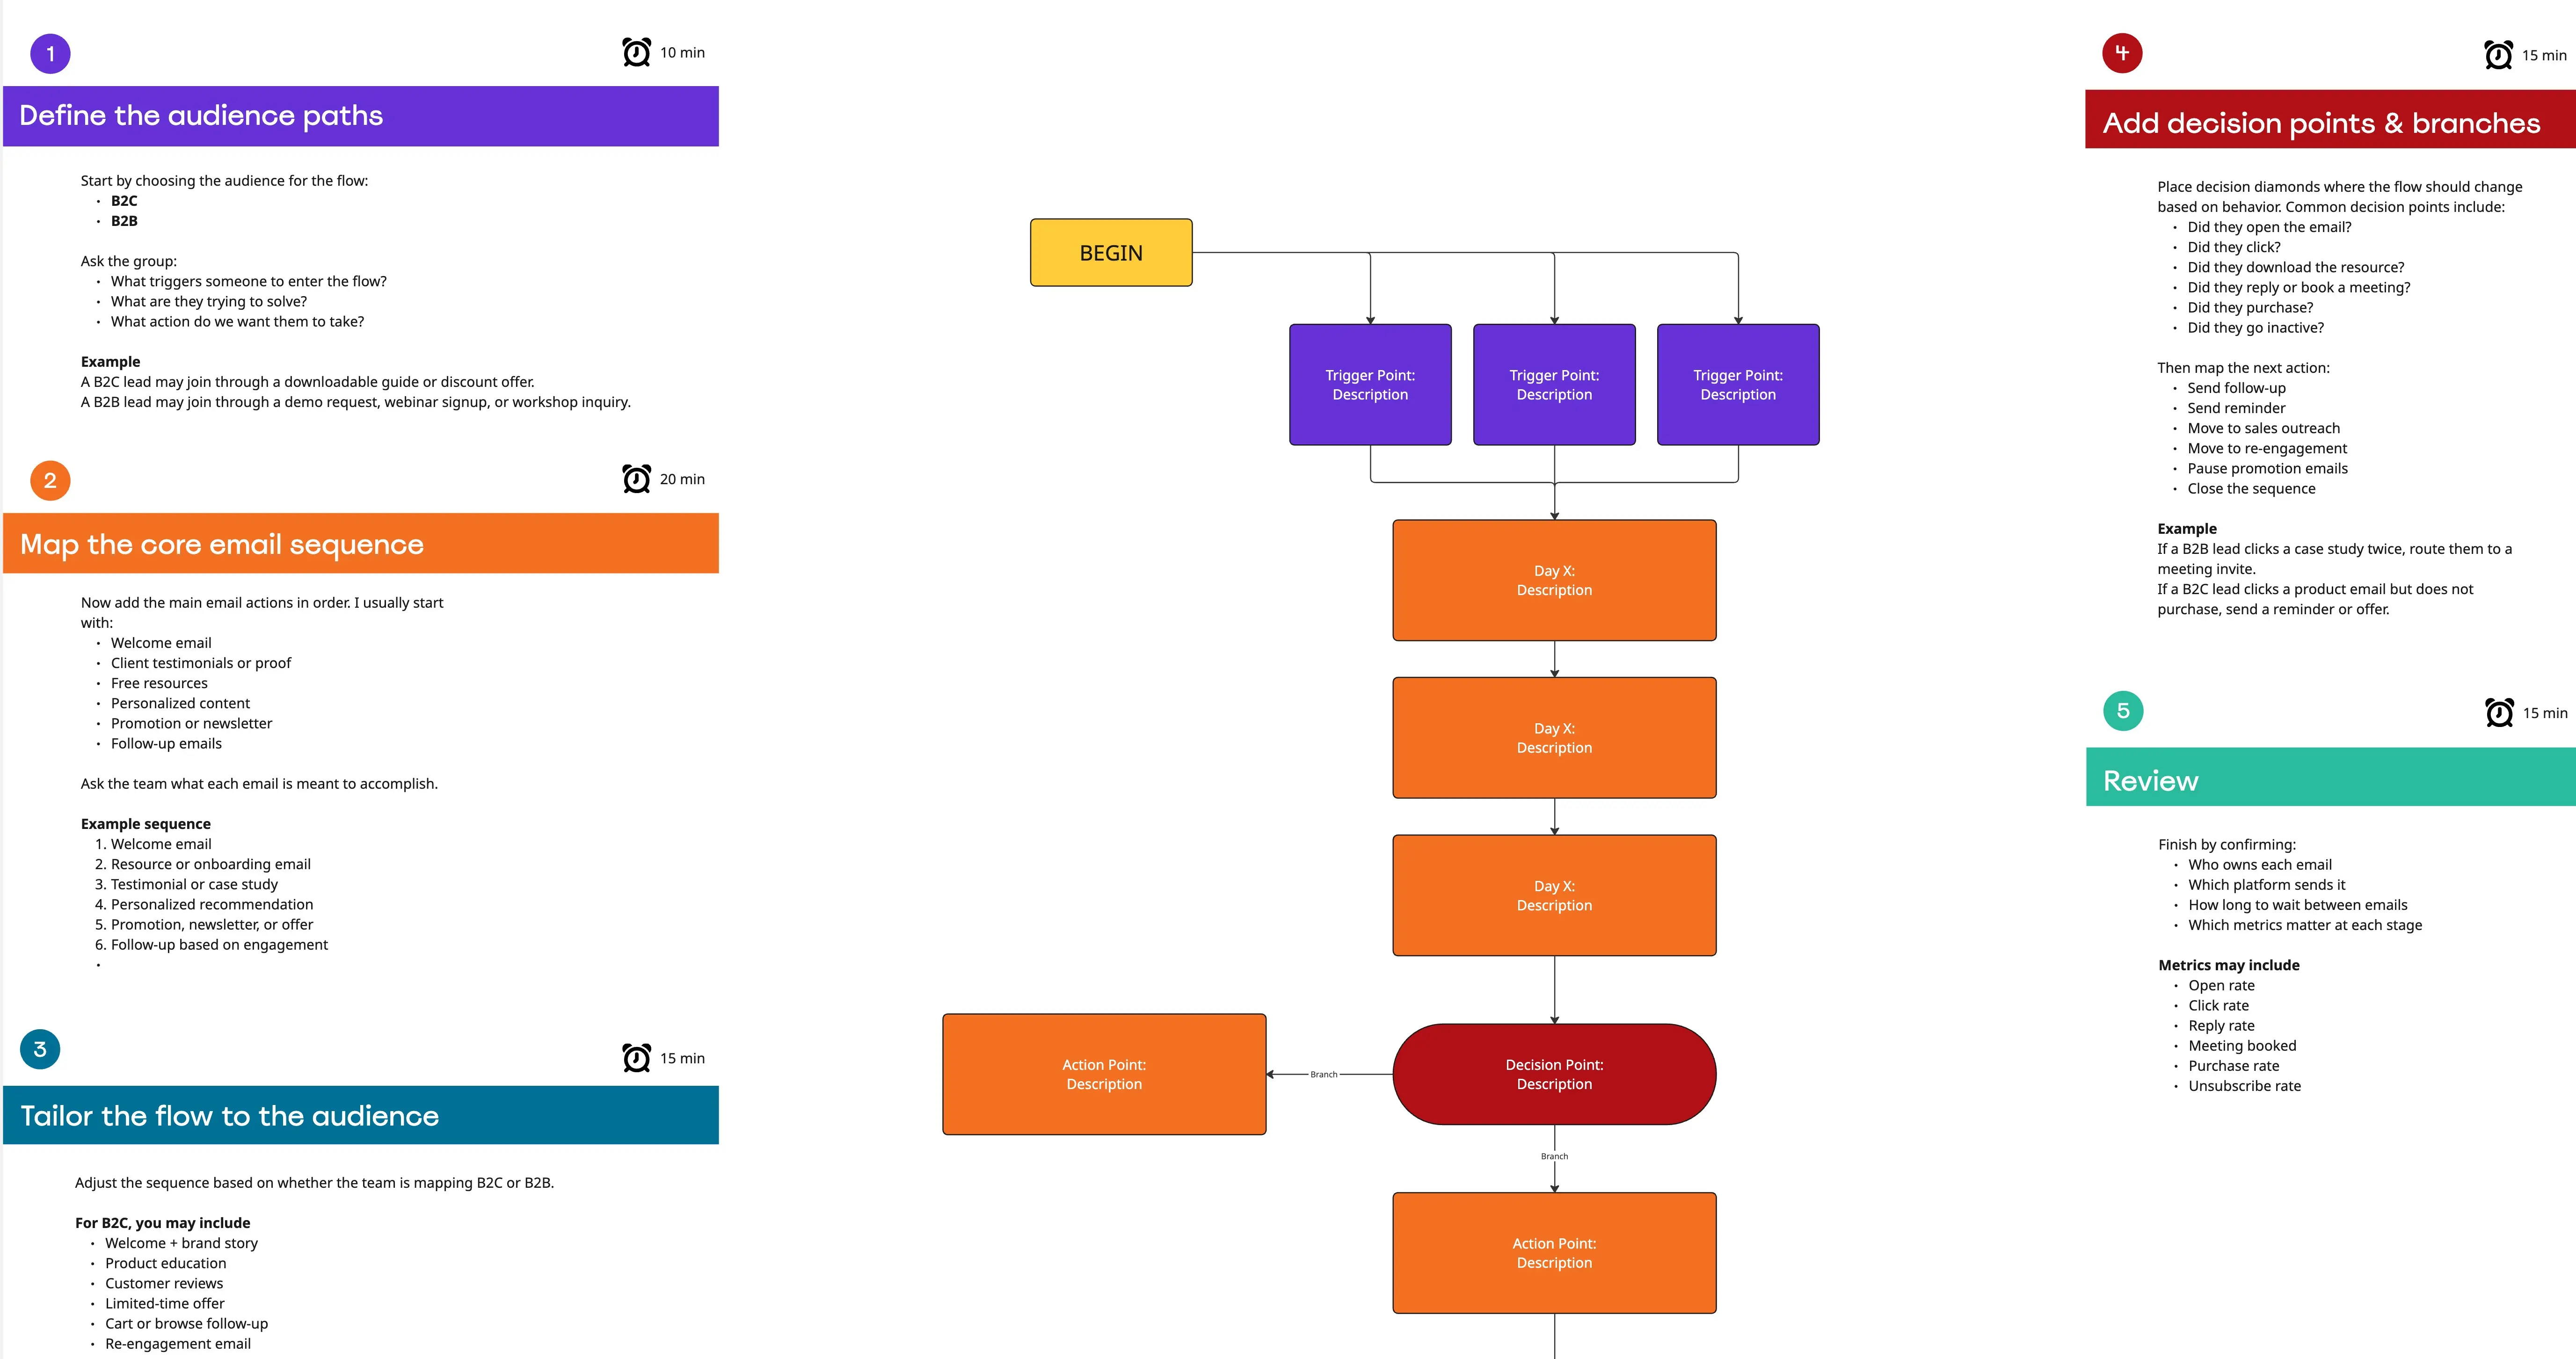
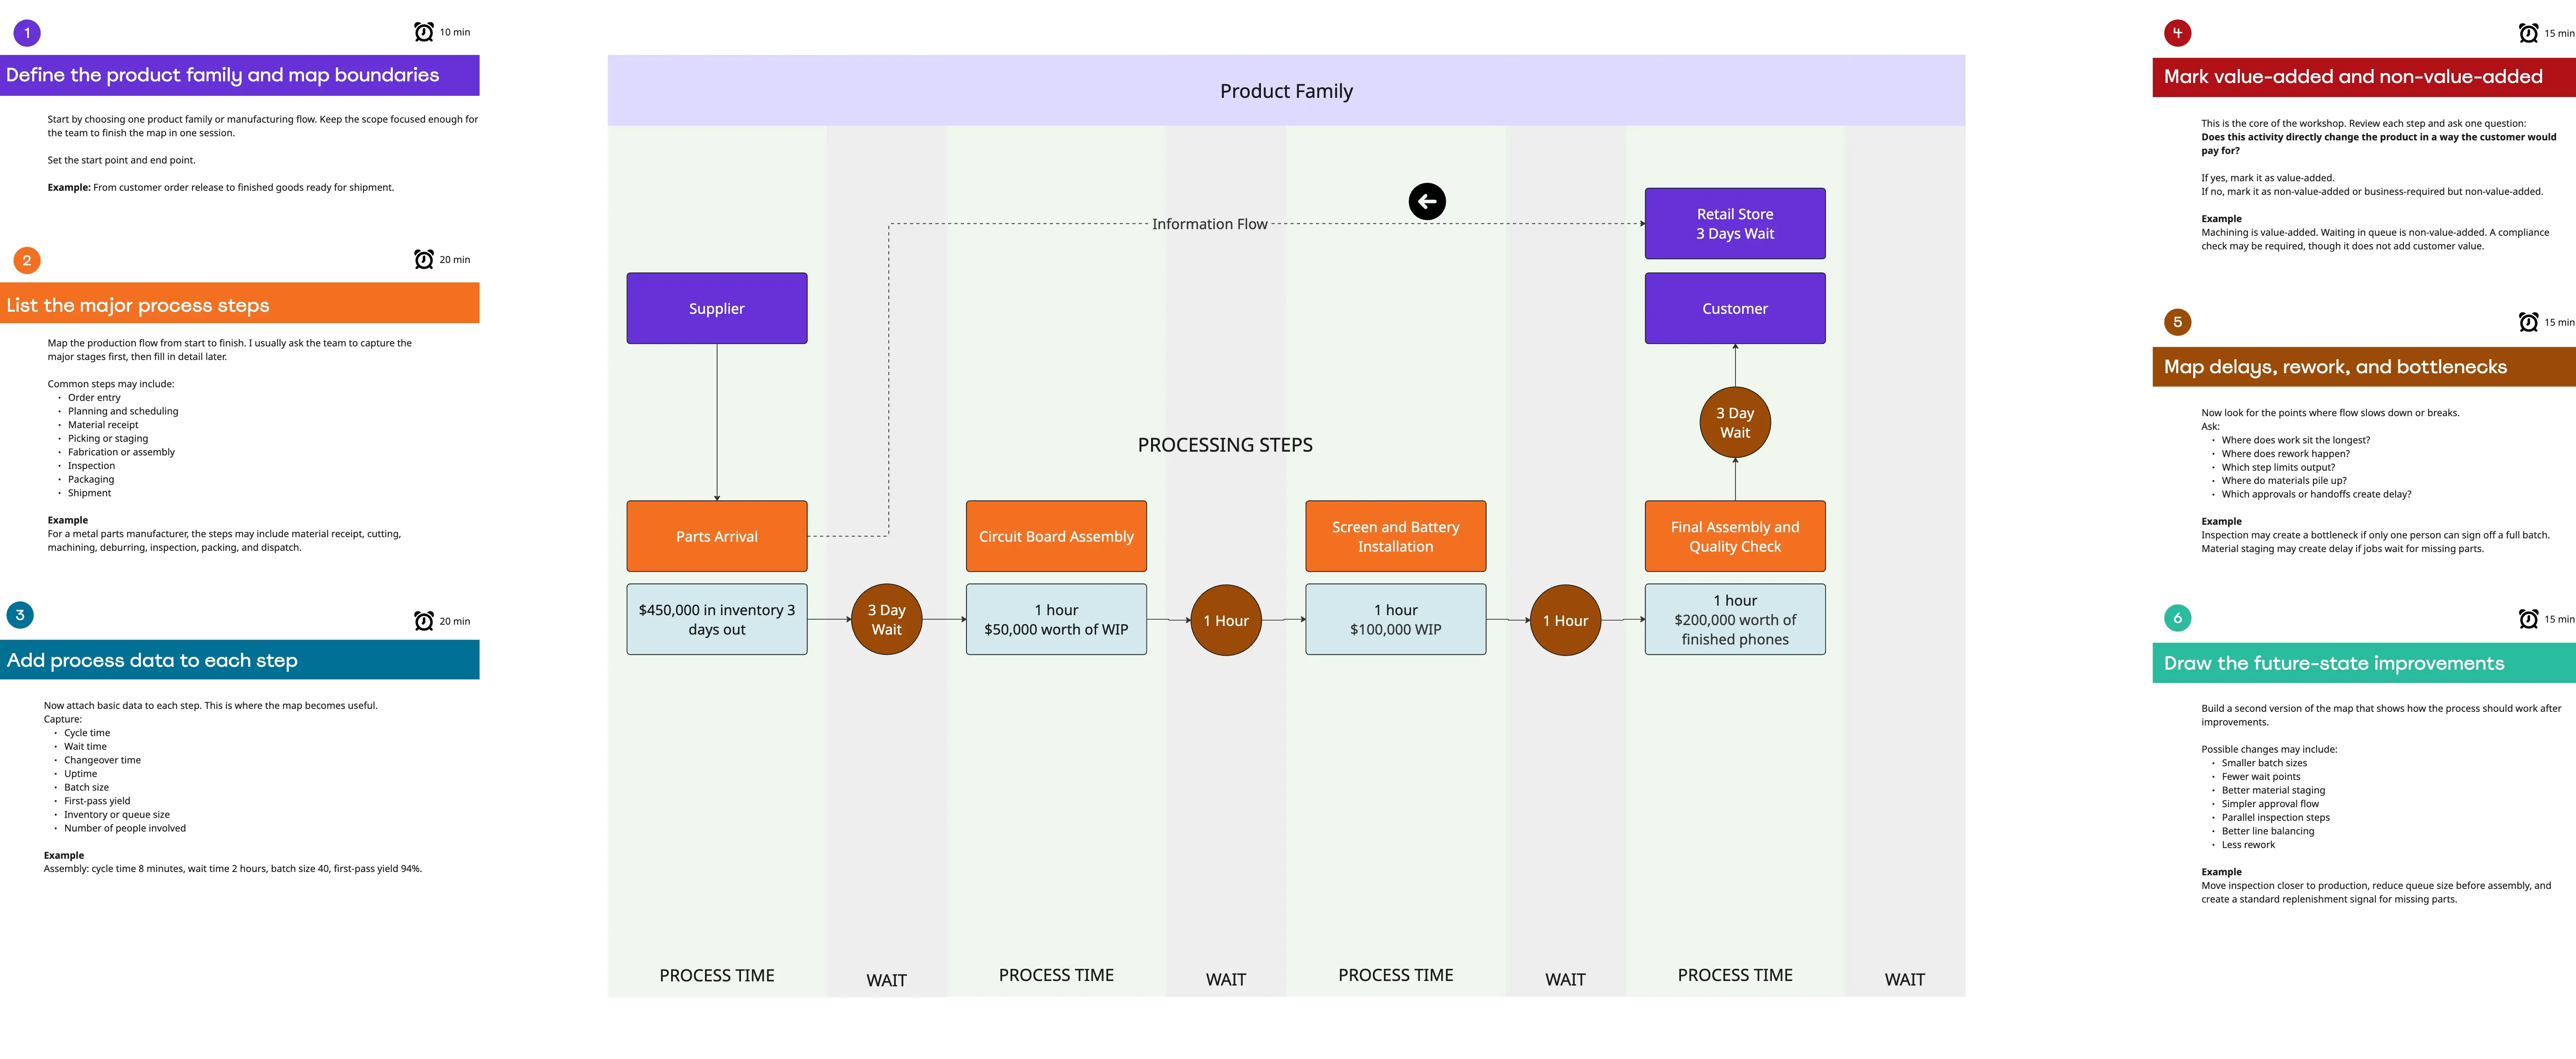
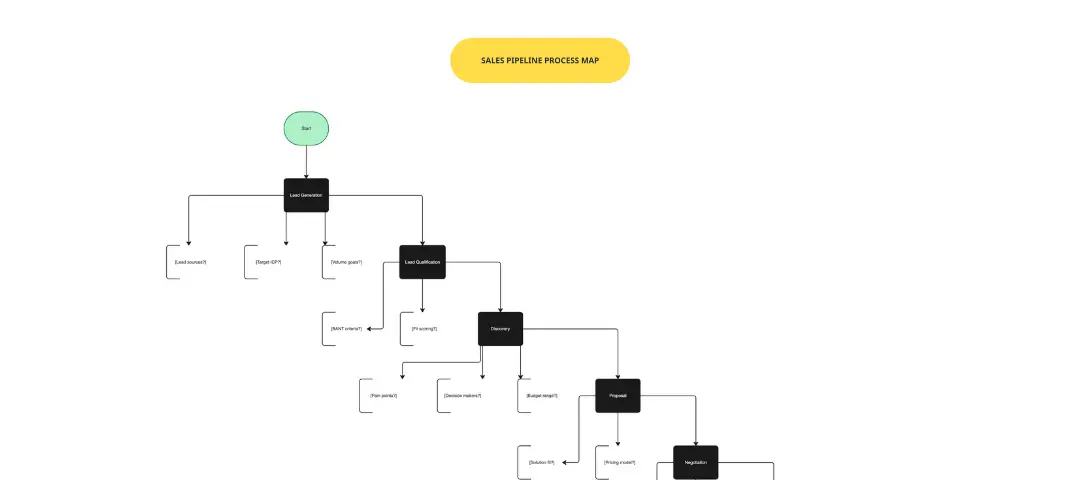
It’s time to put your process map template to work. Start by creating a key. The key should contain symbols that you’ll use throughout the process map.
You might need symbols representing activities, inputs, outputs, decisions, and endpoints. Use a system that is intuitive and scalable. For example, many people like to use arrows to indicate the flow of decision-making.
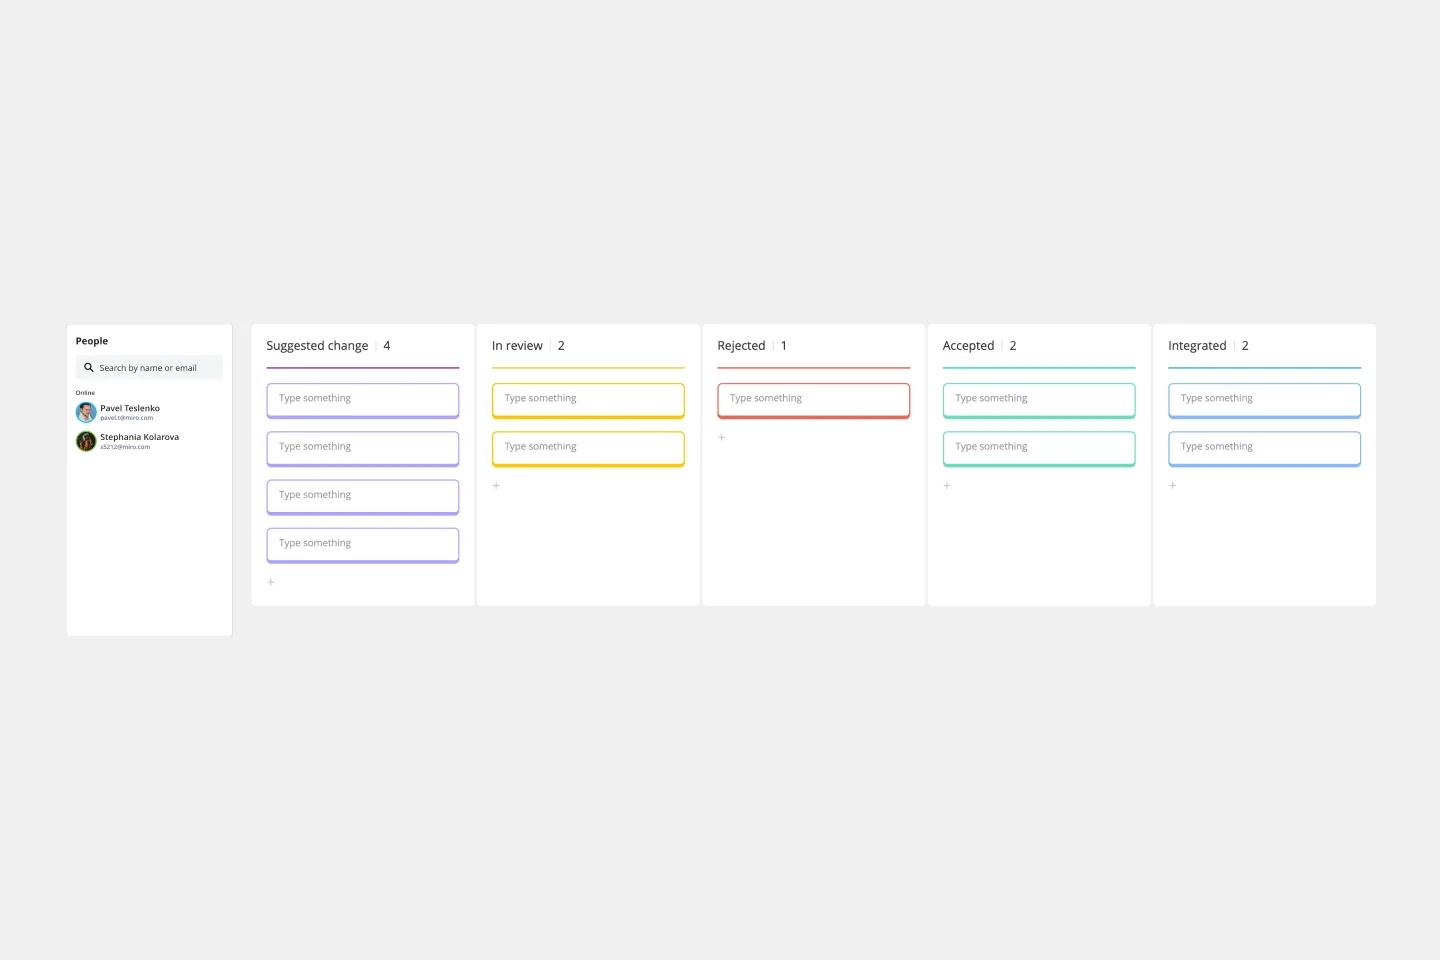
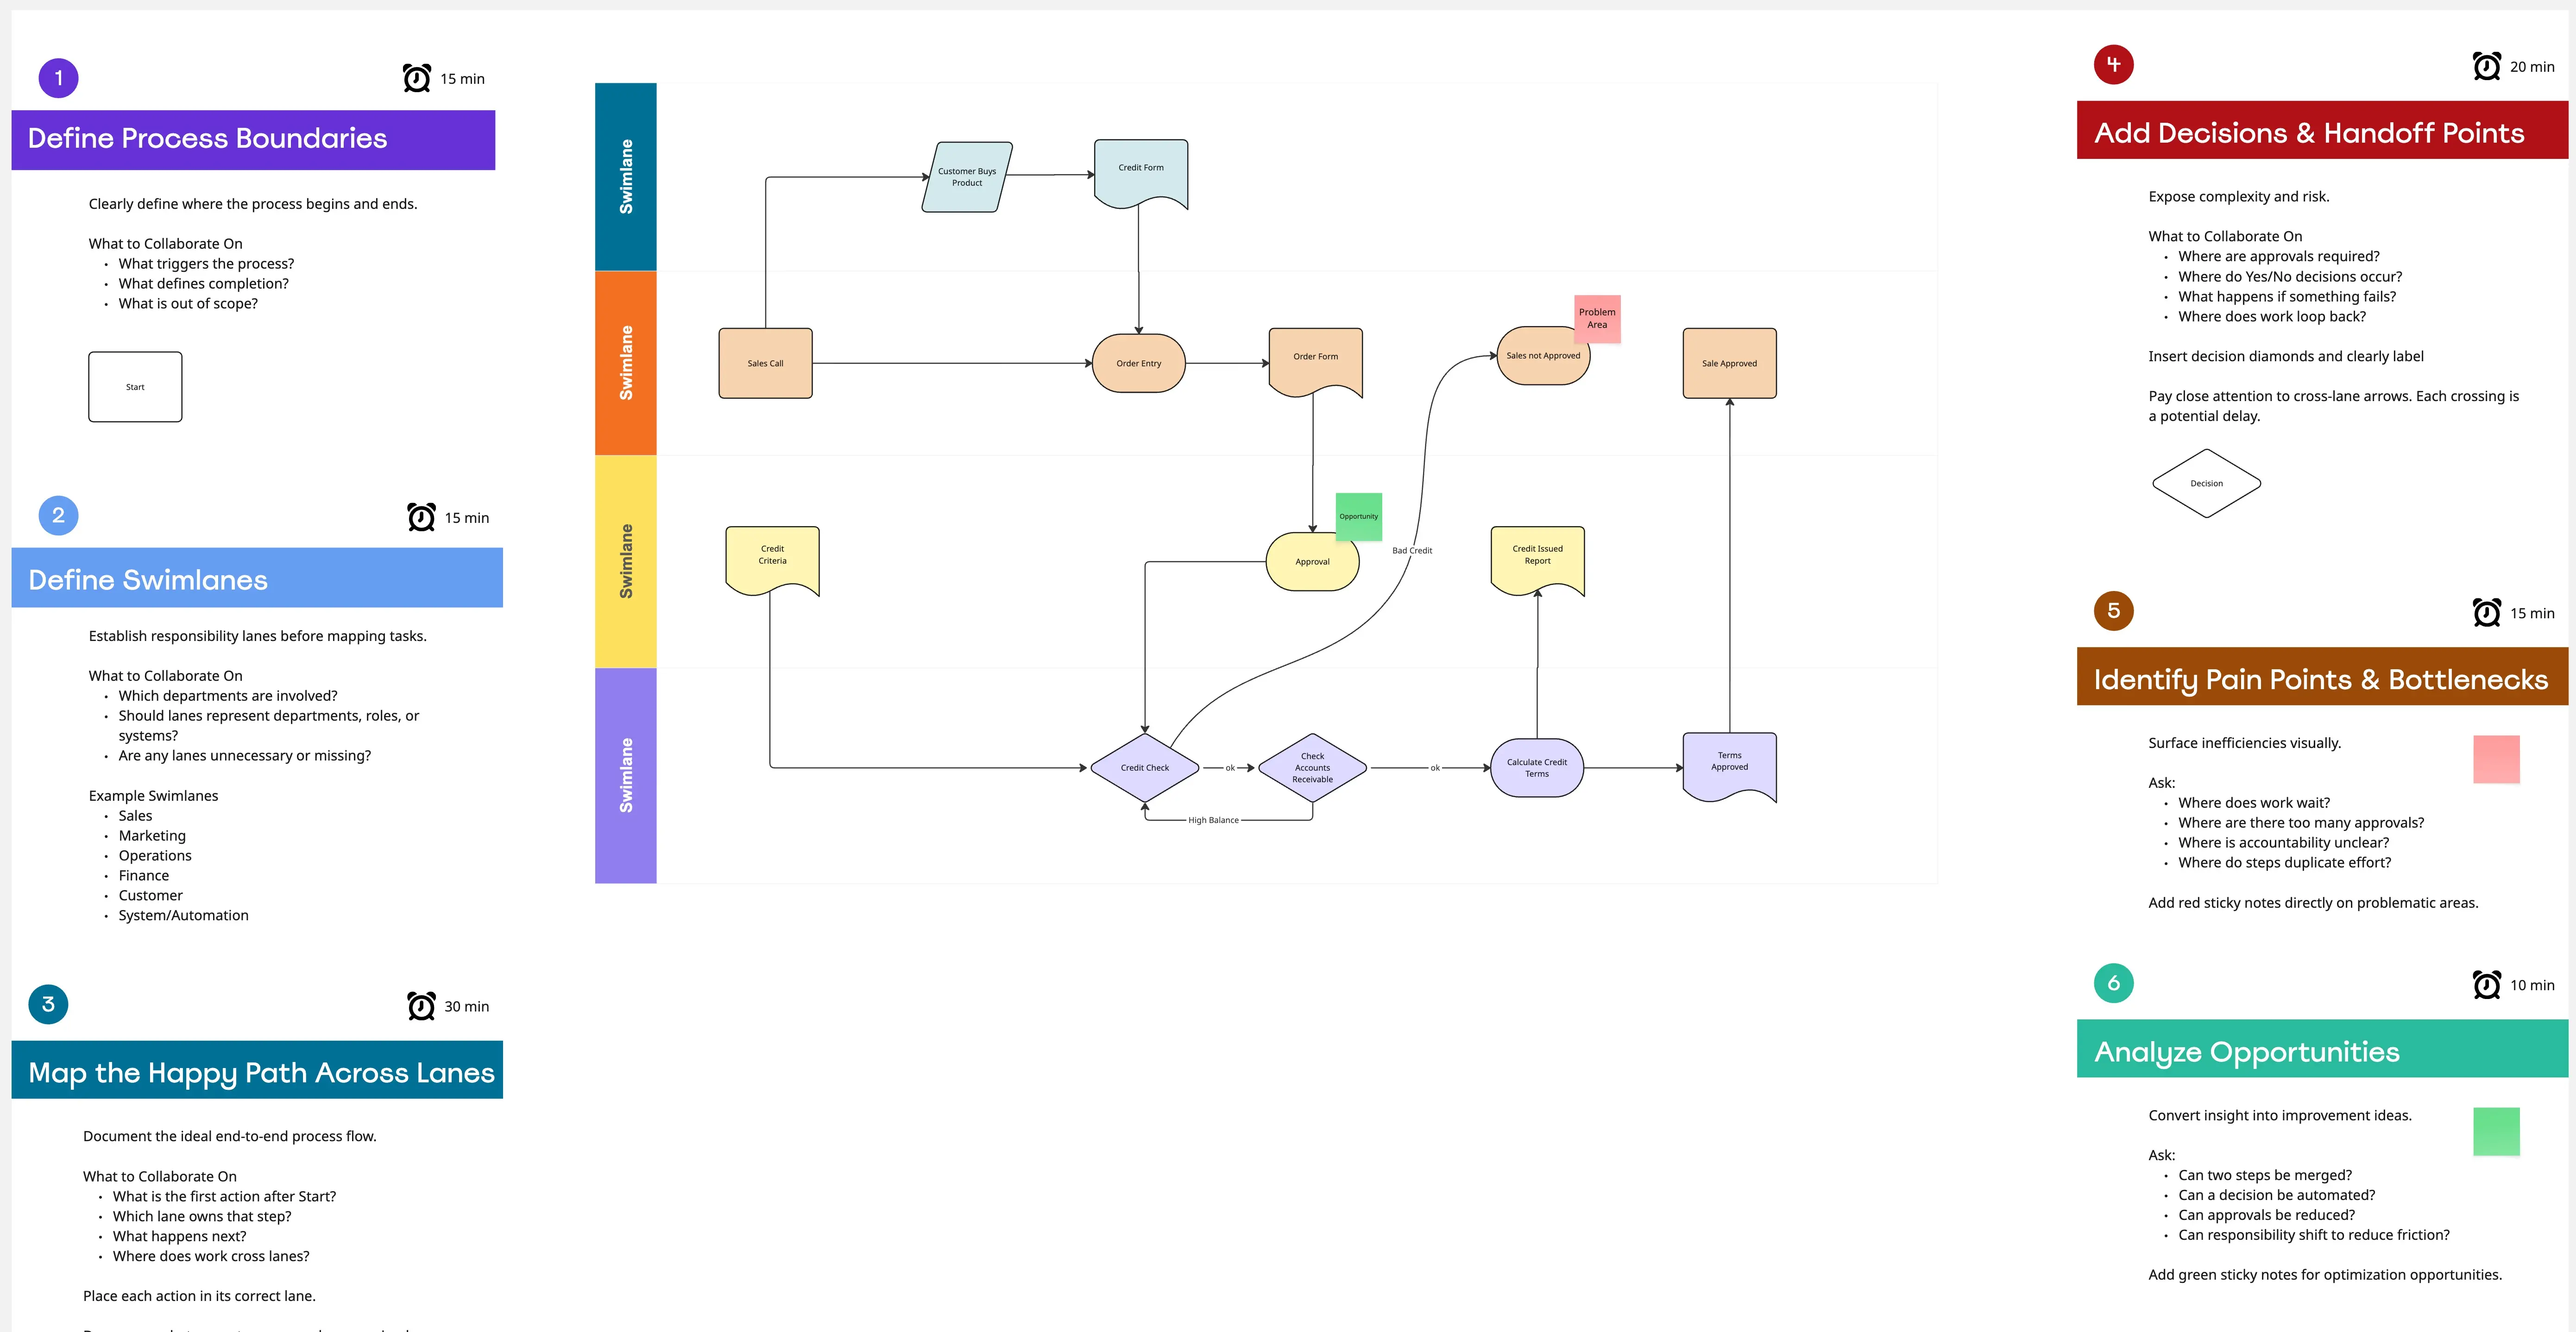
Step 6: Review the map
Are you in a good position to solve the problem? Does the process map look actionable and digestible?
Invite stakeholders to interrogate the map. Pay close attention to possible redundancies, bottlenecks, and problems with workflow. Go over each step to make sure they flow logically from one another. It might help to return to the documents from your brainstorm and make sure nothing was lost in translation.
Explore all template categories to find the perfect tools for brainstorming, planning, collaboration, and execution—designed to streamline your workflow and bring your ideas to life.