
When it comes to building an application that’s scalable and performant, it’s important to remember that humans are fallible — sometimes systems are too complex to keep in one’s head. And that’s okay! To stay organized and ultimately meet modern demand, it’s essential to have documentation that helps you visualize these systems.
We’ve covered how flowcharts can help people plan projects and improve workflows, but they can also come in handy for visualizing coding projects, too. Here’s how.
Almost all programs need to do the same thing over and over again in some form, and developers prefer not to repeat the same instructions multiple times. That’s where flowcharts and their loops are important — serving as a blueprint to help programmers visualize repetitive tasks so they can write more efficient code.
If you’re just getting started with programming, here’s a straightforward guide to flowchart loops.
What exactly is a flowchart loop?
To understand flowchart loops, let’s first briefly discuss looping in software. Looping is a core feature of most programming languages. It allows a developer to perform a task multiple times until some condition is met to stop the loop. To give a simple example, say you’ve just signed up for a SaaS tool, and they want you to confirm your email address. Internally, their system might do something like the following:
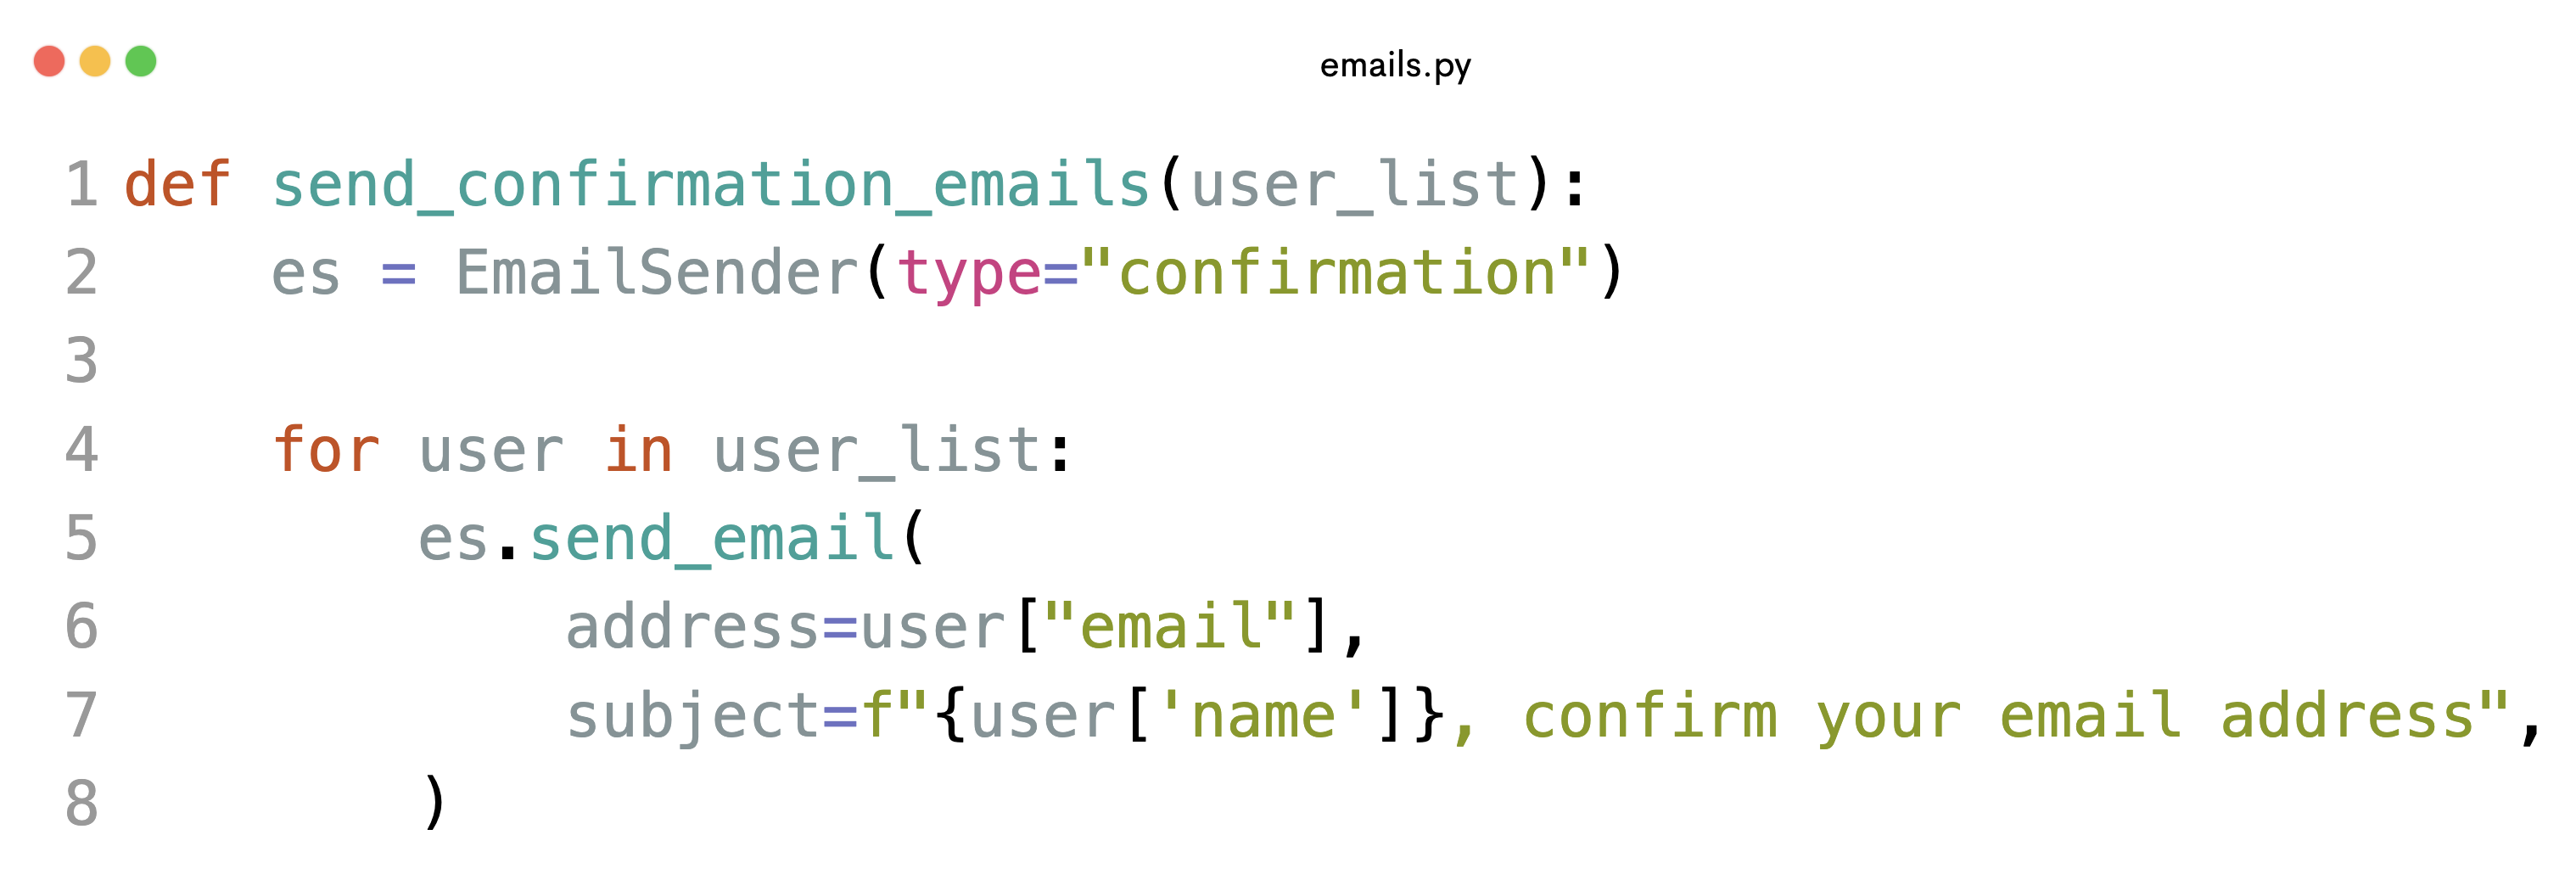
Source: https://codeimg.io/
When new users sign up, this function is passed a list of new users; the for loop goes through each new user and sends them a confirmation email. Using a loop in this context prevents repetition in the code.
A flowchart loop is a repeating pattern or sequence of actions represented in a flowchart that is meant to represent code, like the above sample. It uses symbols and arrows to map out certain steps or actions to perform repeatedly until a specific condition is met or a set number of iterations is reached.
For loop vs. while loop: What’s the difference?
There are two different kinds of flowchart loops: a for loop and a while loop. While they both establish criteria for when a loop should end, how they set that criteria is different.
Here’s a simple example: You need to color circles on a big picture. Building a flowchart loop would tell your program to keep coloring circles until you say stop.
A for loop and a while loop set those stopping points differently. How? Well, keep that coloring example in mind, and let’s take a closer look at each type of loop.
Understanding a for loop in a flowchart
You use a for loop when you either know exactly how many times a task should be repeated, or when you want to perform the same task on a list of items.
Let’s say that you know your picture has exactly 10 circles to color. Once the process kicks off, the for loop repeatedly checks how many circles have been colored. If it’s less than 10, the loop continues. But if it’s greater than 10, the loop ends.
Here are a few more terms you’ll encounter as you dig into flowchart loops:
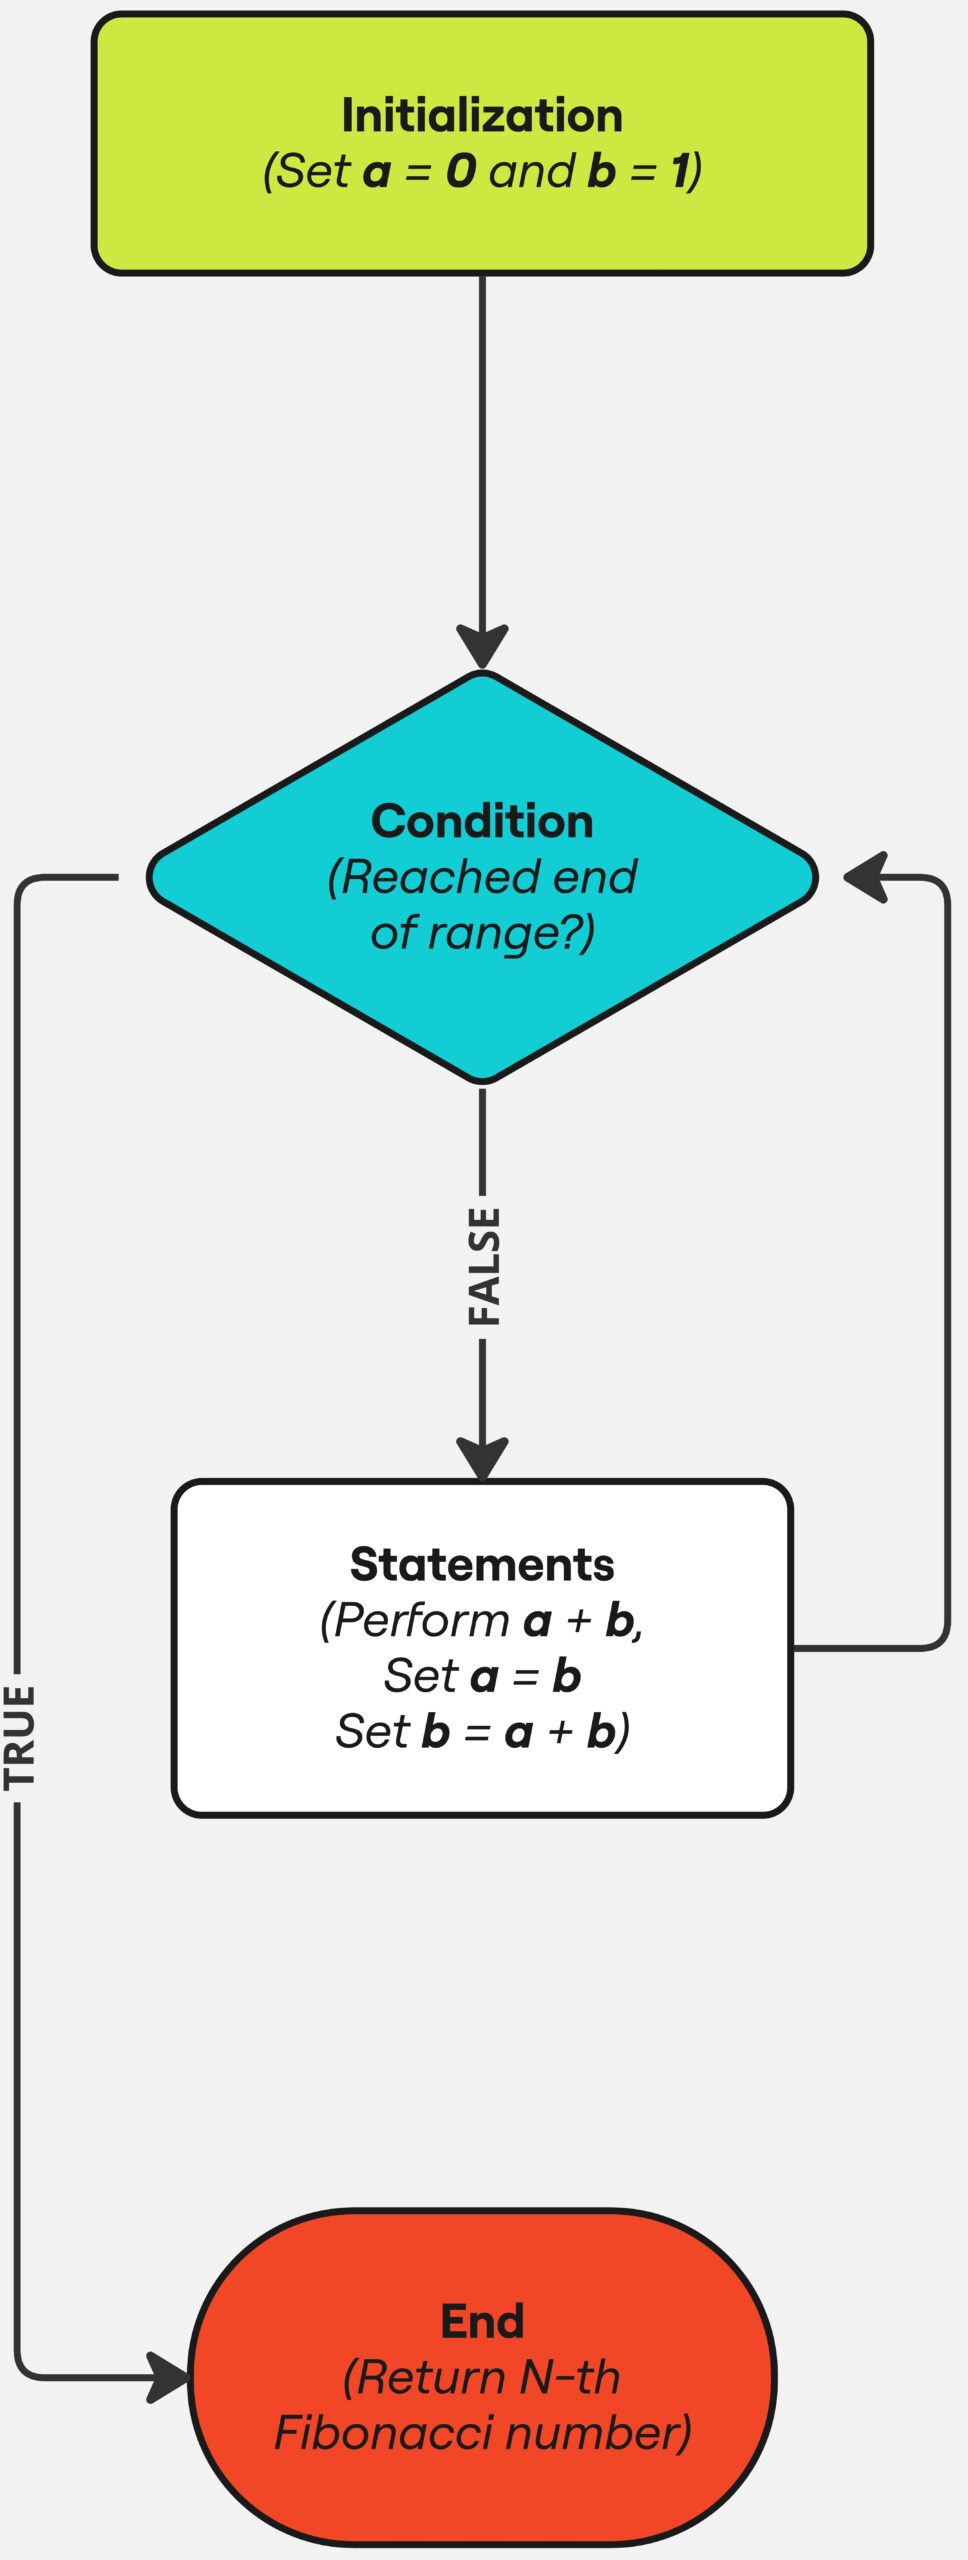
- Initialization: The start of the loop
- Condition: This is what is tested each time the loop repeats (“Have you colored less than 10 circles?”)
- Statement: This is the action that’s taken when the condition isn’t met (“Color another circle”)
- Increment/decrement: This increases or decreases the value of the variable (so you move from one colored circle to two). This is optional depending on the programming language.
Here’s what this loop looks like in a flowchart:

Let’s look at a different piece of code, and see how that would be represented in a Miro flowchart for loop.
One of the most famous mathematical sequences is the Fibonacci sequence. The sequence starts with the numbers 0, and 1, and each number after the first two is calculated by adding the previous two numbers. The first few terms are therefore: 0, 1, 1, 2, 3, 5, 8, and so on.
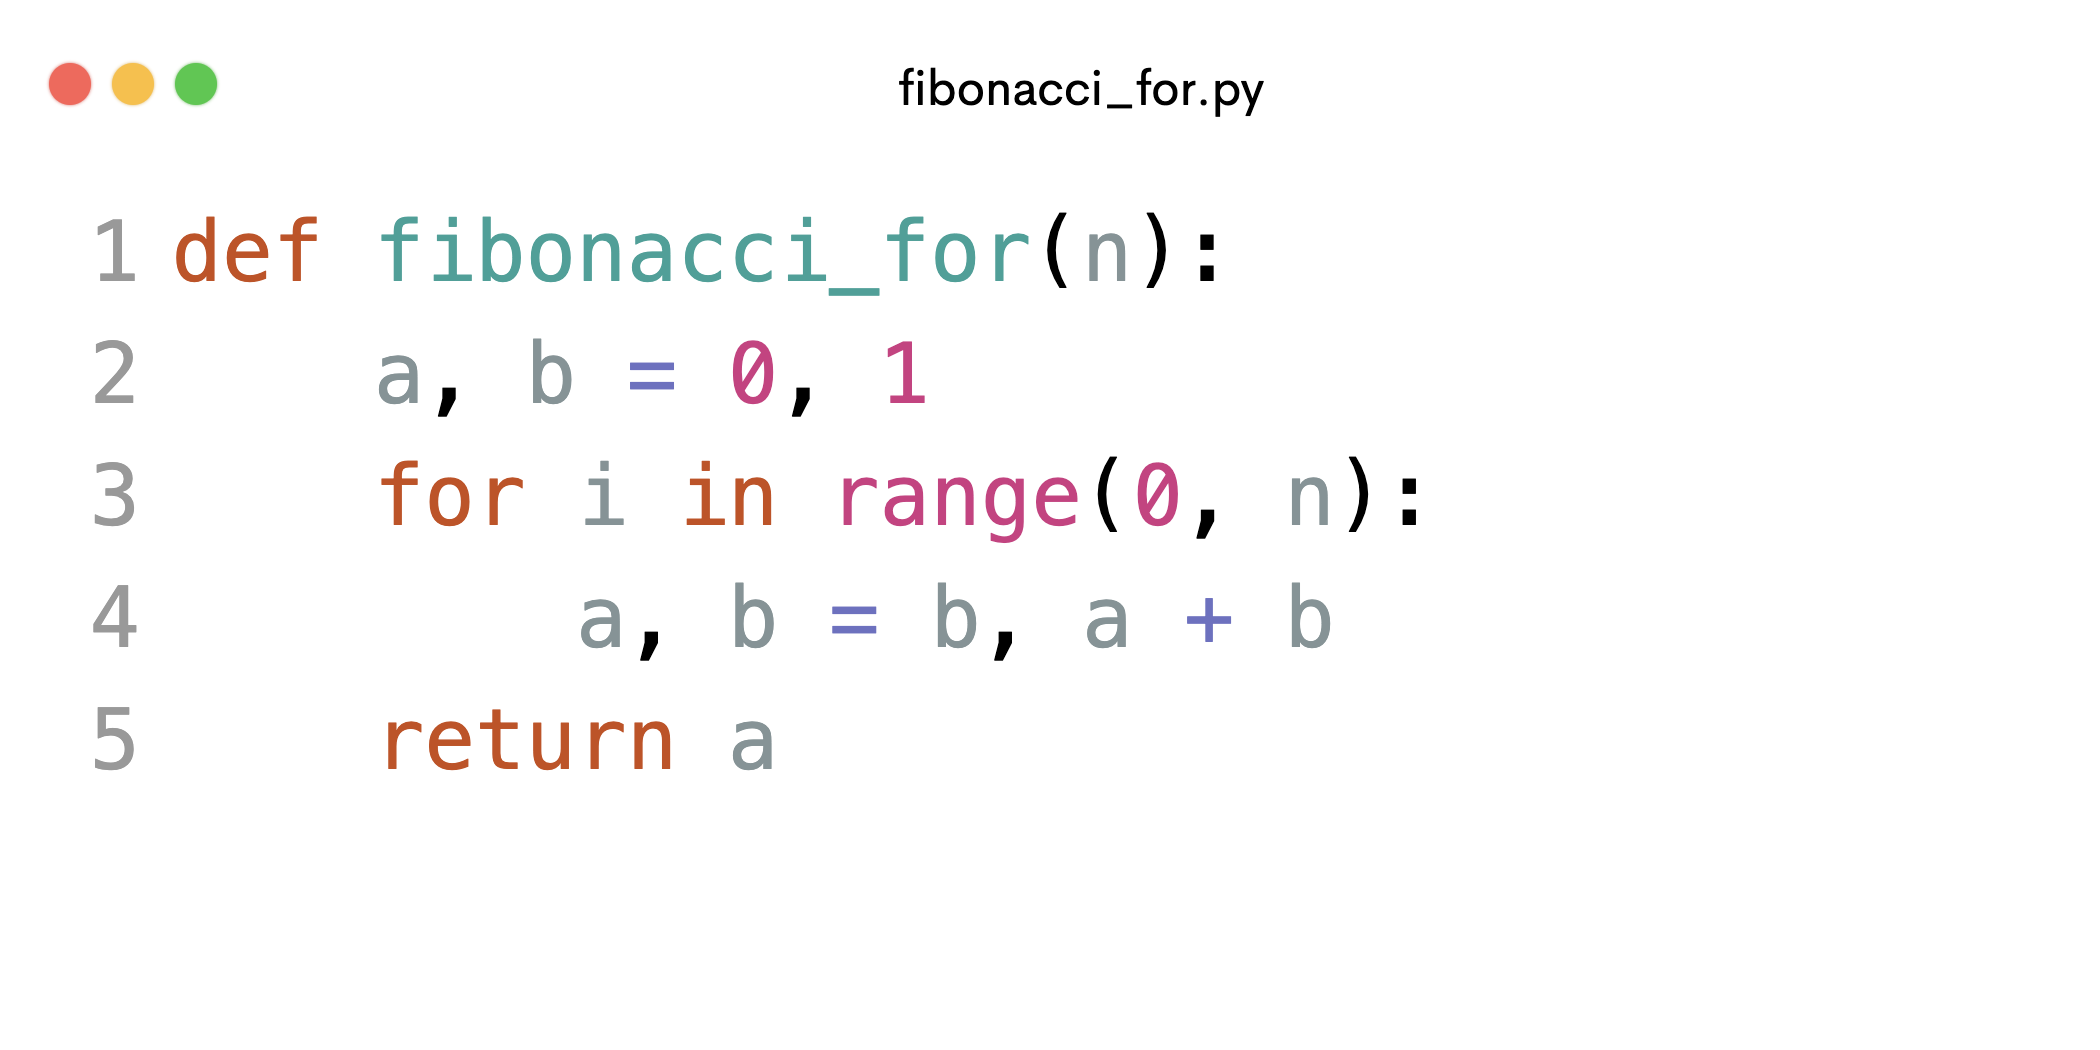
Source: https://codeimg.io/
Here’s what this loop looks like in a flowchart:
Understanding a while loop in a flowchart
You use a while loop when you’re not exactly sure how many times you need to repeat a task, but you do know that there’s a specific condition that needs to be true for the loop to continue.
Sticking with our coloring example, you could use a while loop to tell your program to keep coloring circles until you run out of the red crayon.
While the loop runs, it’ll continually check if there’s any red crayon left to color with. If there is, the loop continues. If there isn’t, the loop ends. Here’s a visual:

As we did previously with the for loop, we’ll again write the Fibonacci sequence, but this time using a while loop to show the capabilities of the flowchart while loop.
Source: https://codeimg.io/
Here’s what this loop looks like in a flowchart:
Looping it all together: Using flowchart loops as a blueprint for code
Most developers will tell you that, above all else, they love to open their code editor and start furiously typing away on a new project that has been brewing in their heads. When an idea strikes, it can be instantly translated into a piece of logic that’ll help them, their company or their communities achieve a goal. However, to bring magic to what they’re building, they need to be able to use tools beyond coding to visualize complex systems.
The above examples should give you a basic understanding of how loops work and how for and while loops are different. But keep in mind that, much like any other aspect of coding, flowchart loops can get pretty technical and complex.
Regardless of whether you’re using flowchart loops for something easy (like coloring circles or generating Fibonacci numbers) or something more involved (like adding up items in an online shopping cart), they’re the best way to visualize your code and help you write your program more efficiently as a result.
Want to get started? Check out Miro’s flowchart templates and see how easy it is to create your own.