Kubernetes Architecture Diagram Template
Visualize the deployment of your applications with Kubernetes Architecture Diagram template and optimize your processes.
Available on Enterprise, Business, Education plans.
About the Kubernetes Architecture Diagram Template
A Kubernetes Architecture Diagram template is where you can visually represent the deployment, scale, and management of containerized applications. You can use a Kubernetes Architecture Diagram template to manage apps and ensure there is no downtime in production.
This Kubernetes Architecture Diagram for K8 architecture helps you and your team manage the deployment of applications. This template can be used to organize applications and easily map out Kubernetes decentralized architecture.
Kubernetes cluster architecture and components
When you deploy Kubernetes, you get a cluster which is a node that runs containerized applications.
Developers use containers because they provide extra benefits such as agile app creation, deployment, and continuous development and integration. Containers are coordinated automatically and monitored constantly, and the K8s architecture makes it easy to deploy and scale containerized applications.
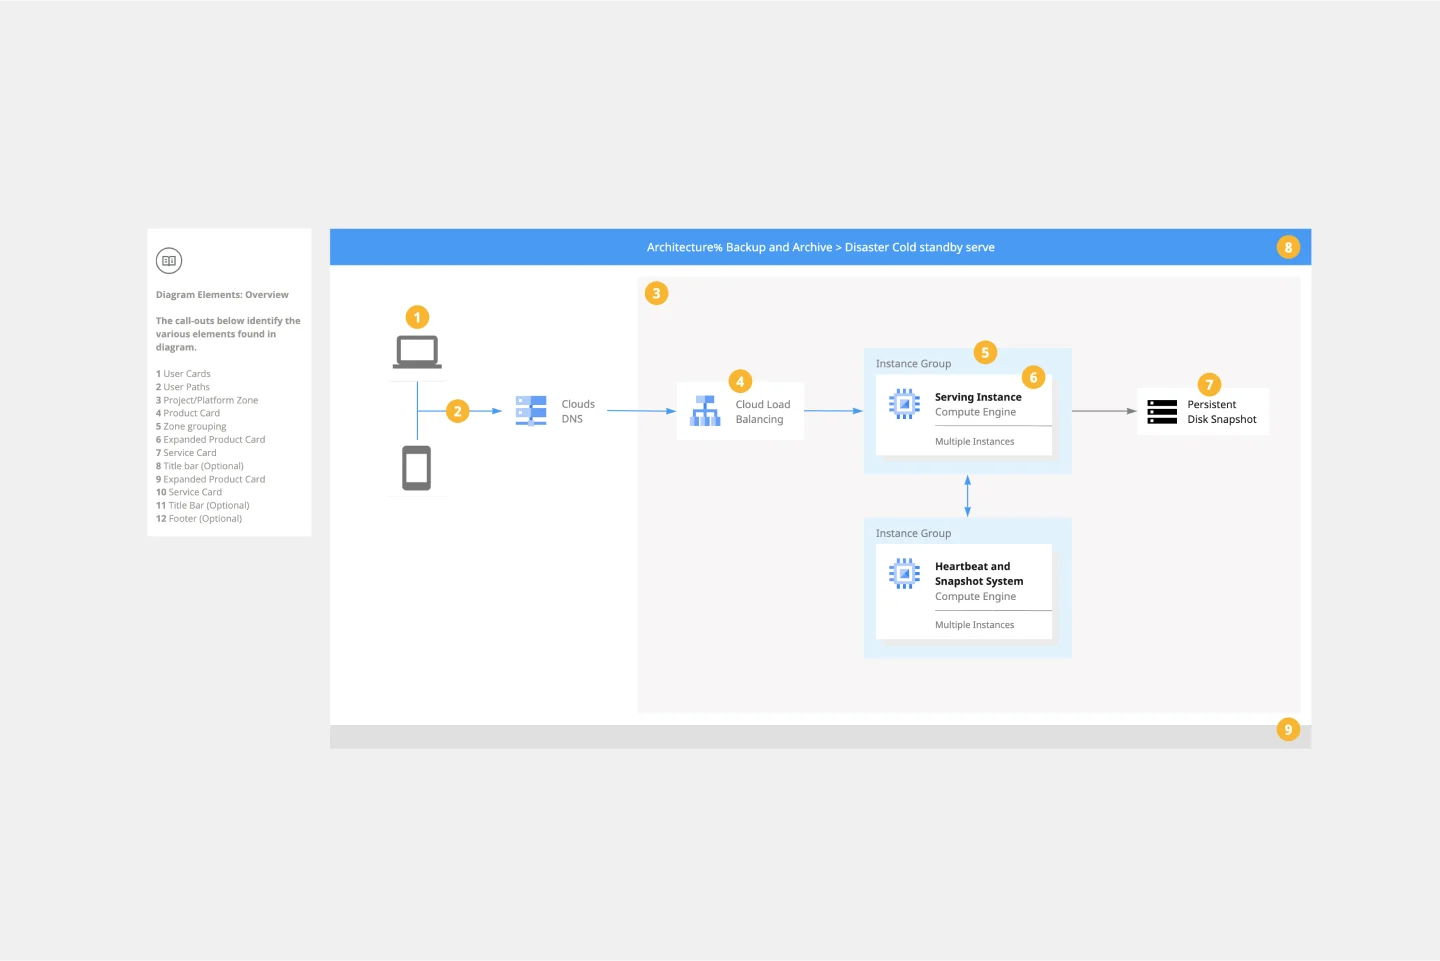
The components of a Kubernetes Architecture Diagram template are:
Cloud controller manager: links your cluster to the cloud provider
Controller manager: makes global decisions about the cluster
Etcd (persistent store): backs store for all cluster data
Kubelet: runs each node in the cluster
Kube proxy: network proxy that runs in each node of the cluster
Scheduler: watches for newly created Pods with no assigned node, and selects a node for them to run on
Control place: runs controller processes
Node: provides Kubernetes runtime environment
How do I create a Kubernetes Architecture Diagram template?
A Kubernetes Architecture Diagram template allows you to visualize the deployment of apps.
To create a basic Kubernetes diagram with Miro, you can follow these steps:
Define your Kubernetes Architecture cluster.
List your Kubernetes components, using our set of Kubernetes Icons.
Organize your diagram, adding the components.
Add connection lines between the component shapes and set the arrows in the direction of the flow.
Format and customize your Kubernetes Architecture Diagram template.
In Miro, you can quickly build a Kubernetes Diagram from scratch using our design tools and icons set, or use our Kubernetes Architecture Diagram template and customize it as you see fit.
Miro is the perfect cloud and network diagram tool with many available shape packs, icons, and templates, ranging from Kubernetes architecture to AWS to Cisco, and many more!
How to create a Kubernetes diagram using this template?
In Miro you can create a Kubernetes Architecture Diagram using our template from our Templates Library or build your own diagram from scratch. Add Kubernetes icons by selecting our icons set on the left sidebar, connecting them with connector lines, and placing arrows in the flow direction. Miro’s collaborative whiteboard allows you to work together in real-time or asynchronously. Try it for yourself to see how it can work for you.
Why is it important to diagram Kubernetes architecture?
Developers create a Kubernetes Architecture Diagram to better manage and deploy application containers and continuously improve development, integration, and app deployment. Having a Kubernetes diagram helps to work across teams and to keep collaboration seamlessly when managing applications.
Get started with this template right now. Available on Enterprise, Business, Education plans.
Miro x AWS: Accelerate your cloud journey
Works best for:
Diagramming
The Miro x AWS: Accelerate your cloud journey template offers a visual framework for planning and executing cloud migration and optimization projects using Amazon Web Services (AWS). It provides elements for mapping out cloud architectures, migration strategies, and cost optimization initiatives. This template enables teams to collaborate effectively, align on objectives, and accelerate their cloud journey with AWS services. By promoting collaboration and alignment, the Miro x AWS template empowers organizations to leverage AWS cloud technologies efficiently and achieve their business objectives effectively.
Onion Diagram Template
Works best for:
Diagramming, Mapping and Diagramming
The Onion Diagram Template is a distinct tool designed to visually represent layers of a specific concept, system, or process, akin to the layers of an onion. Each concentric layer of the diagram provides insights into a different aspect or phase of the topic at hand, moving from the core foundational element outwards to more peripheral components. One of the prime benefits of this template is its ability to offer hierarchical clarity. Users can immediately discern the importance, sequence, or interrelation of different elements within a system, facilitating enhanced comprehension and efficient decision-making.
Value Stream Mapping Template
Works best for:
Project Management, Strategic Planning, Mapping
A value stream map can help you refocus your business on steps that actually provide value to your customers, cutting out wasteful and inefficient processes. With this template, you and your process team can collaborate on a value stream map today.
Cloudflare Content-based Asset Creation Template
The Cloudflare Content-based Asset Creation Template enhances efficiency and collaboration within teams working on cloud infrastructure projects. This template provides a structured and intuitive framework for creating and managing digital assets, which streamlines the asset creation process.
Login Sequence Diagram Template
Works best for:
Diagramming, Technical Diagramming
The UML Sequence Login Diagram Template is a valuable tool for visualizing user authentication processes. It breaks down complex login sequences into clear, visual components, facilitating collaborative understanding among team members, regardless of their technical expertise. This shared understanding is crucial for ensuring all stakeholders, from developers to project managers, are on the same page, leading to efficient decision-making and a smoother development process. The template's ability to translate technical details into an accessible format streamlines communication and significantly reduces the likelihood of misinterpretation or oversight, making it an essential asset in any software development project.
Customer Journey Mapping Template Pack
Works best for:
Mapping, User Experience, Workshops
A customer journey map (CJM) is a visual representation of your customer’s experience. It allows you to capture the path that a customer follows when they buy a product, sign up for a service, or otherwise interact with your site. Most maps include a specific persona, outlines their customer experience from beginning to end, and captures the potential emotional highs and lows of interacting with the product or service. Use this template to easily create customer journey maps for projects of all kinds.