
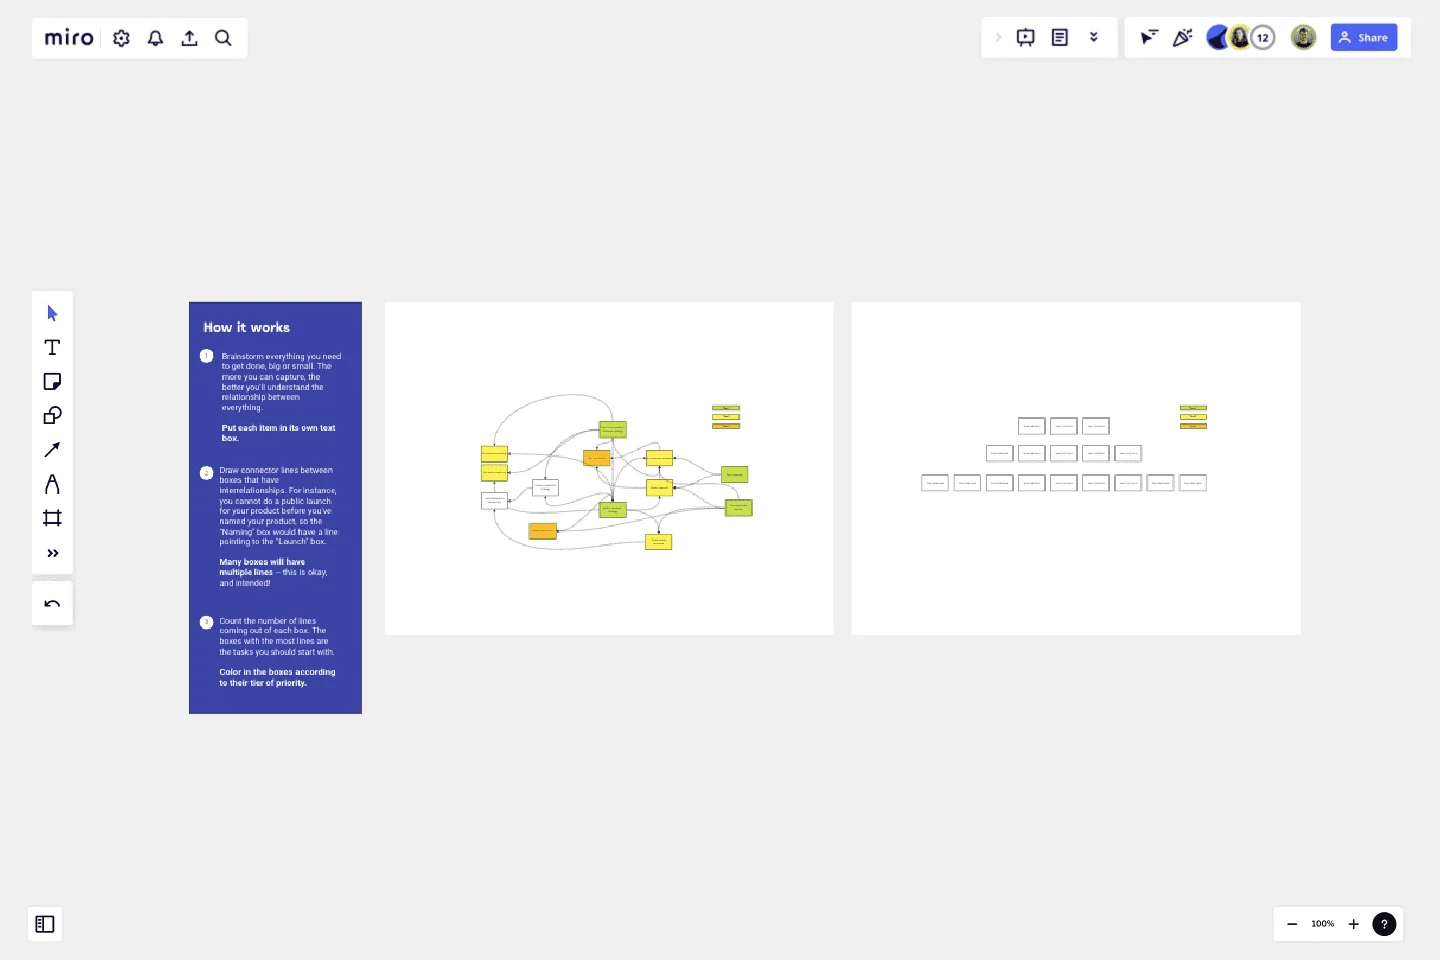
Interrelationship Diagram
Great for new projects, upcoming launches, brand-new businesses, and getting unstuck in general!
Great for new projects, upcoming launches, brand-new businesses, and getting unstuck in general!
This template is for anyone working through a complex project and struggling to understand where to begin. An interrelationship diagram will help you see how all your tasks relate to one another and where to prioritize your time first. By connecting the dots between tasks, you can see which ones are the most critical and interdependent.
Get started with this template right now.
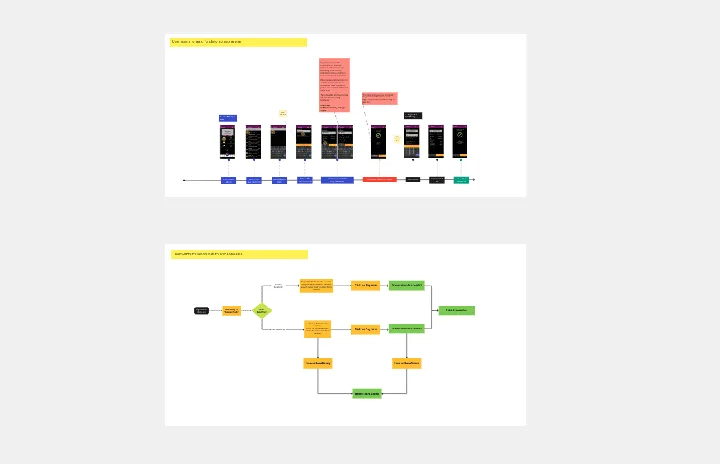
Bank Mobile App User Journey
Works best for:
Diagramming
The Bank Mobile App User Journey template offers a visual framework for mapping out the user experience journey within a banking mobile application. It provides elements for visualizing user interactions, touchpoints, and emotions throughout the journey. This template enables teams to understand user needs, pain points, and opportunities for improvement, facilitating the design of user-friendly and intuitive banking apps. By promoting empathy and user-centric design, the Bank Mobile App User Journey template empowers teams to create digital experiences that meet customer expectations and drive engagement.
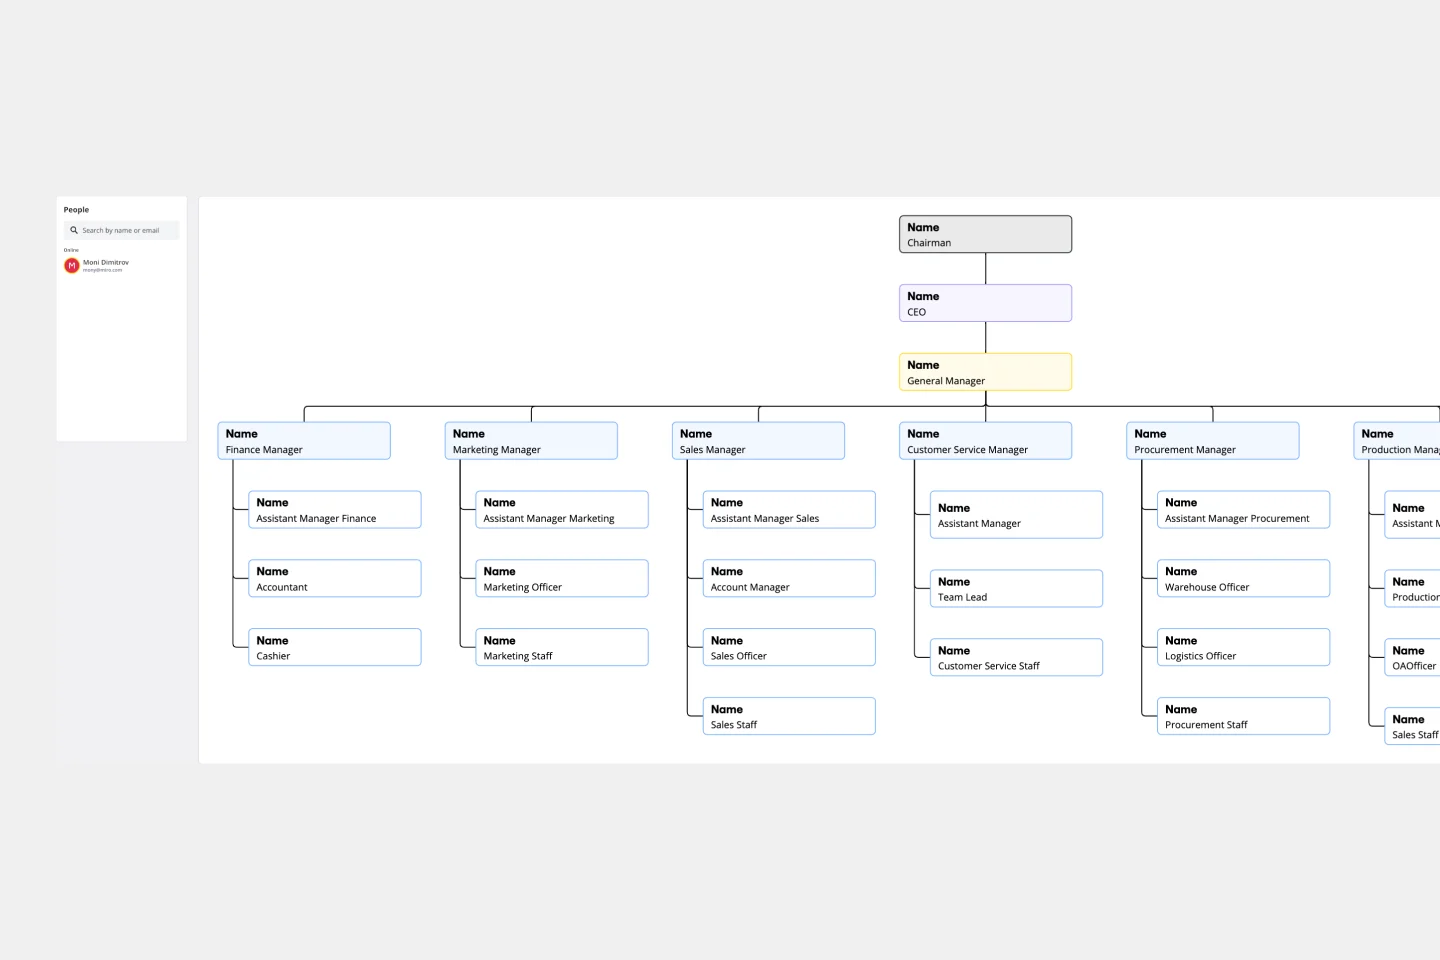
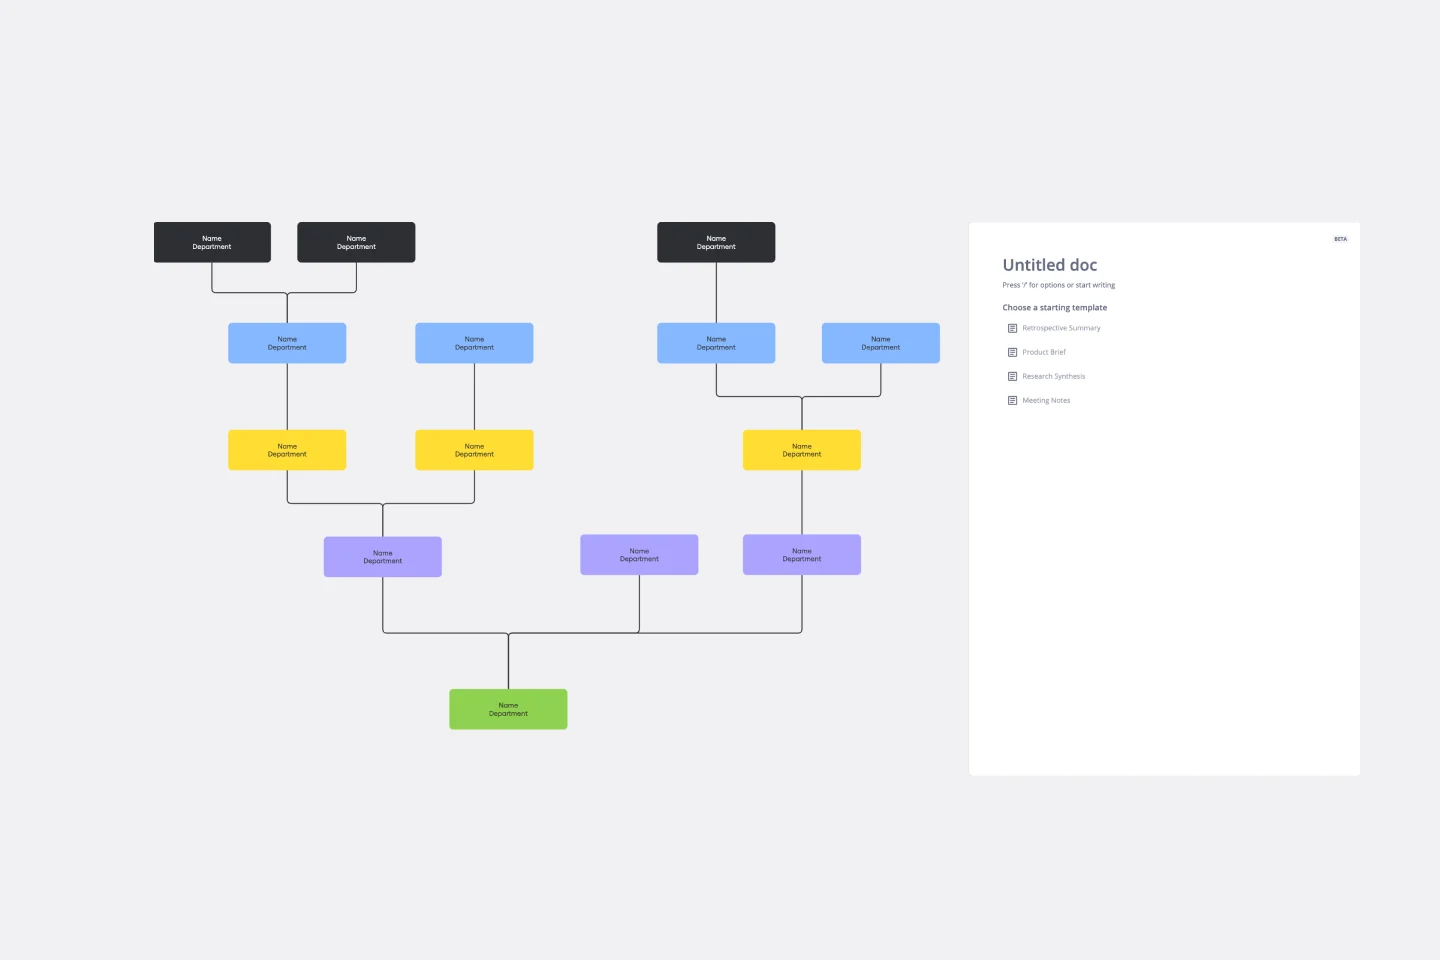
Vertical Organizational Chart
Works best for:
Organizational Charts, Organizational Design
The Vertical Organizational Chart Template is an efficient way to illustrate the hierarchy of an entity in a top-down format. This tool helps represent roles and relationships in a clear manner, starting from the topmost authority and branching downwards. It allows for a better understanding of the flow of responsibilities and communication channels within the organization. One of its most significant advantages is promoting clear communication. Depicting the organization's structure helps avoid misunderstandings and ensures everyone is on the same page regarding the chain of command.
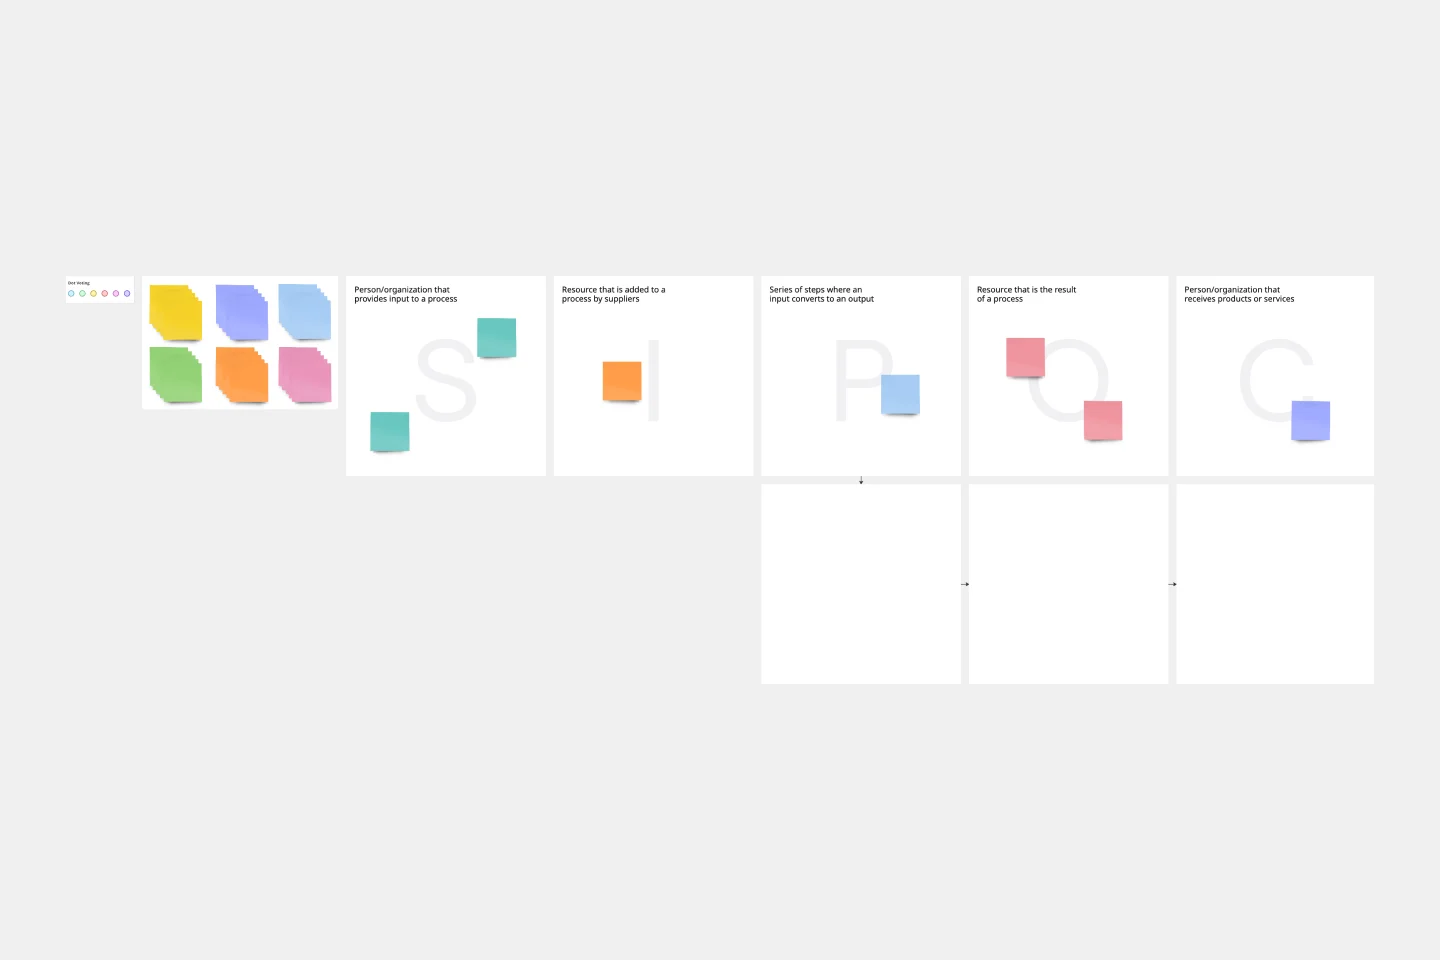
SIPOC Template
Works best for:
Agile Methodology, Strategic Planning, Mapping
A SIPOC diagram maps a process at a high level by identifying the potential gaps between suppliers and input specifications and between customers and output specifications. SIPOC identifies feedback and feed-forward loops between customers, suppliers, and the processes and jump-starts the team to think in terms of cause and effect.
Miro x AWS: Accelerate your cloud journey
Works best for:
Diagramming
The Miro x AWS: Accelerate your cloud journey template offers a visual framework for planning and executing cloud migration and optimization projects using Amazon Web Services (AWS). It provides elements for mapping out cloud architectures, migration strategies, and cost optimization initiatives. This template enables teams to collaborate effectively, align on objectives, and accelerate their cloud journey with AWS services. By promoting collaboration and alignment, the Miro x AWS template empowers organizations to leverage AWS cloud technologies efficiently and achieve their business objectives effectively.
Inverted Org Chart Template
Works best for:
Org Charts, Organizational Design
The Inverted Org Chart Template is a tool that reimagines the traditional hierarchical model by placing frontline employees at the top of the organizational structure. This innovative approach highlights the crucial role played by those who interact with customers directly, ensuring that their insights and contributions are not only recognized but also celebrated. One of the key advantages of this template is that it fosters a feedback-driven environment. Prioritizing frontline workers promotes a culture where valuable insights from the ground can quickly reach the top of the hierarchy, streamlining decision-making processes and ensuring that strategies are based on real-world experiences.
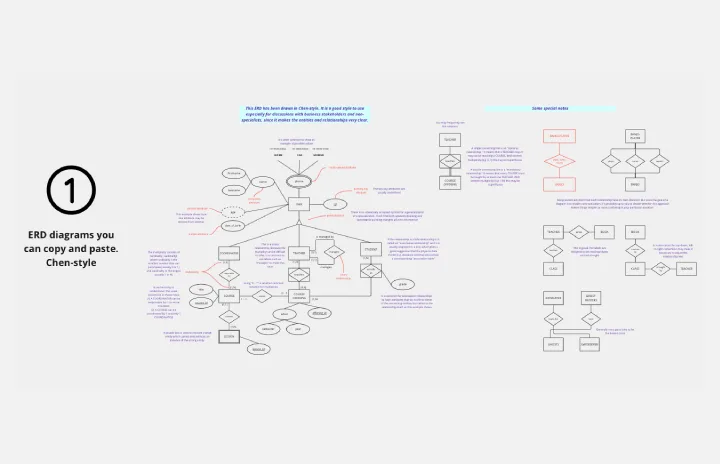
UML ERD Diagram
Works best for:
Diagramming, UML Diagram
This template contains a few Entity-Relationship diagrams that you can re-use for your own work.