Fault Tree Analysis Template
Bring clarity to complex scenarios with a Fault Tree Analysis. Streamline your approach to problem-solving and quickly identify system malfunctions.
About the Fault Tree Analysis Template
Navigating the complexities of system failures can be a daunting task. However, with the right tools, it becomes significantly easier. The Fault Tree Analysis (FTA) Template is an instrument designed to provide a structured approach to break down and analyze potential causes of system malfunctions visually.
What's a fault tree analysis template?
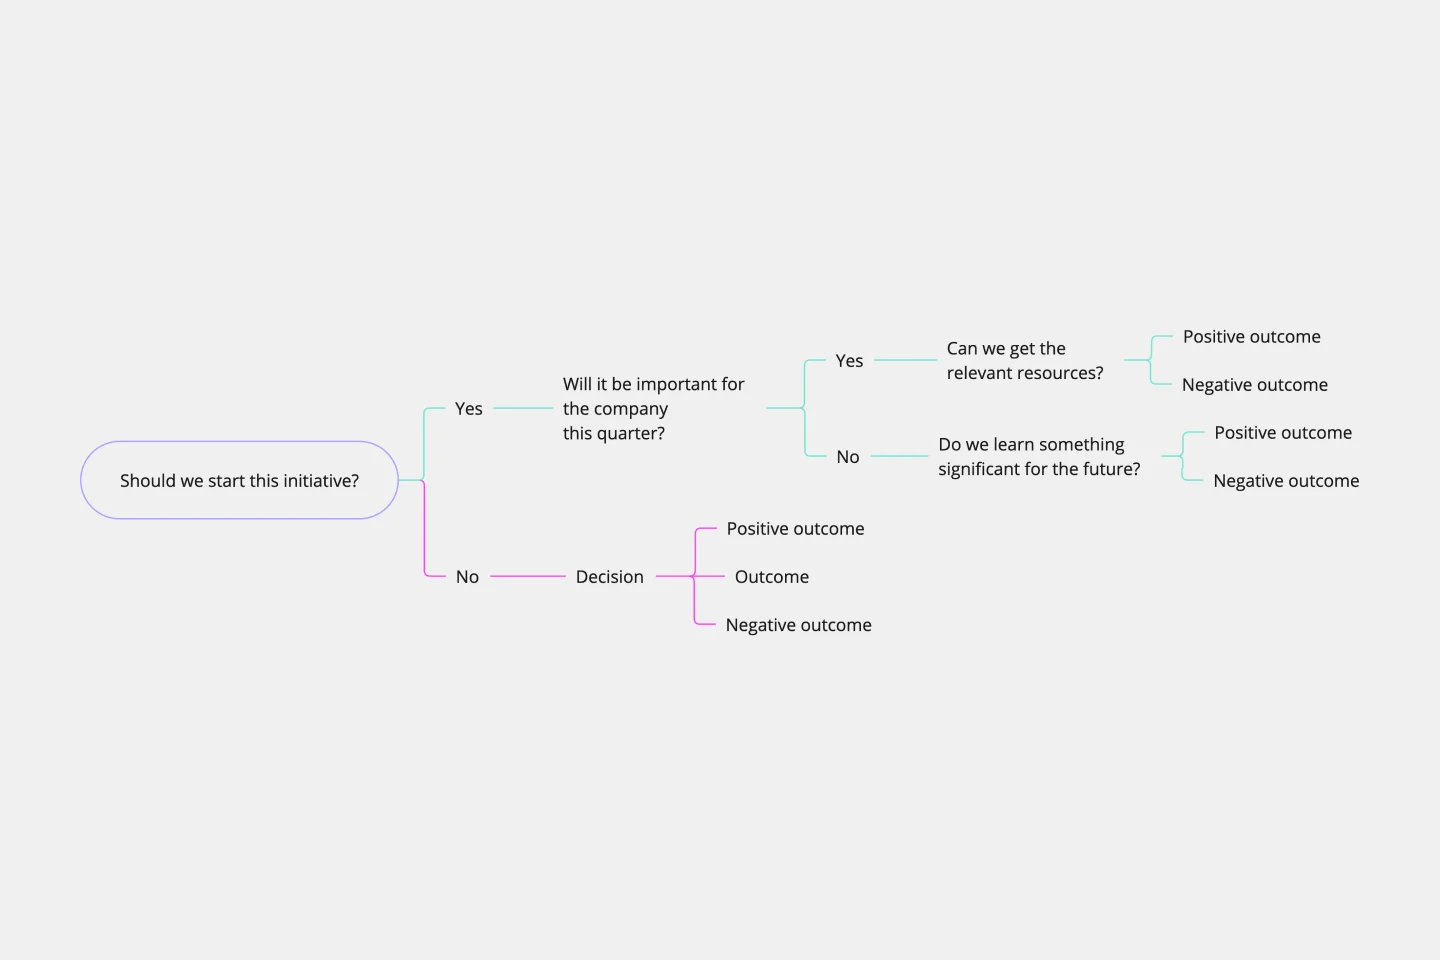
A fault tree analysis template is a diagrammatic representation of a system's possible malfunctions or failures. The template consists of a combination of logical symbols, visually breaking down the causes and effects and showcasing how one particular failure can result from various combinations of different losses. It's a powerful tool to identify vulnerabilities in any system or process.
Why use a fault tree analysis template?
Delving into the complexities of any system can reveal potential vulnerabilities. To efficiently navigate and address these vulnerabilities, it's crucial to have the right tool at hand. Here's why the fault tree analysis template is an essential tool for many professionals:
Clarity in complex situations: Fault tree diagrams present a visual map of potential problems and their root causes, making it easier to grasp intricate scenarios.
Predictive power: One can anticipate and mitigate risks by understanding the potential faults and their causal relations.
Efficient problem-solving: A clear view of all possible malfunctions helps prioritize interventions and target the most critical issues.
Enhanced communication: The visual nature of the template enables teams to have more structured and effective discussions about system vulnerabilities.
How to use the fault tree analysis template:
Leveraging the FTA template in Miro couldn't be easier.
Editing the template: Customize the template with a few clicks to tailor it to the specific complexities of your system or process. Change the content by double-clicking the shapes or editing the look and feel by clicking on the context menu bar.
Expansion: Develop the tree further by adding branches and nodes as you uncover more potential faults and their causes. Expand your fault tree by clicking on the shape and selecting the plus icon.
If you'd prefer to start from scratch, diagramming with Miro is easy. Choose from a wide range of diagramming shapes in Miro's extensive library, and start diagramming directly on your board.
Is the Fault Tree Analysis Template suitable for all industries?
From IT to manufacturing, healthcare to finance – the template can be customized to analyze failures across any system or process in any industry.
Can multiple team members collaborate on the FTA in real time?
Yes, Miro allows multiple users to collaborate on the board in real time, making it perfect for team discussions and brainstorming sessions.
How detailed should my FTA be?
The depth of your FTA depends on your specific needs. While a high-level overview can provide quick insights, a detailed analysis can help thoroughly understand and mitigate all potential risks.
Get started with this template right now.
BPM
Works best for:
Diagramming
The BPM (Business Process Management) template is a visual tool for modeling, analyzing, and optimizing business processes. It provides a structured framework for documenting process flows, identifying bottlenecks, and improving efficiency. This template enables organizations to streamline operations, enhance productivity, and drive business performance. By promoting process transparency and agility, the BPM template empowers teams to achieve operational excellence and deliver value to stakeholders.
ICS Org Chart Template
Our carefully crafted ICS Org Chart Template is an invaluable tool designed to clearly represent the hierarchical structure of the Incident Command System (ICS). It simplifies the complex web of roles, responsibilities, and chains of command within the ICS, providing a structured blueprint for both experienced professionals and those new to the system. The template's most notable benefit is its ability to foster immediate understanding, bridging the gap between intricate organizational structures and the teams navigating them. Teams that use this template can ensure that everyone is aligned, understands their role, and collaborates efficiently, thereby reducing potential bottlenecks and misunderstandings.
Workflow Diagram Template
Works best for:
Diagramming, Mapping, Process mapping
The Workflow Diagram Template maps out and represents processes or systems using standardized symbols and shapes. By delineating the various steps or stages in a process, it ensures that tasks flow seamlessly from initiation to completion. One of the standout benefits of using this template is its clarity. By translating processes into a visual format, all participants can gain a comprehensive understanding at a glance, eliminating confusion and ensuring everyone is on the same page. This clarity not only promotes efficient task execution but also fosters collaboration among team members.
Genogram Template
Works best for:
Diagramming
The Genogram Template maps out family structures and relationships with exceptional depth and detail. Unlike traditional family trees, this template provides a comprehensive perspective by encapsulating familial connections, emotional ties, and significant life events. Create a genogram to unearth patterns and trends within a family, whether hereditary or environmental. Professionals across different domains can gain a holistic understanding of familial dynamics by showing deep insights into the nuances of relationships, facilitating better communication and problem-solving.
UML ERD Diagram
Works best for:
Diagramming, UML Diagram
This template contains a few Entity-Relationship diagrams that you can re-use for your own work.
Venn Diagrams by Dave Westgarth
Works best for:
Venn Diagram
Visualize relationships and intersections clearly with the Collection Venn Diagram template. This tool is perfect for comparing multiple sets of data, identifying commonalities, and showcasing unique elements. Use it in presentations, research, and data analysis to make complex information more digestible. Ideal for educators, researchers, and analysts seeking to present data insights effectively.