Cladogram Template
Easily explain evolutionary relationships with the Cladogram Template.
About the Cladogram Template
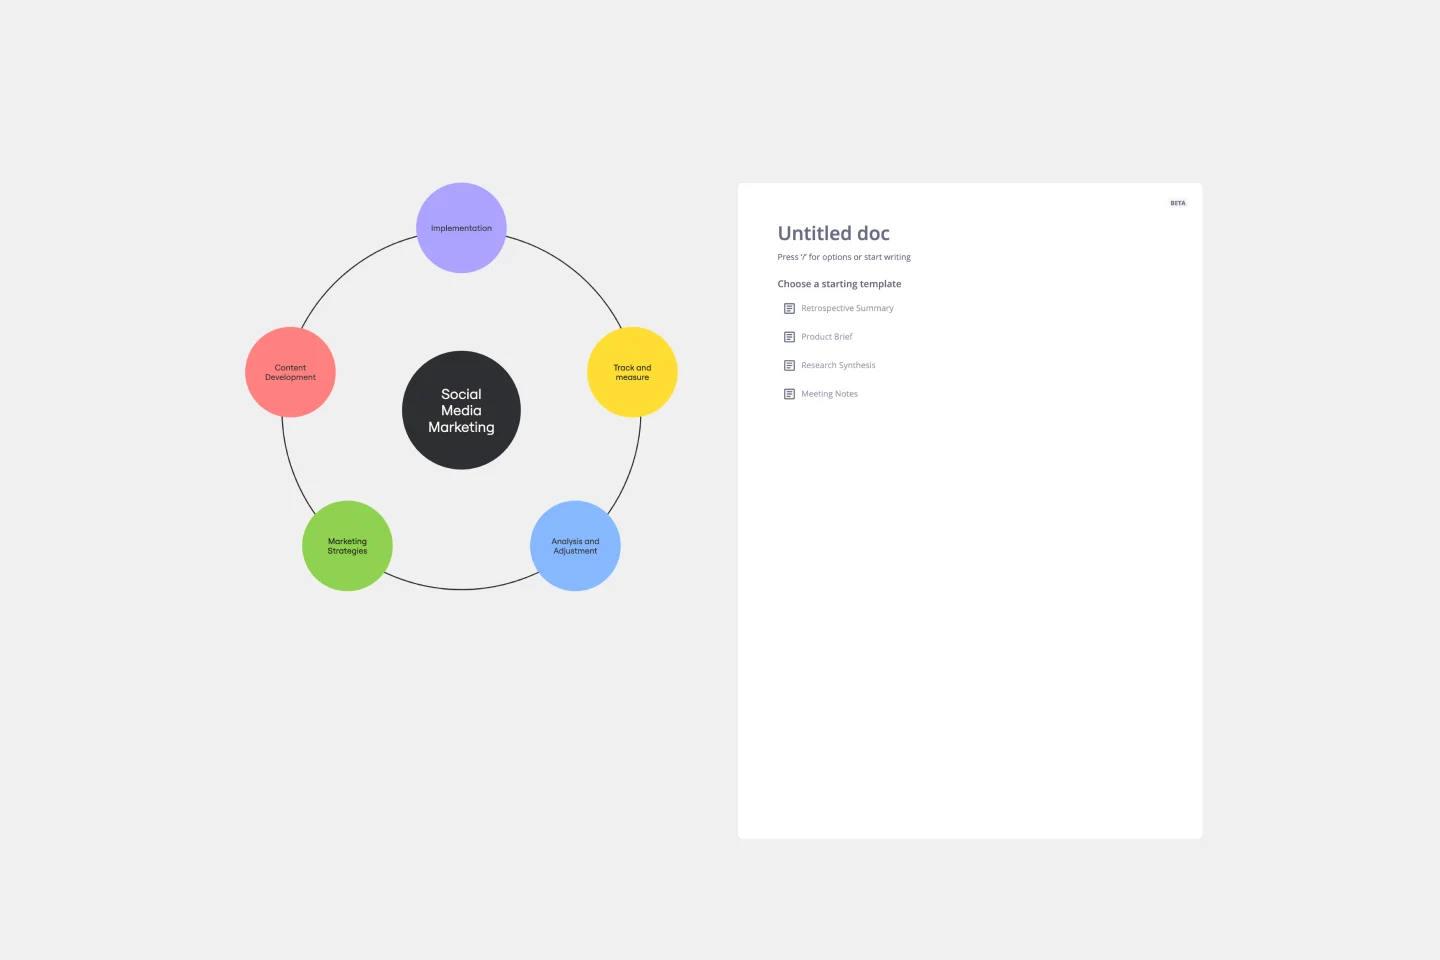
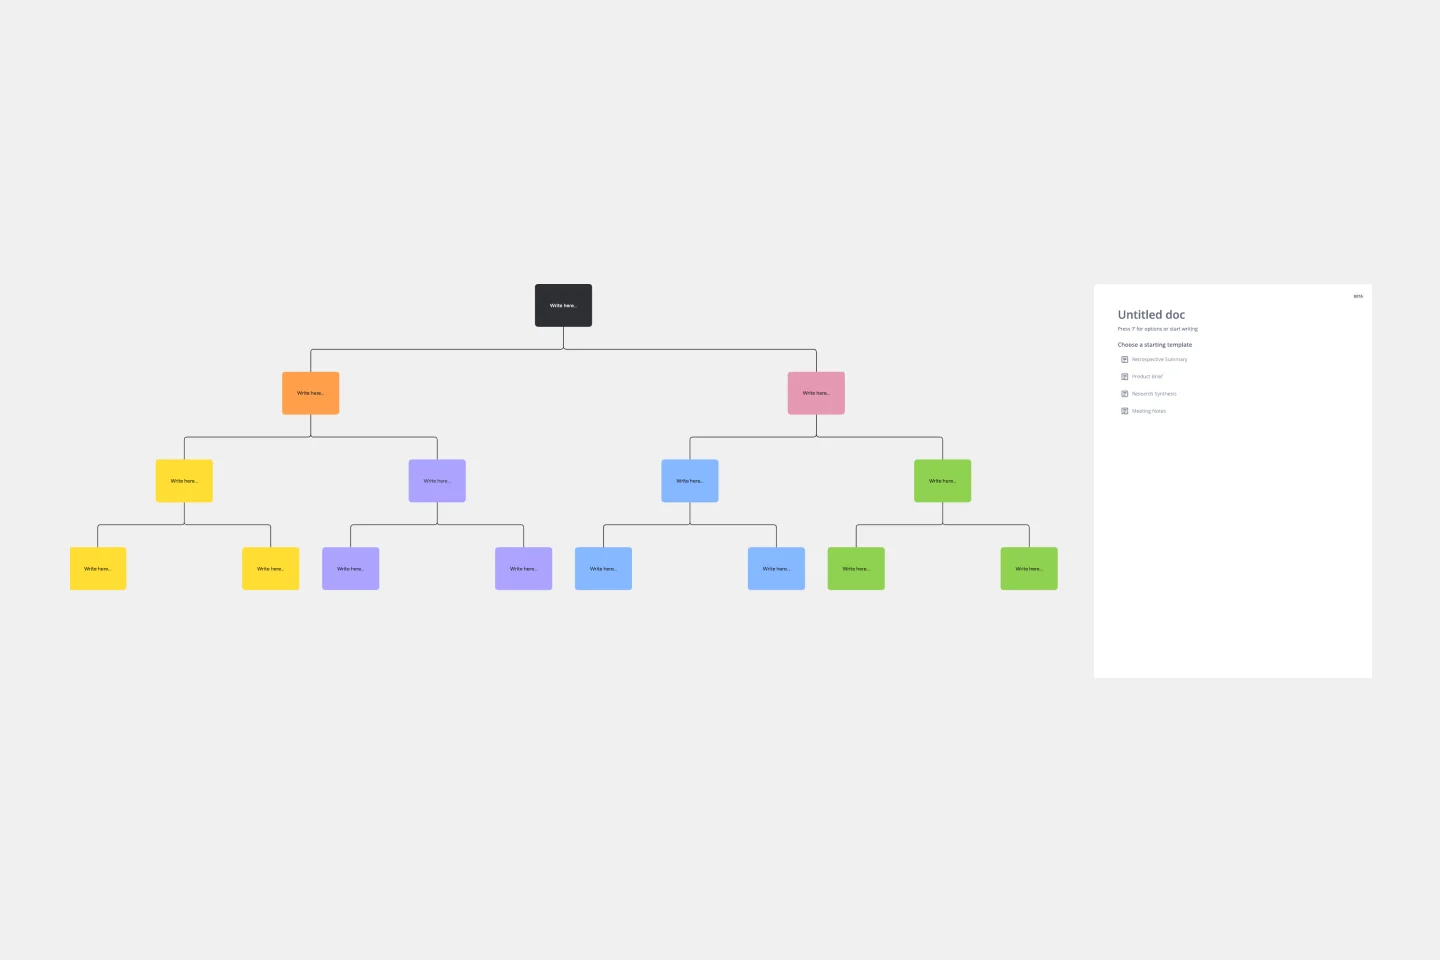
The Cladogram Template is a helpful visual tool that simplifies the representation of evolutionary relationships among different species or concepts. A cladogram is a branching diagram that displays the connections between various entities based on shared characteristics and evolutionary divergence.
The template enables users to easily create, edit, and expand cladograms. It's a powerful asset for educators, scientists, and professionals who want to simplify complex relationships and showcase evolutionary connections.
How to use the cladogram template in Miro
Customize easily: Edit the template with just a few clicks, tailoring it to your specific requirements. Change labels, change branches, and adjust the structure effortlessly.
Automated diagramming: Leverage Miro's automated diagramming features to expand your cladogram. The platform intelligently adjusts the layout as you add or remove elements, ensuring a visually appealing and logically structured diagram.
Add context: Enhance your cladogram by incorporating artifacts from your Miro board. This could include images, text, or other relevant materials, providing additional context and depth to your evolutionary representation.
Why use a cladogram template?
Simplify complex concepts: Simplify intricate evolutionary relationships and present them in a clear and comprehensible format.
Enhance collaboration: Facilitate team collaboration by visualizing a shared understanding of evolutionary connections.
Save time: Use the template's user-friendly design and automation features, which allow you to focus on content rather than formatting.
Dynamic adaptability: Adapt your cladogram quickly as new information arises or concepts evolve, ensuring that your diagrams remain relevant.
Effective communication: Communicate complex ideas effectively, whether in the classroom, research setting, or professional environment.
Find out all the features of Miro's cladogram maker and start building your diagram right now.
Can I customize the colors and shapes of elements in the cladogram?
Miro's cladogram template allows complete customization, including colors, shapes, and labels, empowering you to create visually appealing and informative diagrams.
Can I export the cladogram created in Miro to other file formats?
Yes, Miro supports various export formats, ensuring that your cladogram can be shared in multiple ways, such as PDFs or images.
Get started with this template right now.
Azure Architecture Diagram Template
Works best for:
Software Development, Diagrams
The Azure Architecture Diagram Template is a diagram that will help you visualize the combination of any data and build and deploy custom machine learning models at scale. Azure is Microsoft’s cloud computing platform, designed to provide cloud-based services such as remote storage, database hosting, and centralized account management. Use Azure Architecture Diagram template to build sophisticated, transformational apps.
Datavant Switchboard with AWS Clean Rooms Template
Works best for:
AWS
The AWS Datavant Switchboard Clean Rooms Template integrates health data sources using Datavant's secure data connection capabilities and AWS Clean Rooms' scalable data processing environment. It's useful for professionals in engineering, database management, and development. The customizable Miro interface streamlines secure and efficient data handling and team collaboration for a wide range of projects.
20/80 Process Diagram - EOS Compatible
Works best for:
Diagramming
The 20/80 Process Diagram - EOS® Compatible template is a visual tool for mapping out processes and workflows aligned with the Entrepreneurial Operating System (EOS®) methodology. It provides a structured framework for identifying core processes and key activities that drive business outcomes. This template enables organizations to streamline operations, clarify roles and responsibilities, and enhance accountability. By promoting alignment with EOS® principles, the 20/80 Process Diagram empowers teams to achieve organizational excellence and drive sustainable growth.
AWS Git to S3 Webhooks Template
Works best for:
Software Development, Diagrams
The AWS Git to S3 Webhooks Template is a visual representation of Git webhooks with AWS services Quick Start architecture. You can now have an overview of your AWS architecture with Miro’s AWS Git to S3 Webhooks Template, track your cloud solutions easily, and optimize processes like never before.
Flow Diagrams
Works best for:
Diagramming
The Flow Diagrams template offers a versatile tool for visualizing processes, workflows, and systems. It provides a range of shapes and connectors for creating flowcharts, process maps, and data flow diagrams. This template enables teams to represent complex systems and processes in a clear and structured manner, facilitating communication and decision-making. By promoting visual clarity and understanding, Flow Diagrams empower teams to analyze and optimize processes effectively, driving efficiency and productivity.
BPMN 2.0
Works best for:
Diagramming
The BPMN 2.0 template offers a visual notation for modeling business processes using the Business Process Model and Notation (BPMN) standard. It provides elements for defining process flows, activities, and decision points. This template enables teams to document and analyze business processes systematically, facilitating process optimization and automation. By promoting standardization and clarity in process modeling, the BPMN 2.0 template empowers organizations to improve efficiency, agility, and compliance in their operations.