
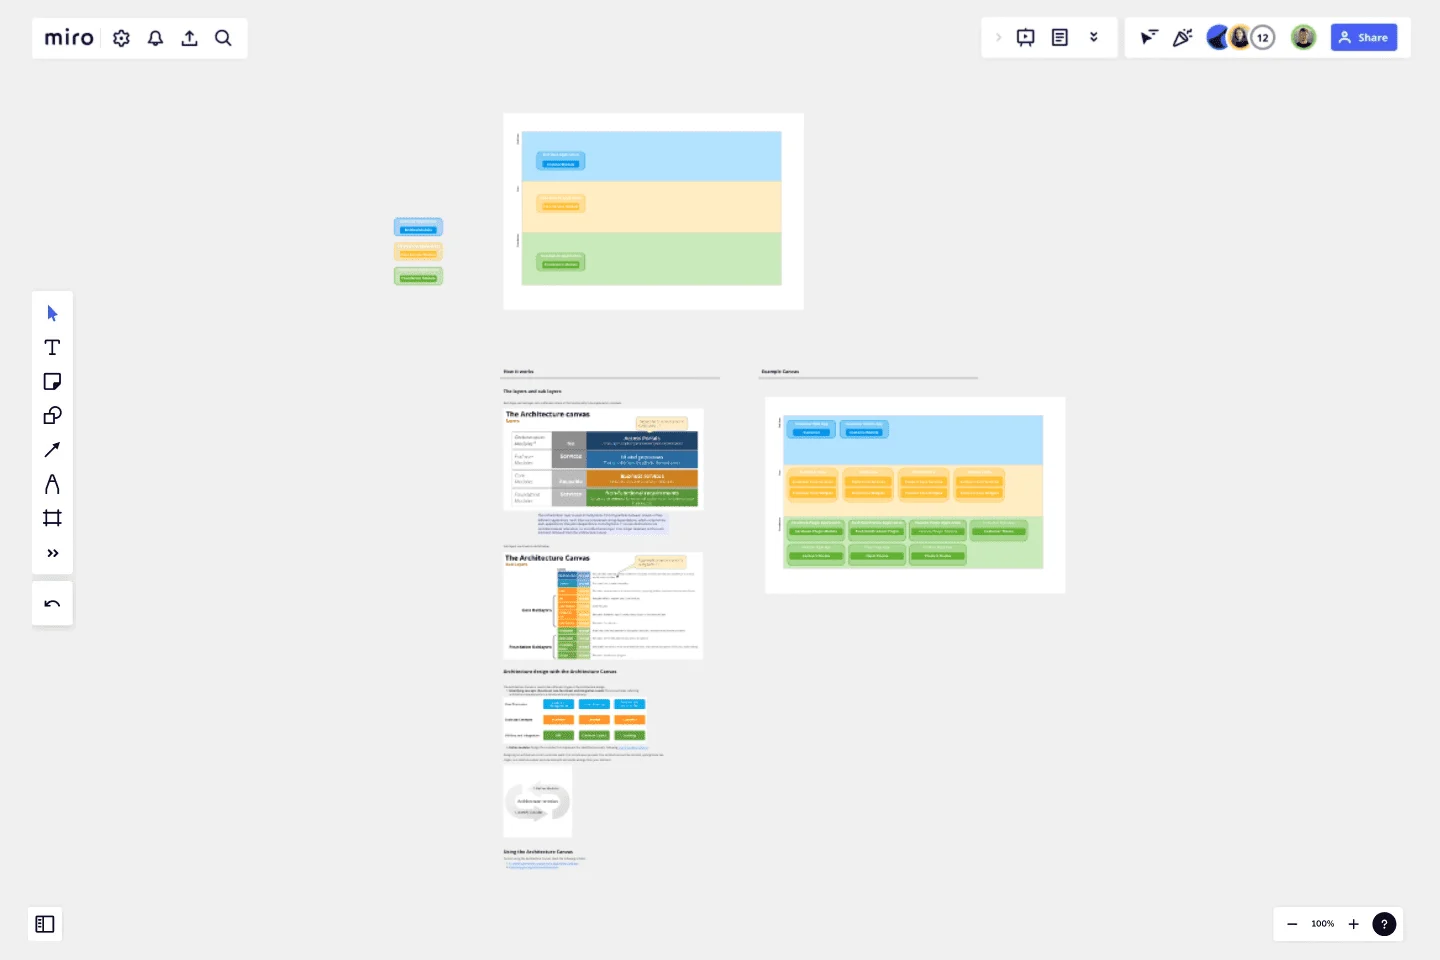
OutSystems Architecture Diagram
Create OutSystems Architecture canvases easily with Miro
Create OutSystems Architecture canvases easily with Miro
The Architecture Canvas is an OutSystems architecture tool to make the design of Service-Oriented Architectures (SOA) simple.
It promotes the correct abstraction of reusable (micro)services and the correct isolation of distinct functional modules in cases where you are developing and maintaining multiple applications that reuse common modules.
Get started with this template right now.
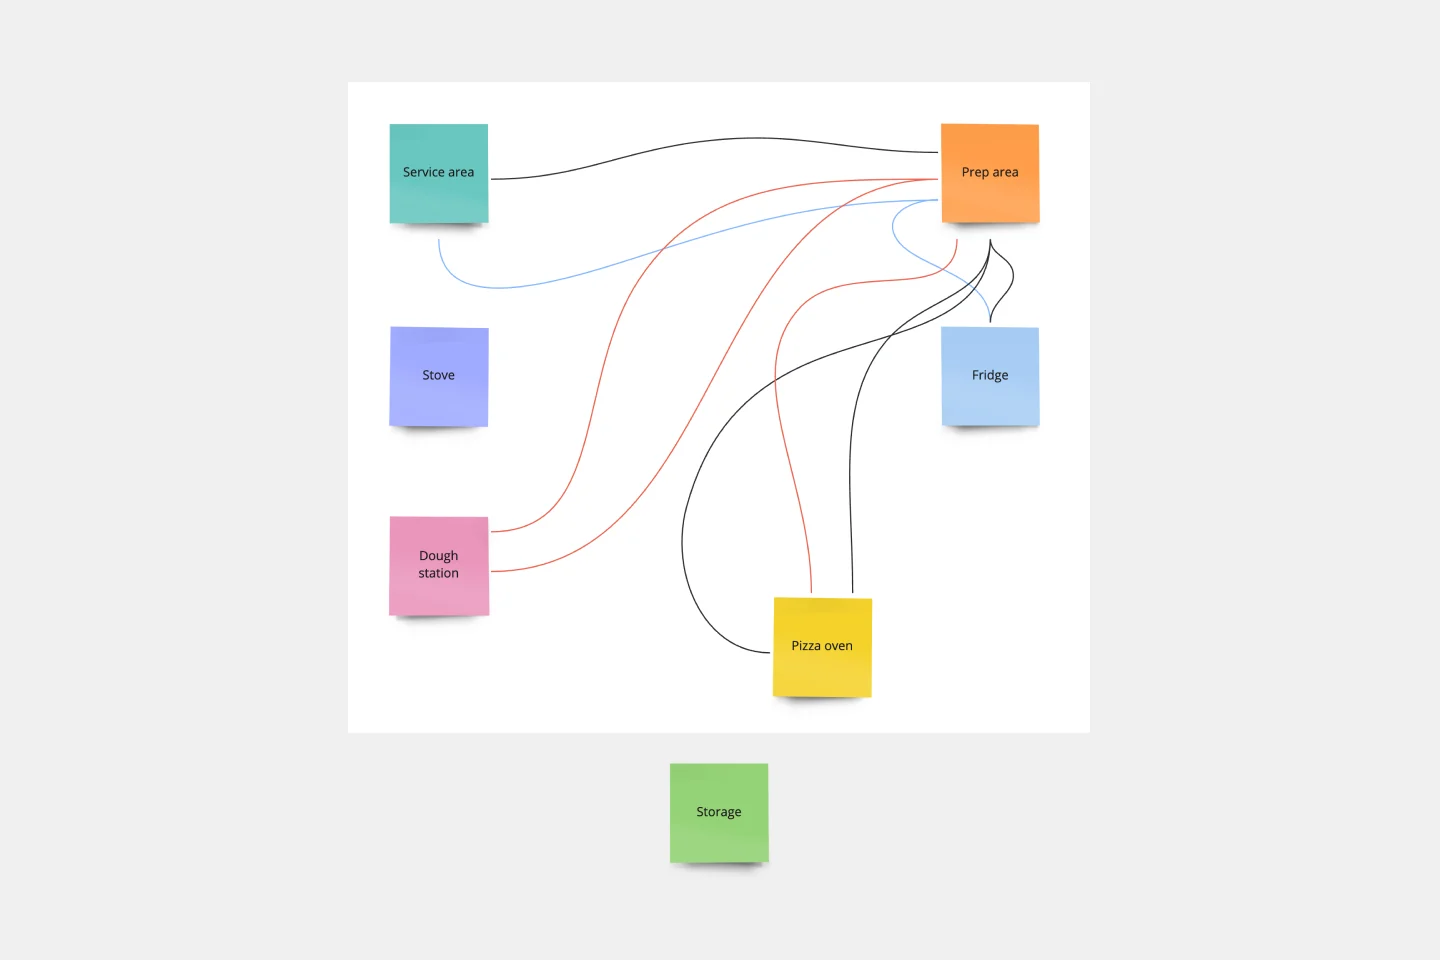
Spaghetti Diagram Template
Works best for:
Operations, Mapping, Diagrams
Spaghetti diagrams are valuable for finding connections between assets, services, and products, as well as identifying dependencies in a visual way. Use this template to get an overview of a process and quickly find areas of improvement.
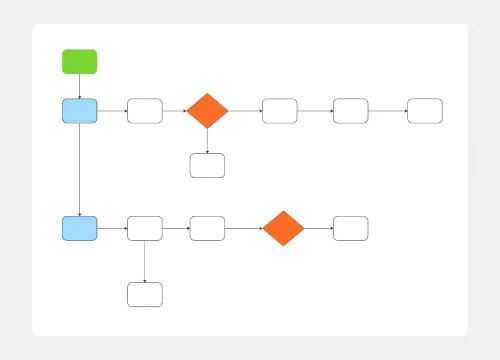
20/80 Process Diagram - EOS® Compatible
Works best for:
Diagramming
The 20/80 Process Diagram - EOS® Compatible template is a visual tool for mapping out processes and workflows aligned with the Entrepreneurial Operating System (EOS®) methodology. It provides a structured framework for identifying core processes and key activities that drive business outcomes. This template enables organizations to streamline operations, clarify roles and responsibilities, and enhance accountability. By promoting alignment with EOS® principles, the 20/80 Process Diagram empowers teams to achieve organizational excellence and drive sustainable growth.
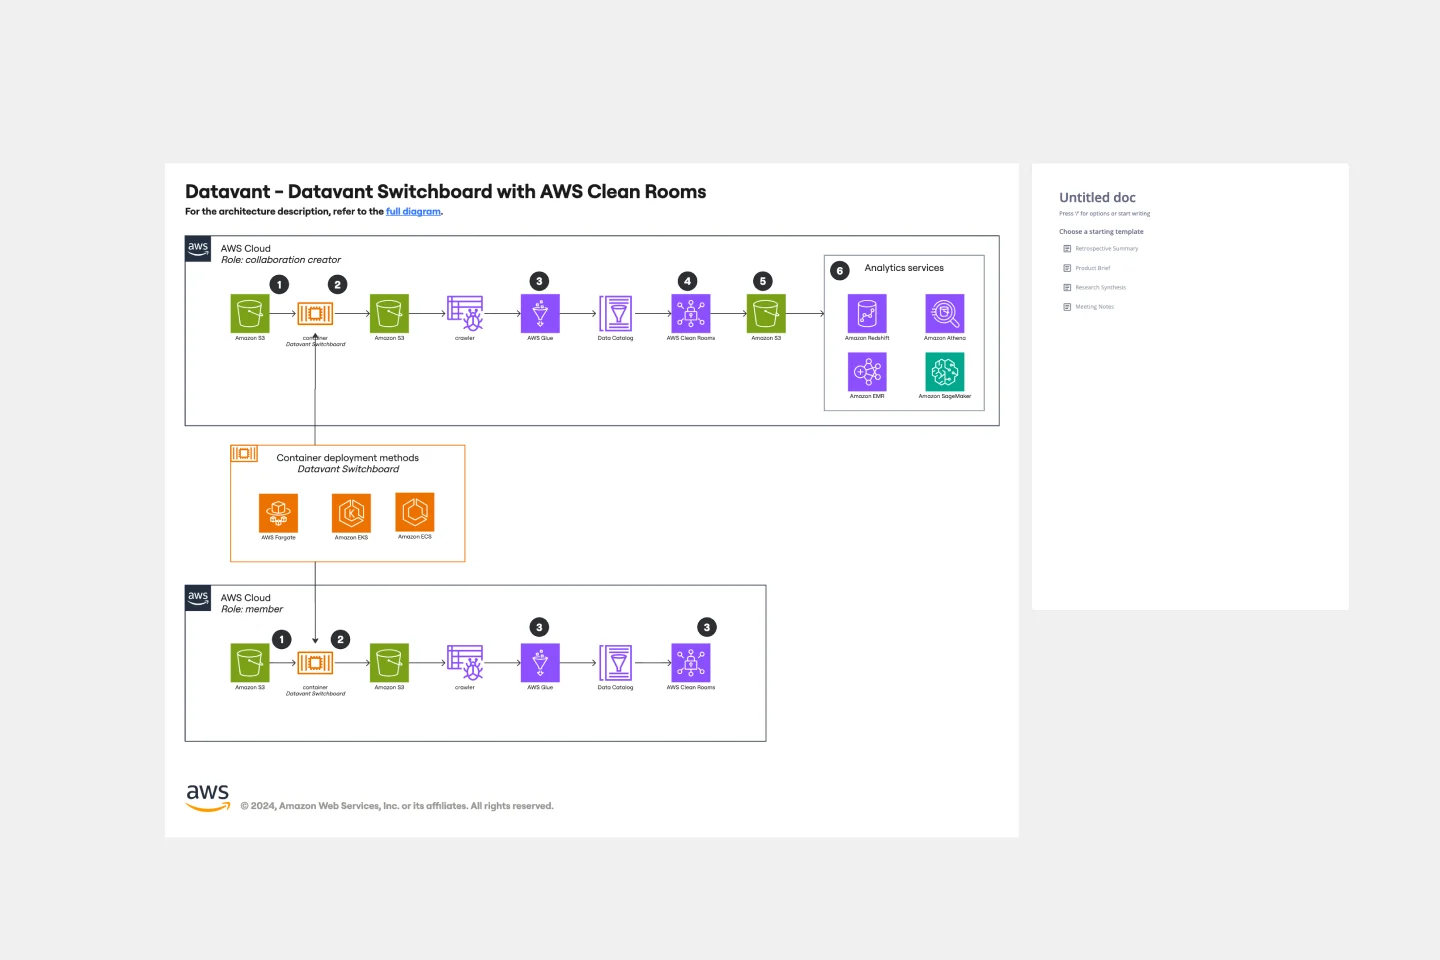
Datavant Switchboard with AWS Clean Rooms Template
Works best for:
AWS
The AWS Datavant Switchboard Clean Rooms Template integrates health data sources using Datavant's secure data connection capabilities and AWS Clean Rooms' scalable data processing environment. It's useful for professionals in engineering, database management, and development. The customizable Miro interface streamlines secure and efficient data handling and team collaboration for a wide range of projects.
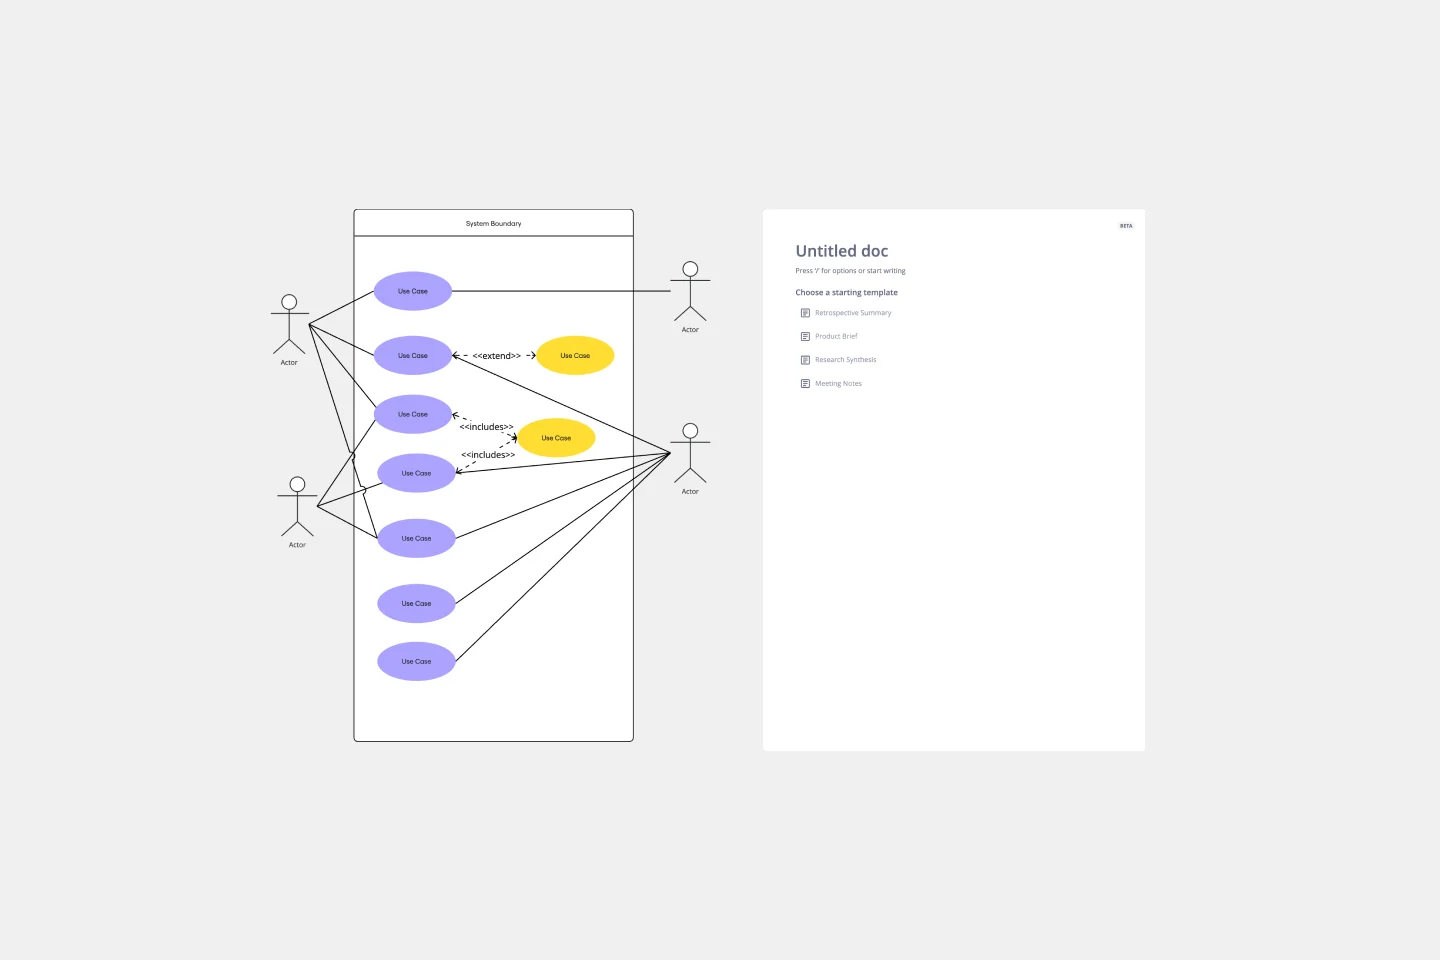
Use Case Diagram Template
Works best for:
Marketing, Market Research, Diagrams
A use case diagram is a visual tool that helps you analyze the relationships between personas and use cases. Use case diagrams typically depict the expected behavior of the system: what will happen and when. A use case diagram is helpful because it allows you to design a system from the perspective of the end user. It’s a valuable tool for communicating your desired system behavior in the language of the user, by specifying all externally visible system behavior.
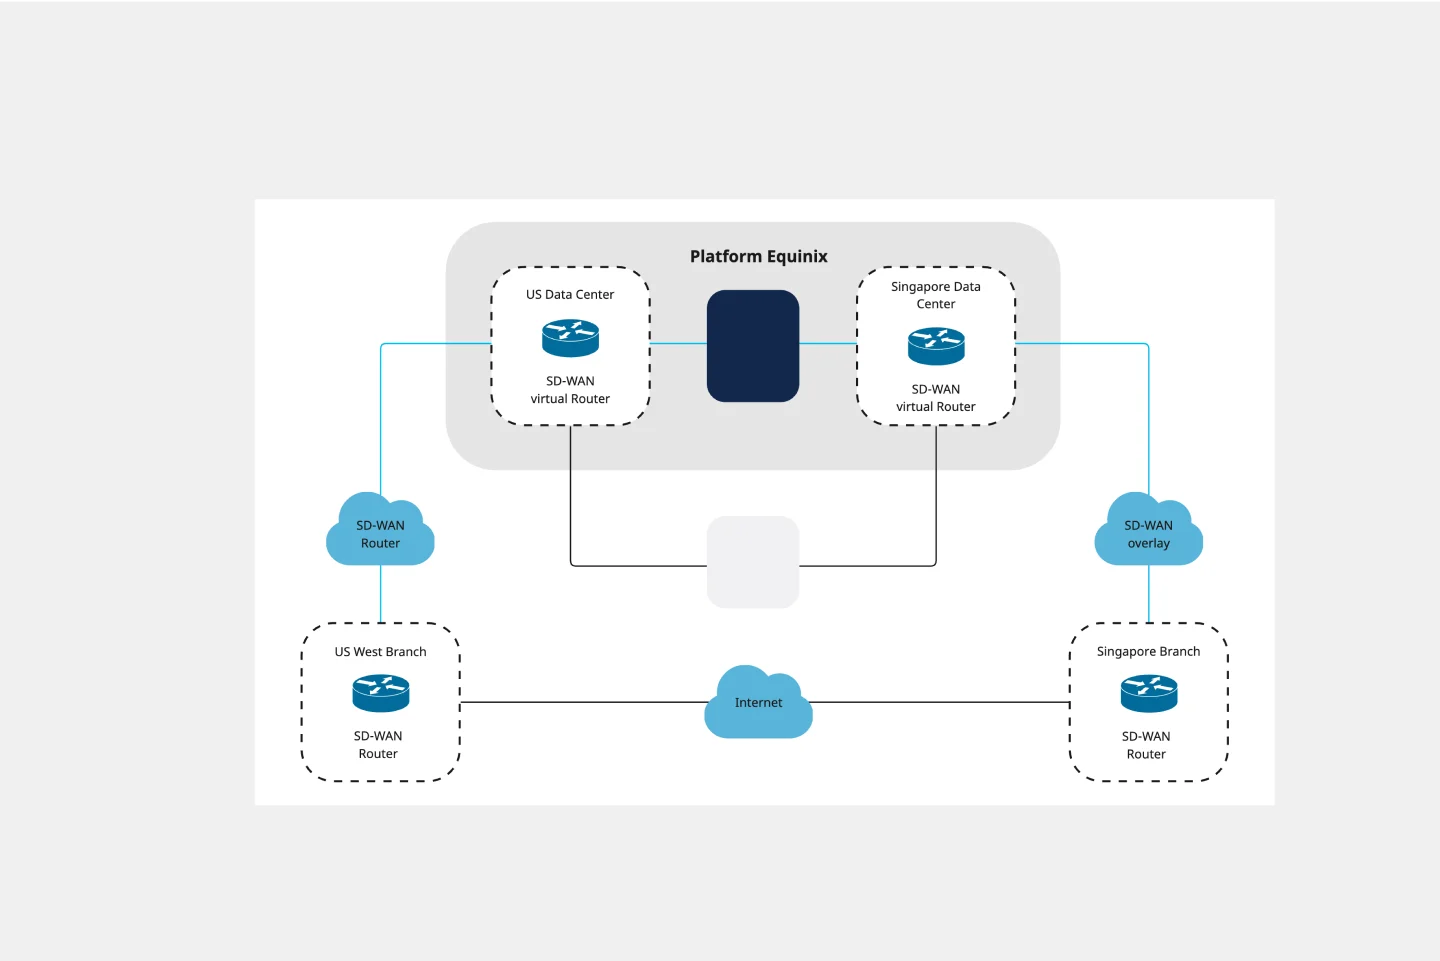
Cisco Data Network Diagram Template
Works best for:
Software Development
Cisco offers data center and access networking solutions built for scale with industry-leading automation, programmability, and real-time visibility. The Cisco Data Network Diagram uses Cisco elements to show the network design of Cisco Data Networks visually.
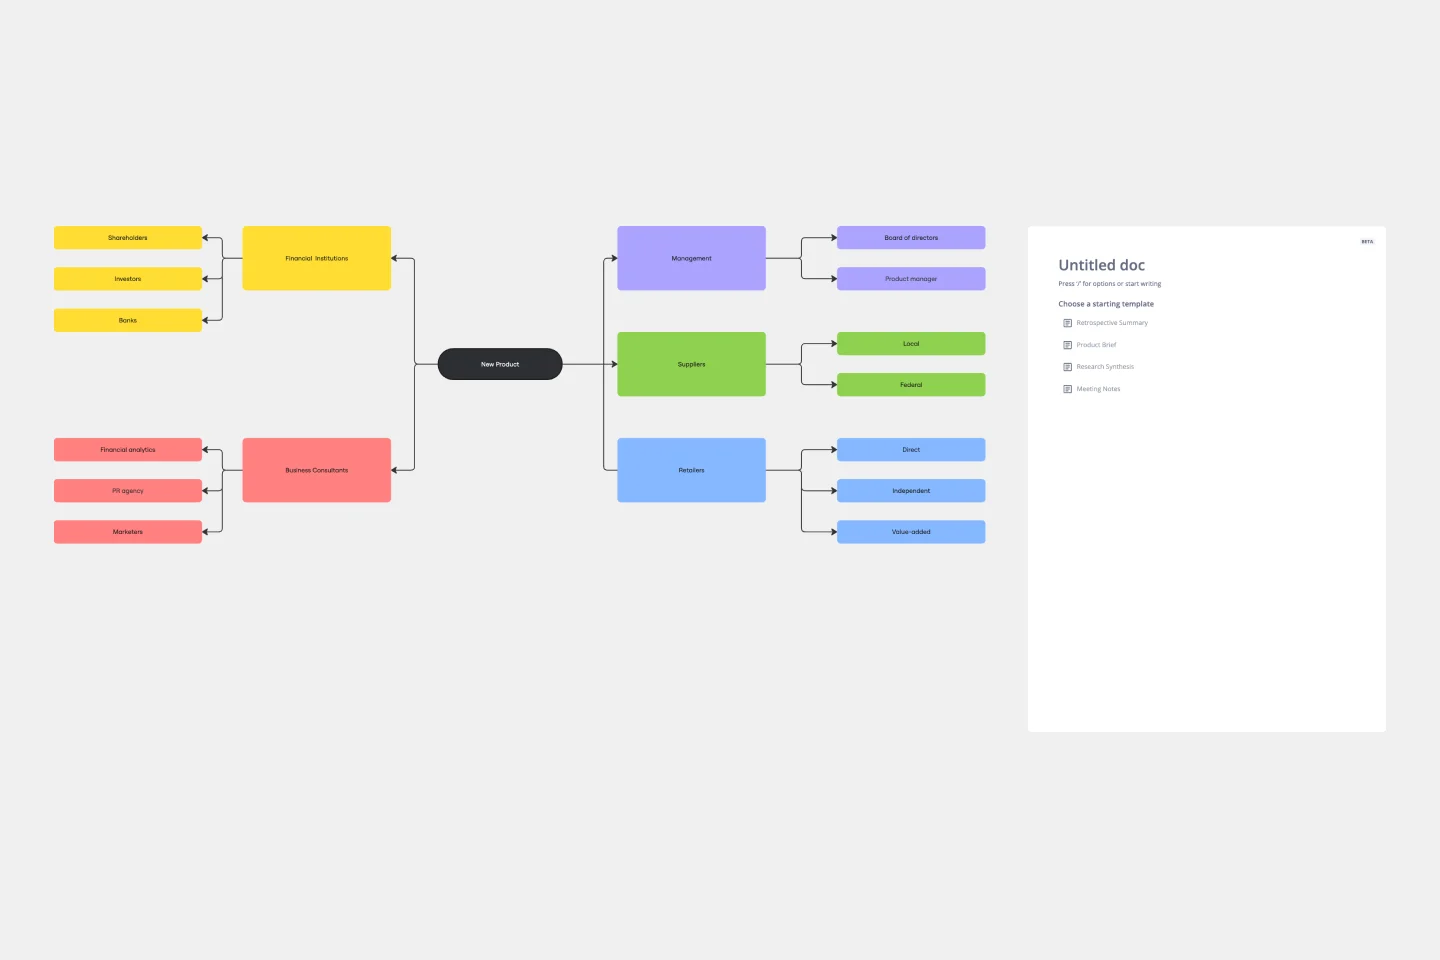
Stakeholder Mapping Template
Works best for:
Business Management, Mapping, Workflows
A stakeholder map is a type of analysis that allows you to group people by their power and interest. Use this template to organize all of the people who have an interest in your product, project, or idea in a single visual space. This allows you to easily see who can influence your project, and how each person is related to the other. Widely used in project management, stakeholder mapping is typically performed at the beginning of a project. Doing stakeholder mapping early on will help prevent miscommunication, ensure all groups are aligned on the objectives and set expectations about outcomes and results.