Org Chart
382 templates
Company Organization Chart
436 likes
4.3K uses
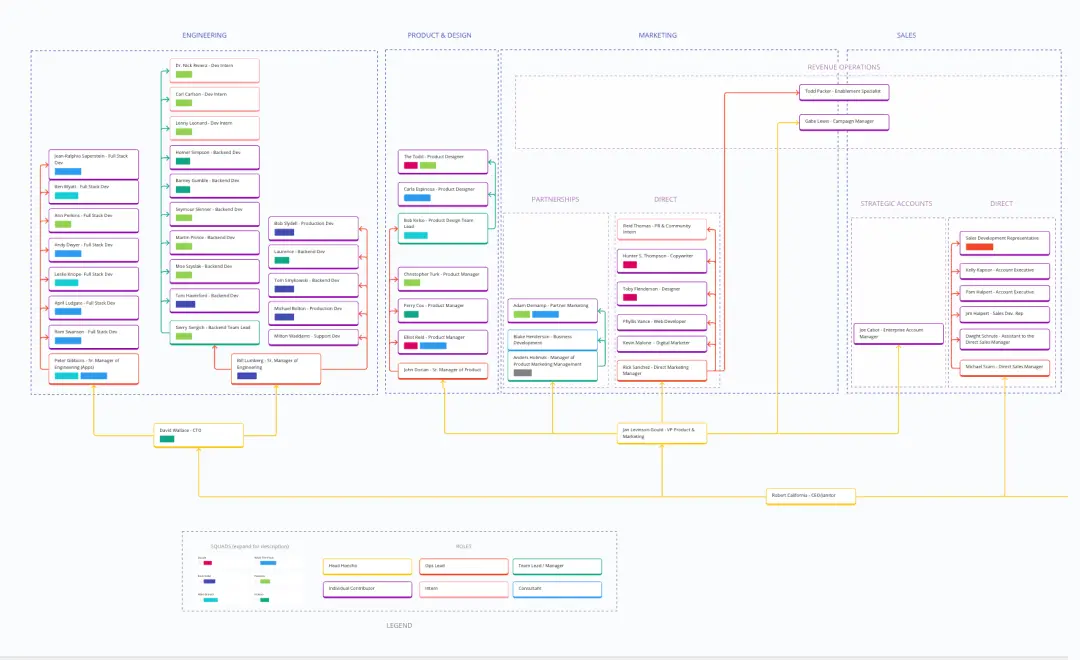
Company Organization Chart
The Company Organization Chart template enables clear visualization of hierarchical structures within an organization. It helps teams understand reporting lines, roles, and responsibilities, fostering transparency and alignment. With customizable features, such as color-coding and labeling, this template facilitates effective communication and decision-making across departments and levels.
Org Topologies™ 2025
40 likes
415 uses
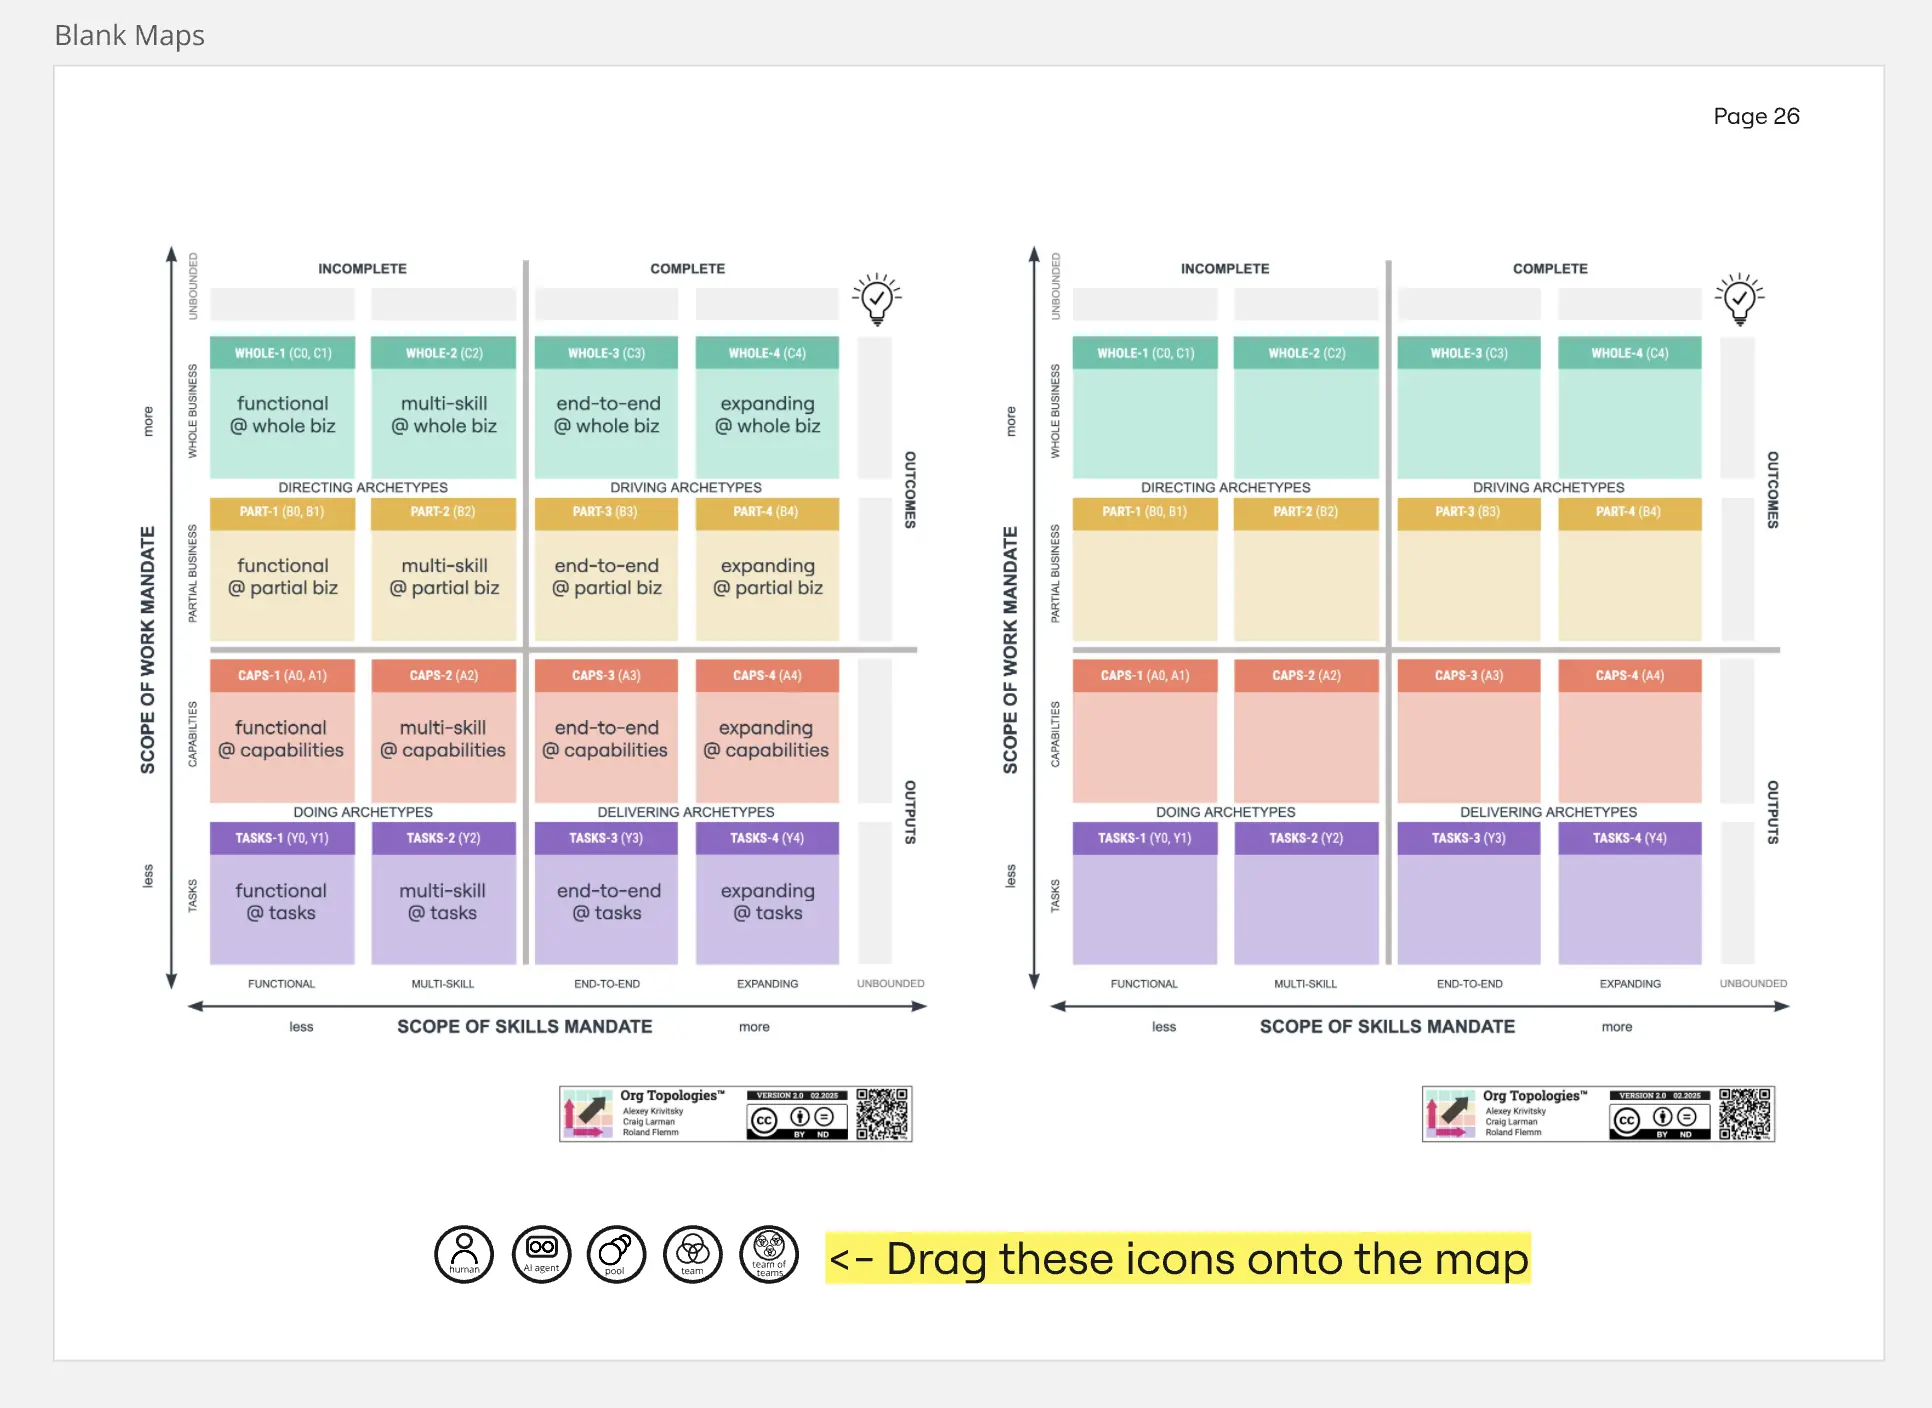
Org Topologies™ 2025
The Org Topologies™ template provides a comprehensive overview of organizational structures. By visualizing different topology models, such as hierarchical, matrix, or network structures, this template helps teams understand organizational dynamics and design effective structures. With examples and explanations of each topology, this template supports informed decision-making in organizational design.
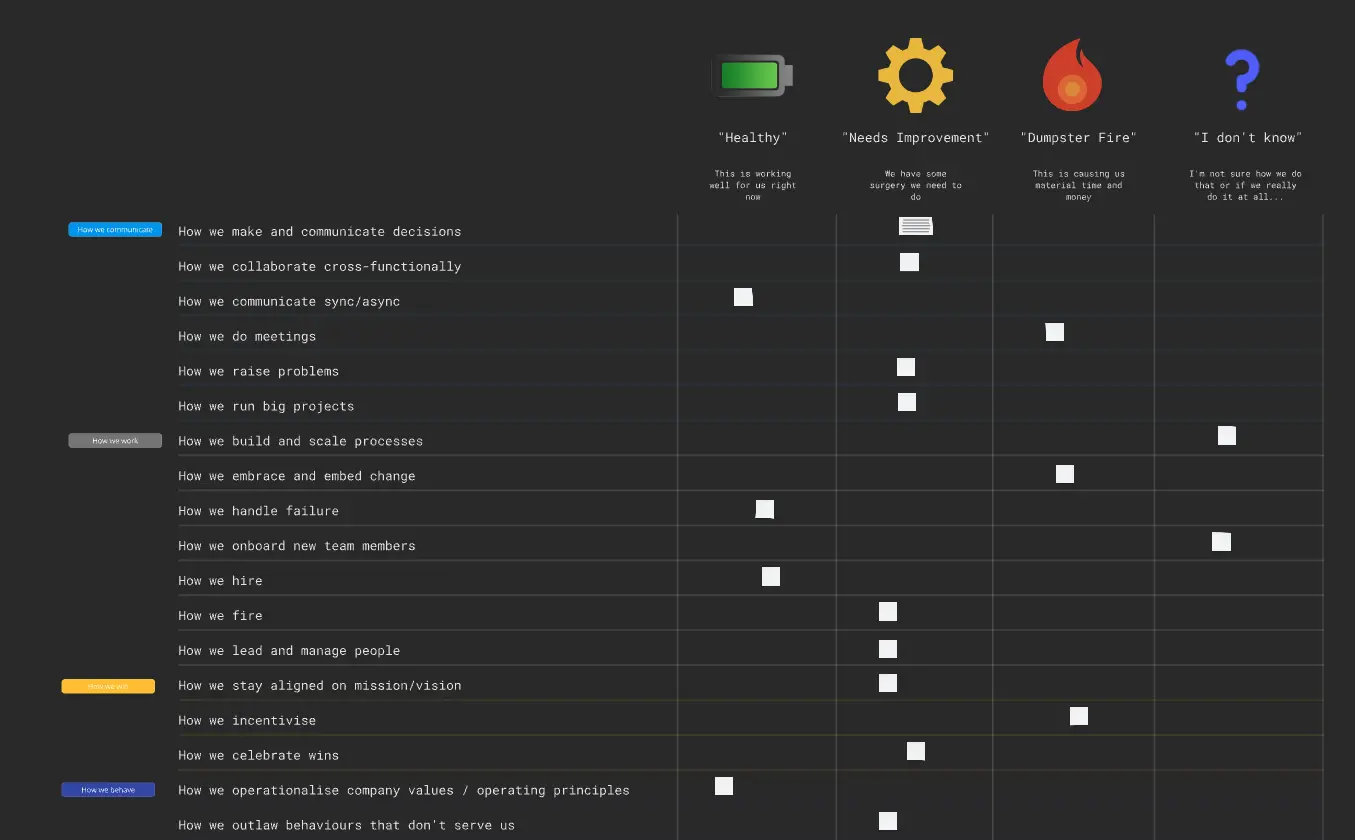
Open Org Culture Design Toolkit
31 likes
340 uses
Pie Chart Template
0 likes
336 uses
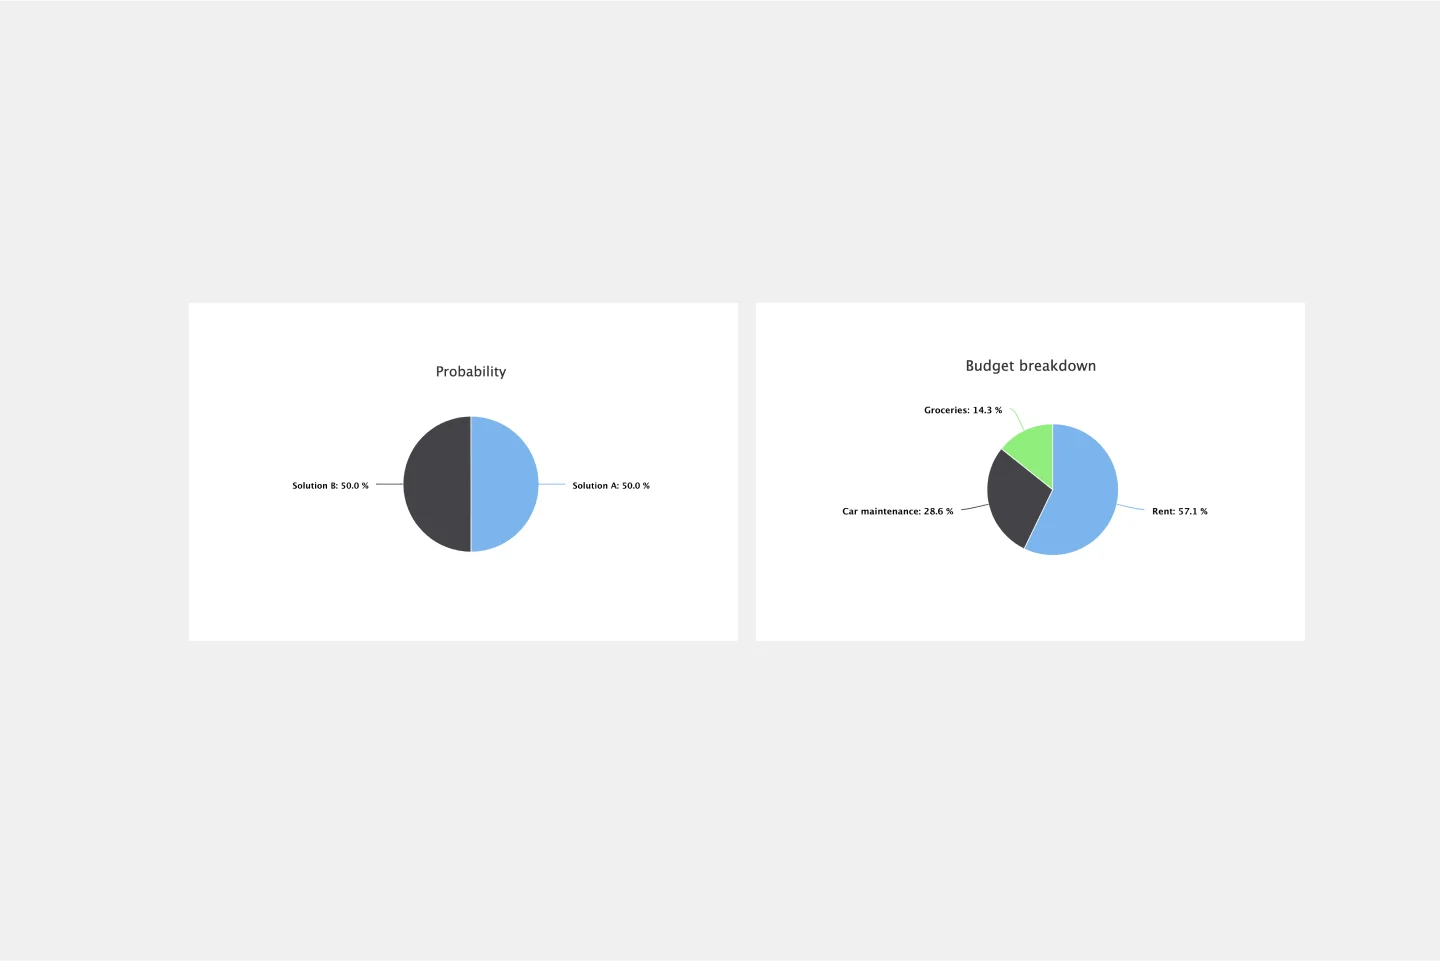
Pie Chart Template
Pie charts are an excellent way to present relationships between datasets graphically, where you can quickly compare information and see contrast right away. Professionals from many fields use pie charts to support their presentations and enrich their storytelling as it’s one of the most commonly used data charts.
Mandala Chart Template
5 likes
242 uses
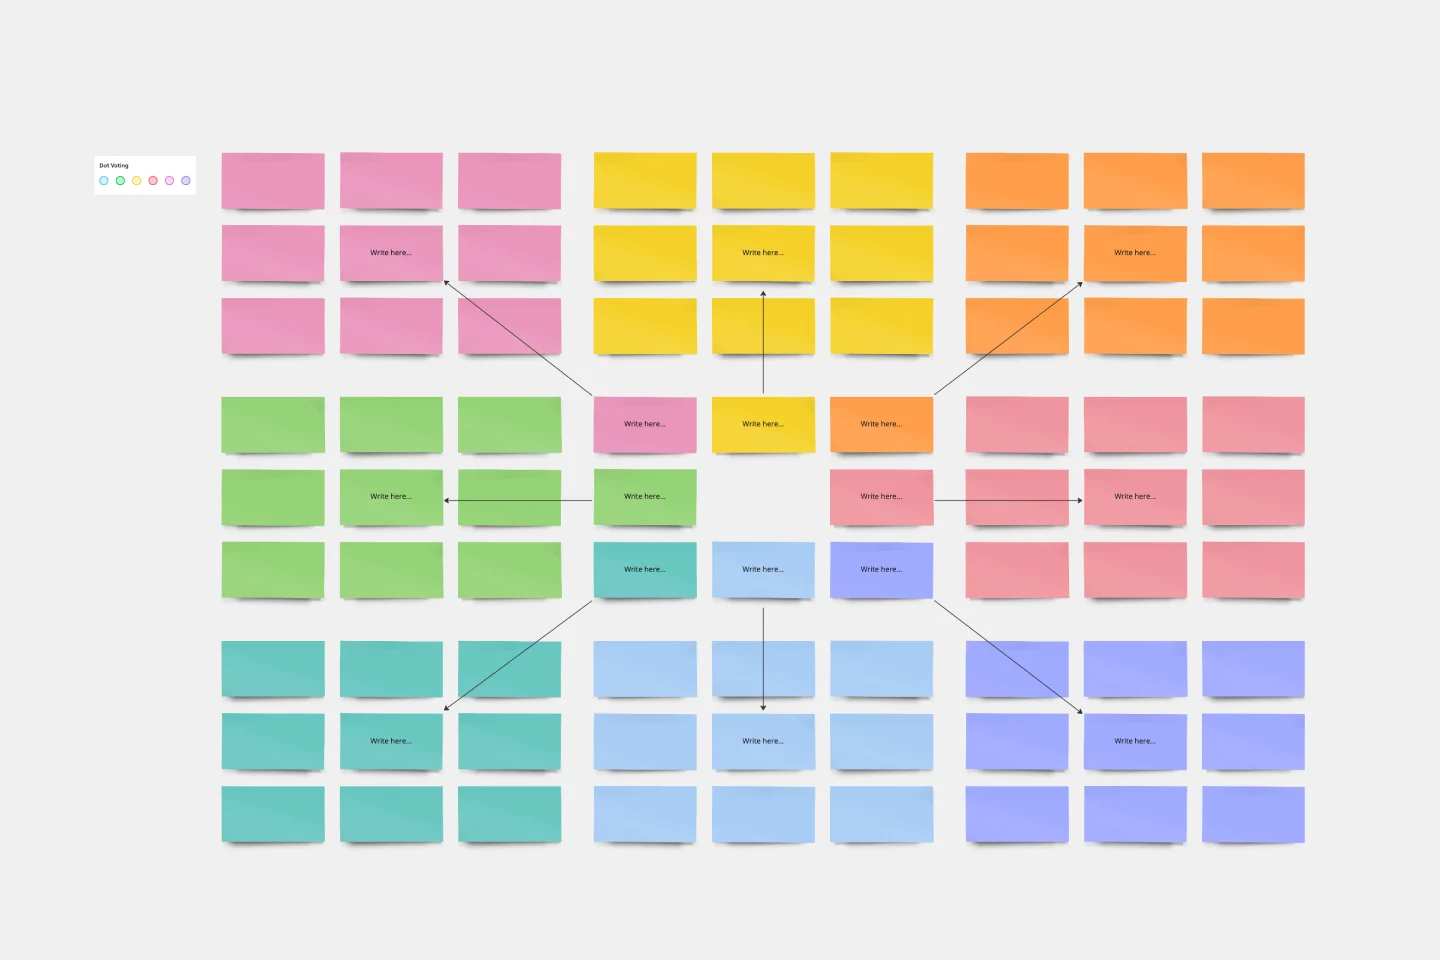
Mandala Chart Template
The Mandala Chart Template helps you visualize the relationships between a central theme and its sub-themes. One of the key benefits is how it fosters a holistic understanding of any topic. This perspective ensures every detail is noticed, making it an invaluable asset for those aiming for comprehensive insight and thorough planning or a better understanding of their goals.
T-Chart Template
0 likes
5 uses
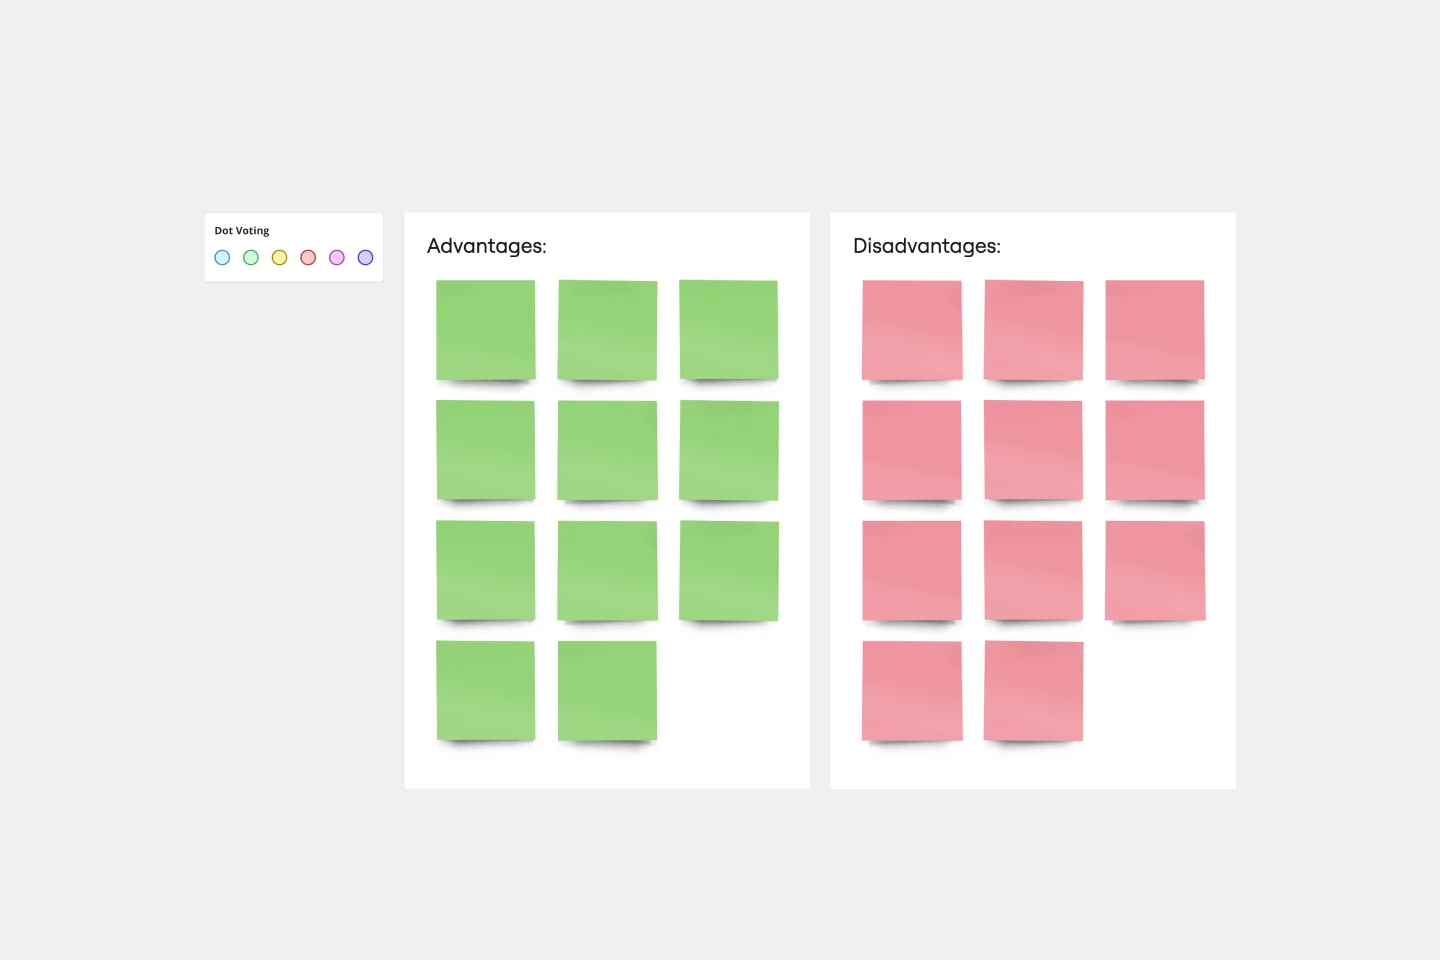
T-Chart Template
T-Charts can help you compare and contrast two different ideas, group information into different categories, and prove a change through “before” and “after” analysis. T-Charts are visual organizational tools that enable you to compare ideas, so you can evaluate pros and cons, facts and opinions, strengths and weaknesses, or big-picture views versus specific details. Designers and content creators can use T-Charts to turn possibilities into actionable ideas. T-Charts are useful for discussing differences and similarities with your team or clients and can help you to reach a decision together.
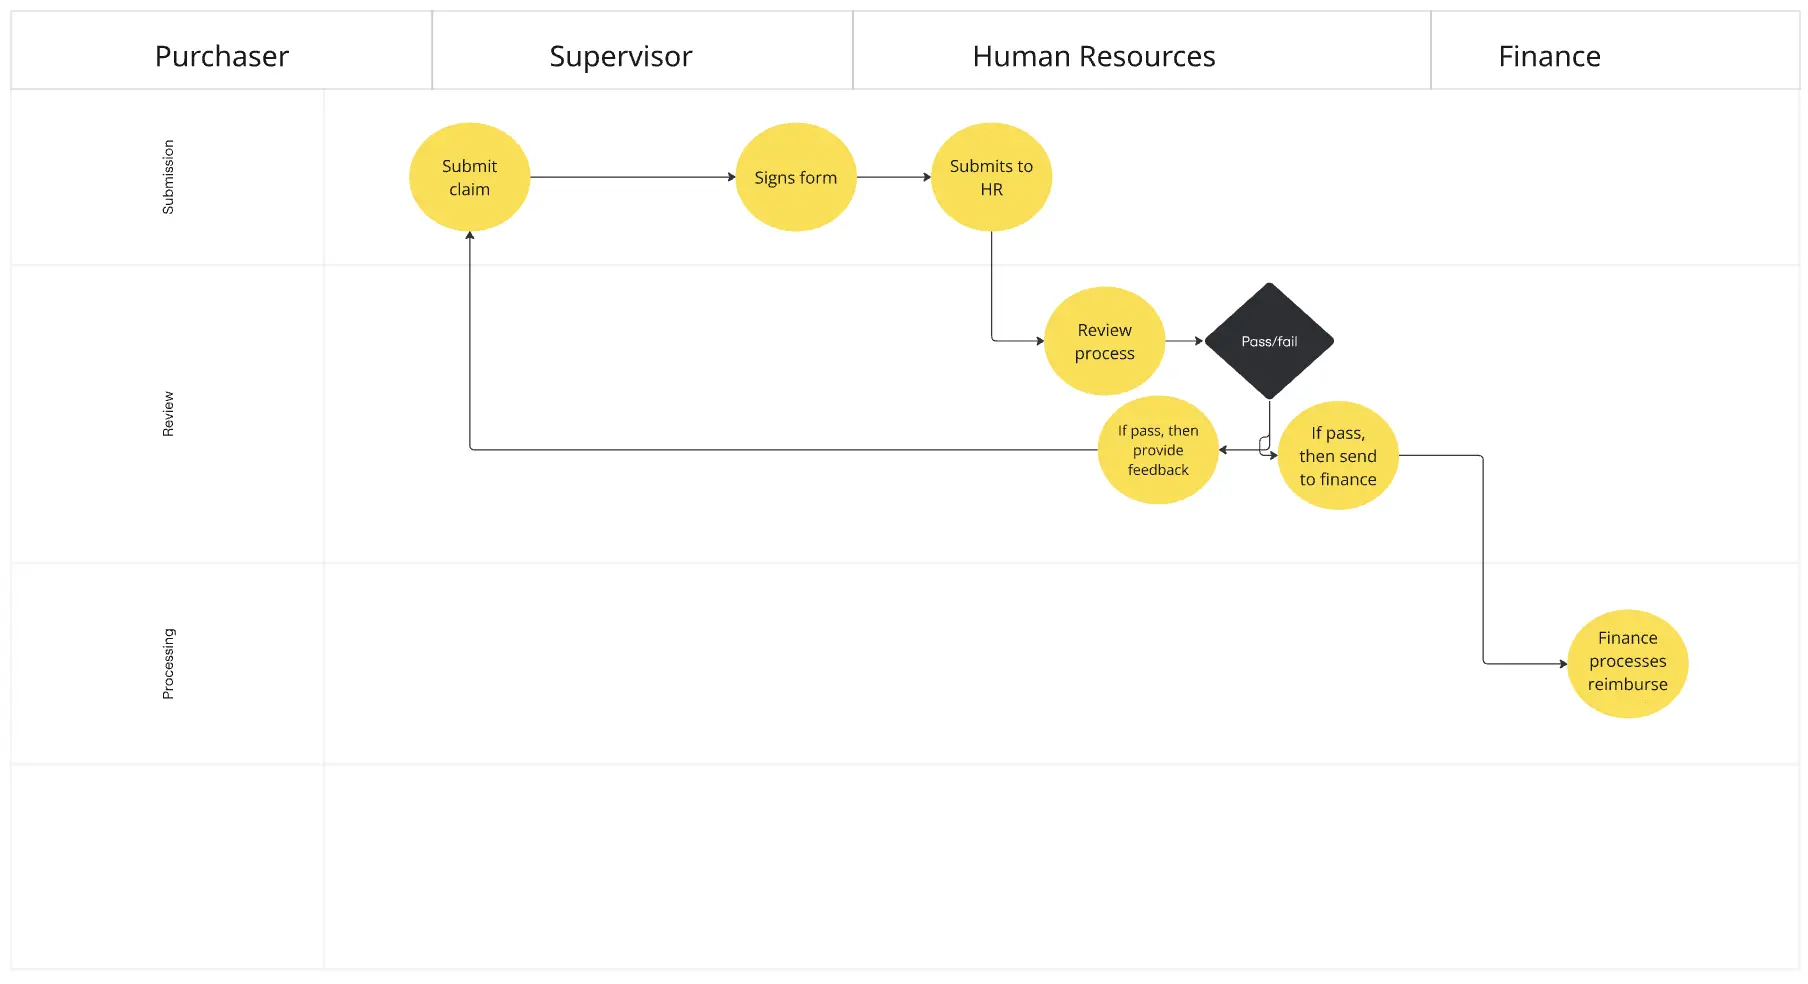
Swimlane Chart
2 likes
44 uses
Alignment Chart Template
0 likes
18 uses
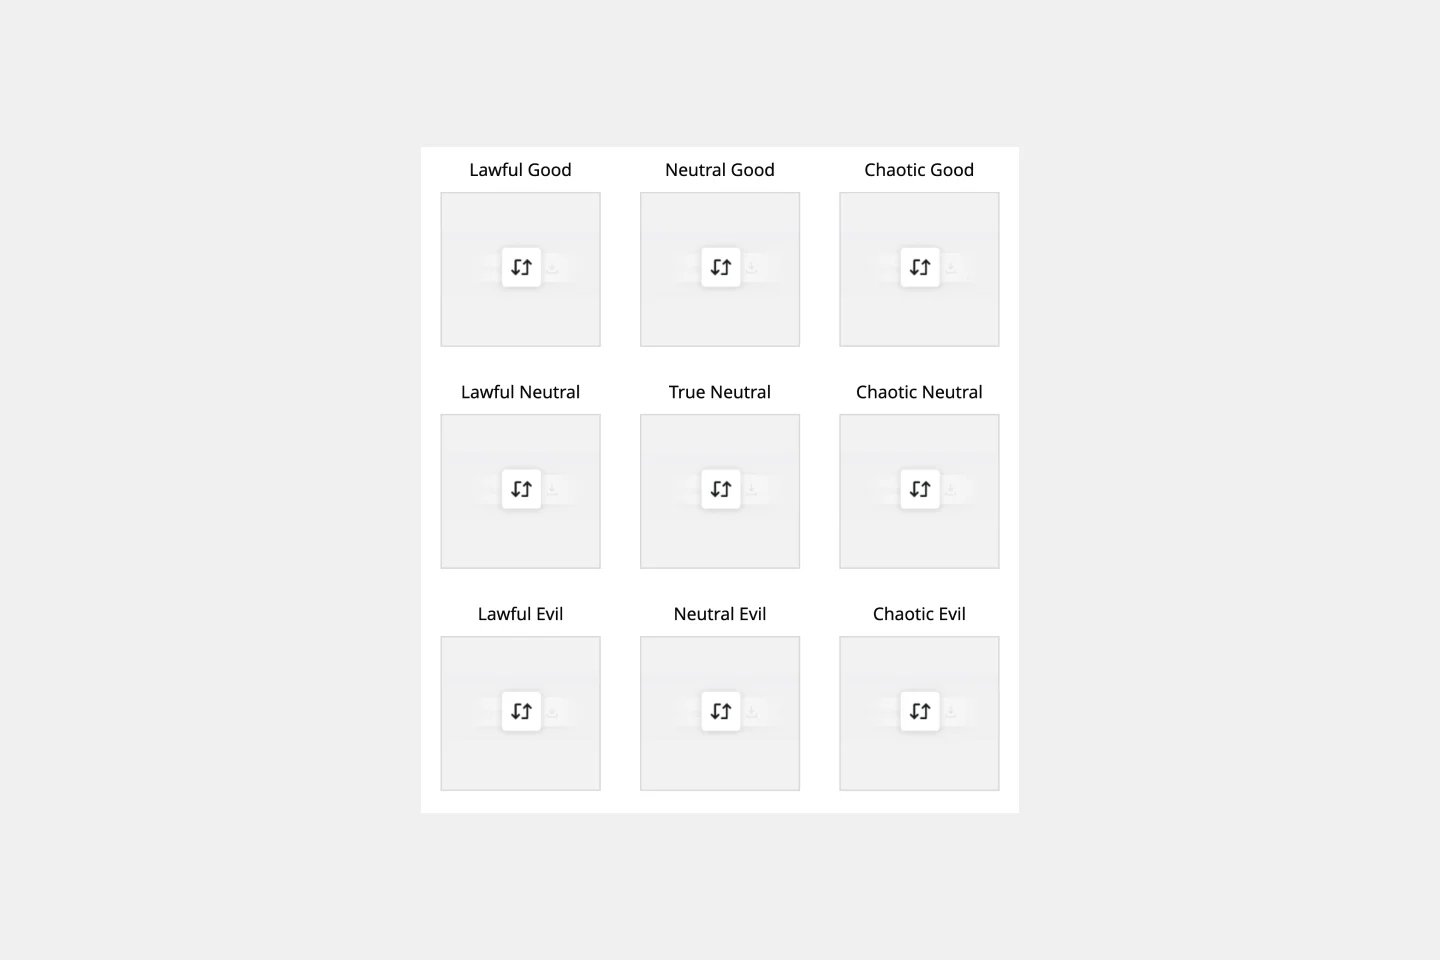
Alignment Chart Template
The alignment chart originated in the Dungeons & Dragons (D&D) fantasy role-playing game to allow players to categorize their characters according to their ethical and moral perspectives. Since then, people around the world have begun to use the alignment chart as a fun way to describe their own characteristics and personas, as well as fictional characters, famous people, and much more. In the conventional set-up, you figure out your placement in the alignment chart based on your views on law, chaoss, good, and evil. But you can adapt the alignment chart to reflect any characteristics you wish to use to create personas.
Gantt Chart Template
1 likes
204 uses
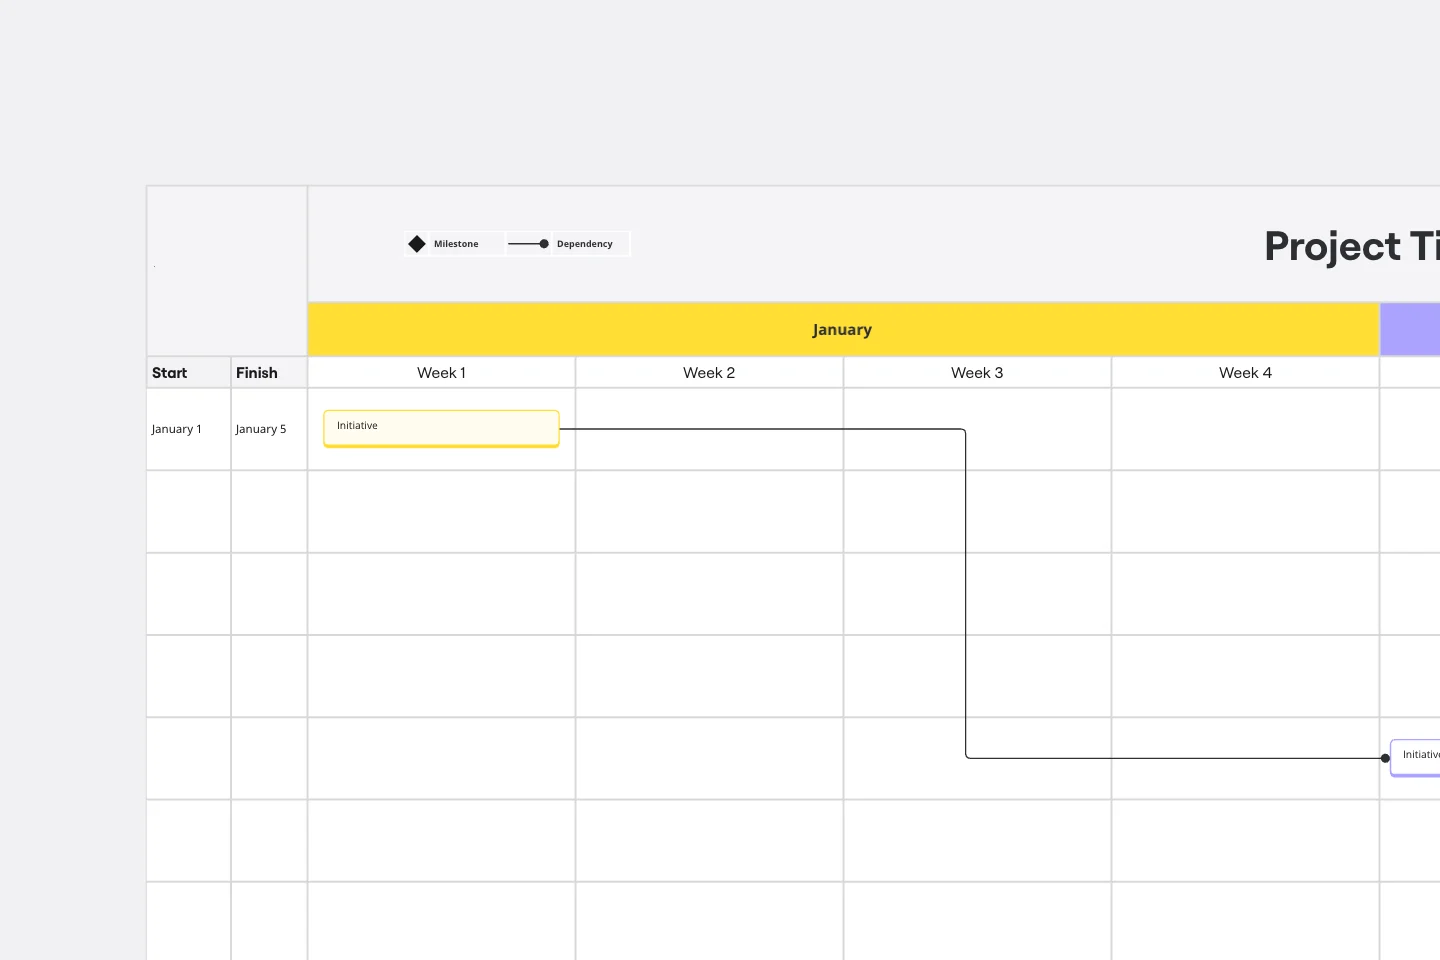
Gantt Chart Template
Simplicity, clarity, and power — that’s what make Gantt charts such a popular choice for organizing and displaying a project plan. Built upon a horizontal bar that represents the project progress over time, these charts break down projects by task, allowing the whole team to see the task status, who it’s assigned to, and how long it will take to complete. Gantt charts are also easily shareable among team members and stakeholders, making them great tools for collaboration.
Comparison Chart Template
0 likes
103 uses
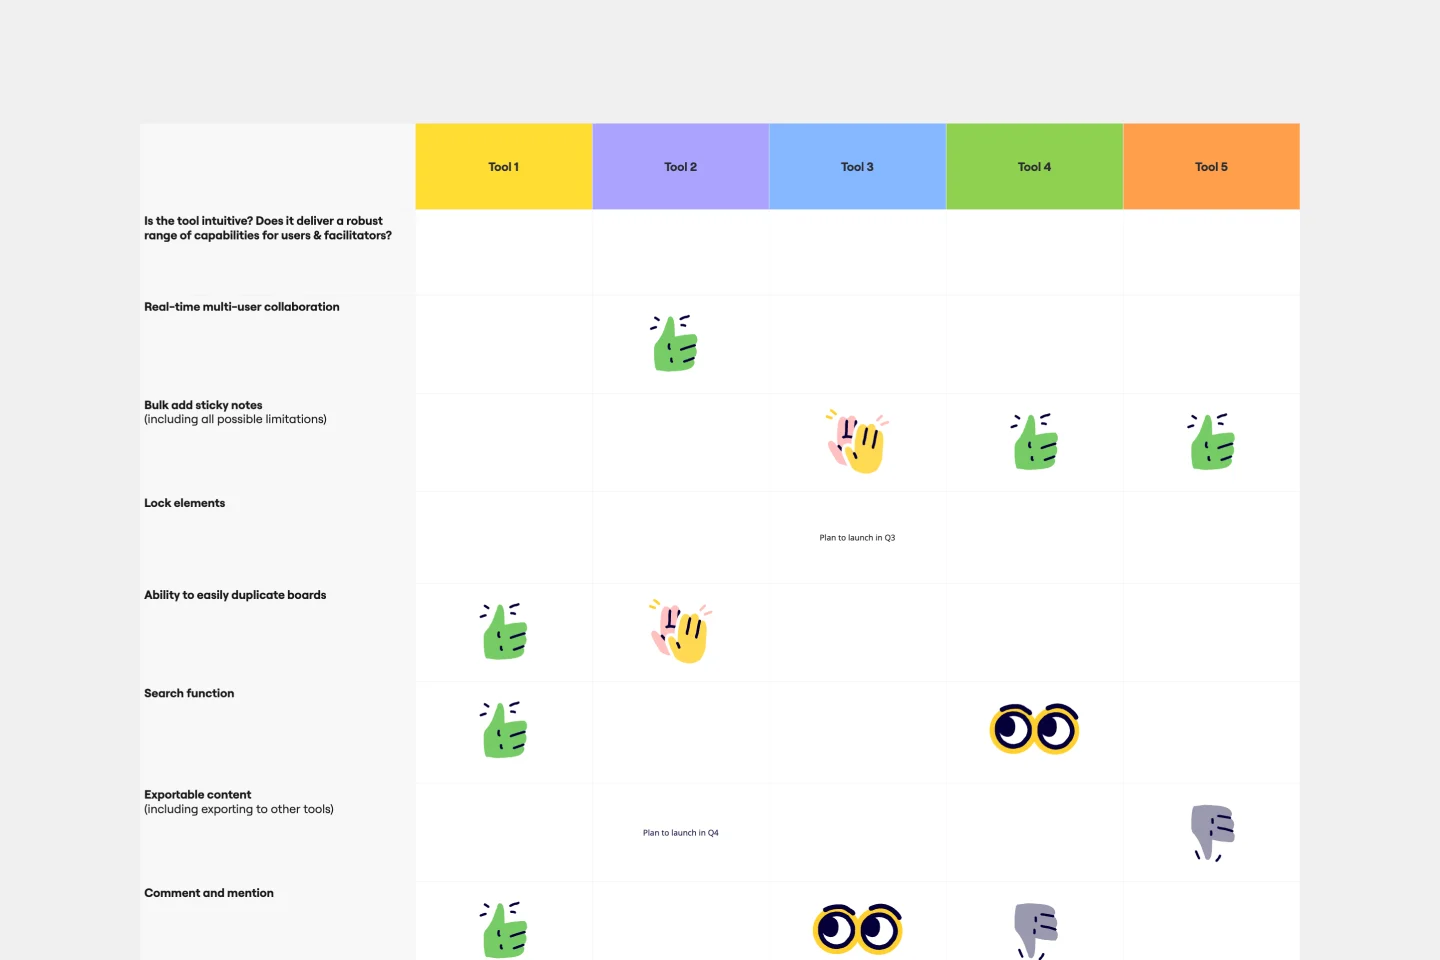
Comparison Chart Template
Eliminate wasted time and learn to make snap decisions both with your team and on your own. Comparison charts are perfect for collaboration, as they allow you to establish differences between ideas or products and get a full picture of the risks and benefits that come with them.
Milestone Chart Template
0 likes
35 uses
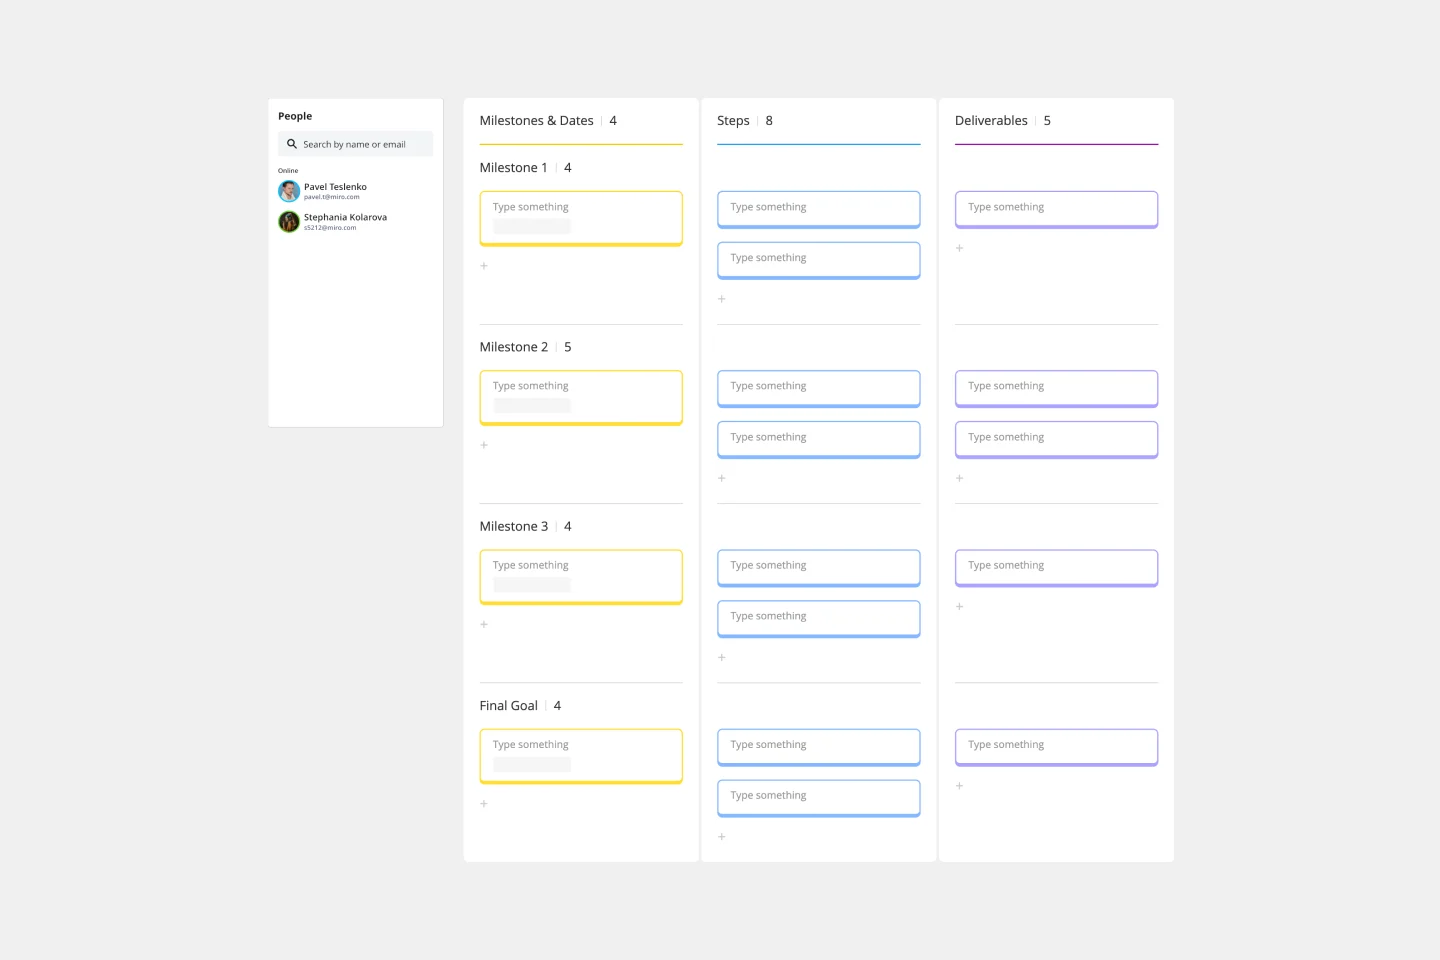
Milestone Chart Template
When your team is collaborating on a large project, keeping track of the many tasks and multiple timelines can be a challenge. That’s why you need a milestone chart. These visual representations of important project events will make it simple for your team to stay on schedule and reach goals on time. And it’s so easy to get started — just determine the major milestones, use our template to create a milestone chart, and define the key dates and deliverables each milestone will require.
KWL Chart Template
0 likes
20 uses
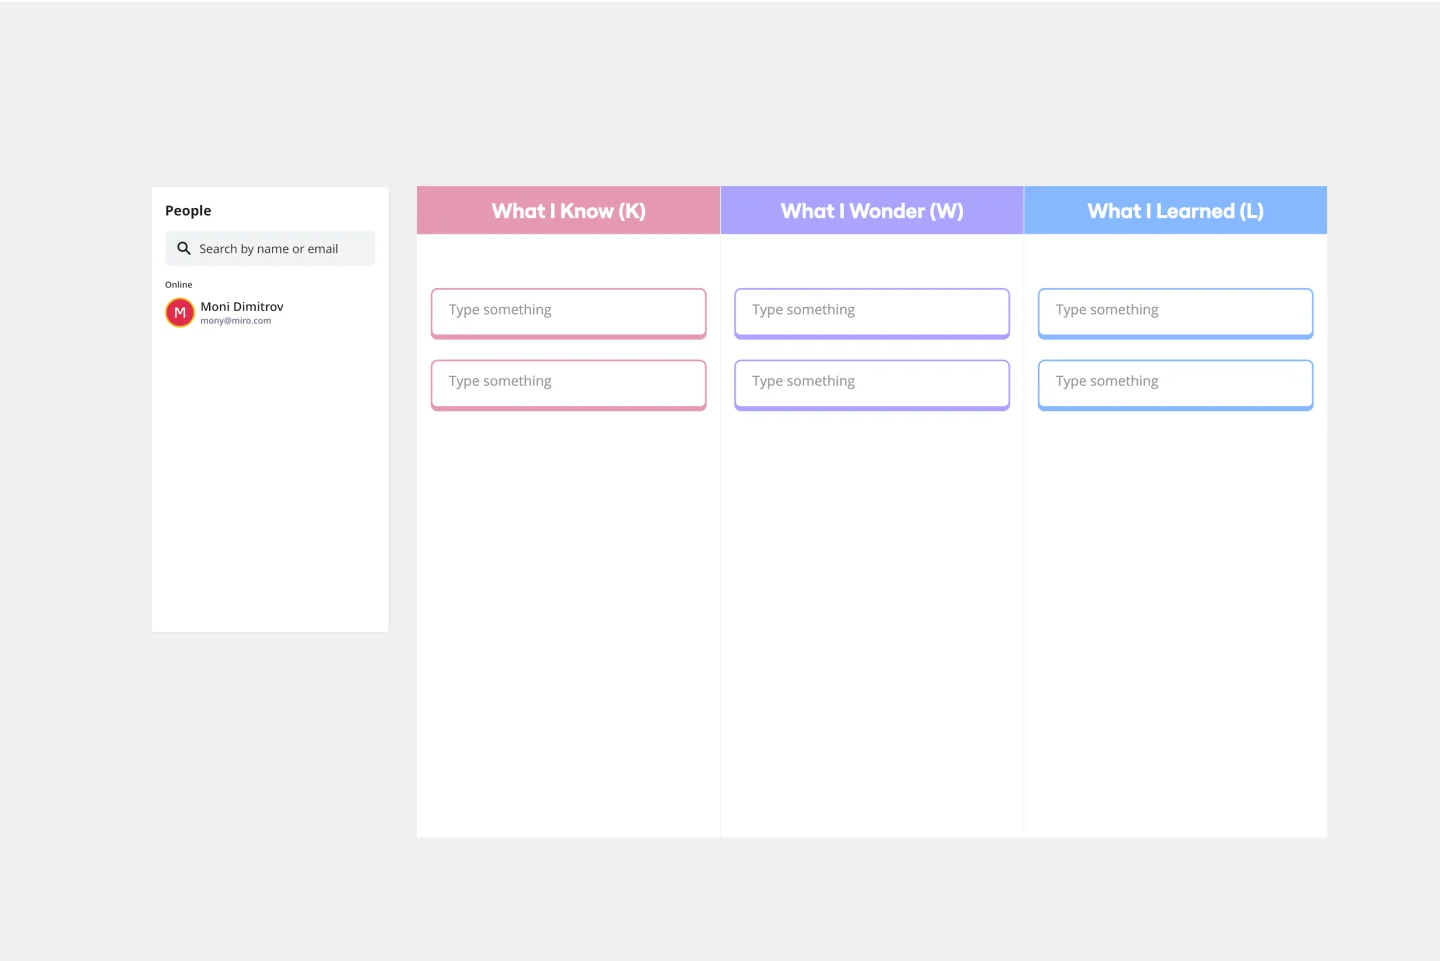
KWL Chart Template
Sharing and learning new knowledge is the fuel in the tank of any ambitious team or organization. A KWL chart is a graphical organizer that powers the learning process. This easy template lets you design and use a KWL, with three columns: Know, Want to Know, and Learned. Then you and your team will fill in each column by following three steps: Take stock of what you know, document what you want to get out of your session, and finally, record what you’ve learned.